Note
Access to this page requires authorization. You can try signing in or changing directories.
Access to this page requires authorization. You can try changing directories.
Find hidden connections in your data with root cause analysis (RCA) in the Power Automate Process Mining desktop app.
To create a new RCA, create an analysis.
In the open view, select Root cause analysis on the left panel.
In the Metric dropdown menu, select a metric.
On the Influenced by panel, select which attributes you think are important for that metric.
If you're not sure which attributes should be influencing your metric, choose all of them and the algorithm will find the best one. To select all attributes, select the circle to the left of the Metric name heading.
Select Analyze. The Analysis tab opens.
If you choose a main metric, you can't choose the same metric in Influenced by. Also, don't choose similar metrics in Influenced by as the main metric, as the algorithm will choose those metrics on every split. For example, if your main metric is Case duration, don't select Case Active Time in the Influenced by section, as this will provide you no new information.
Change options in the Analysis tab
You can customize the view to your preferences.
See more or less information in a node
Nodes are connected by arches (rules). Each node is a collection of data filtered by the rules in the arches connecting it to the root node.
To expand or collapse a node, select the plus or minus sign. The expanded view allows you to see more information about that part of the data.
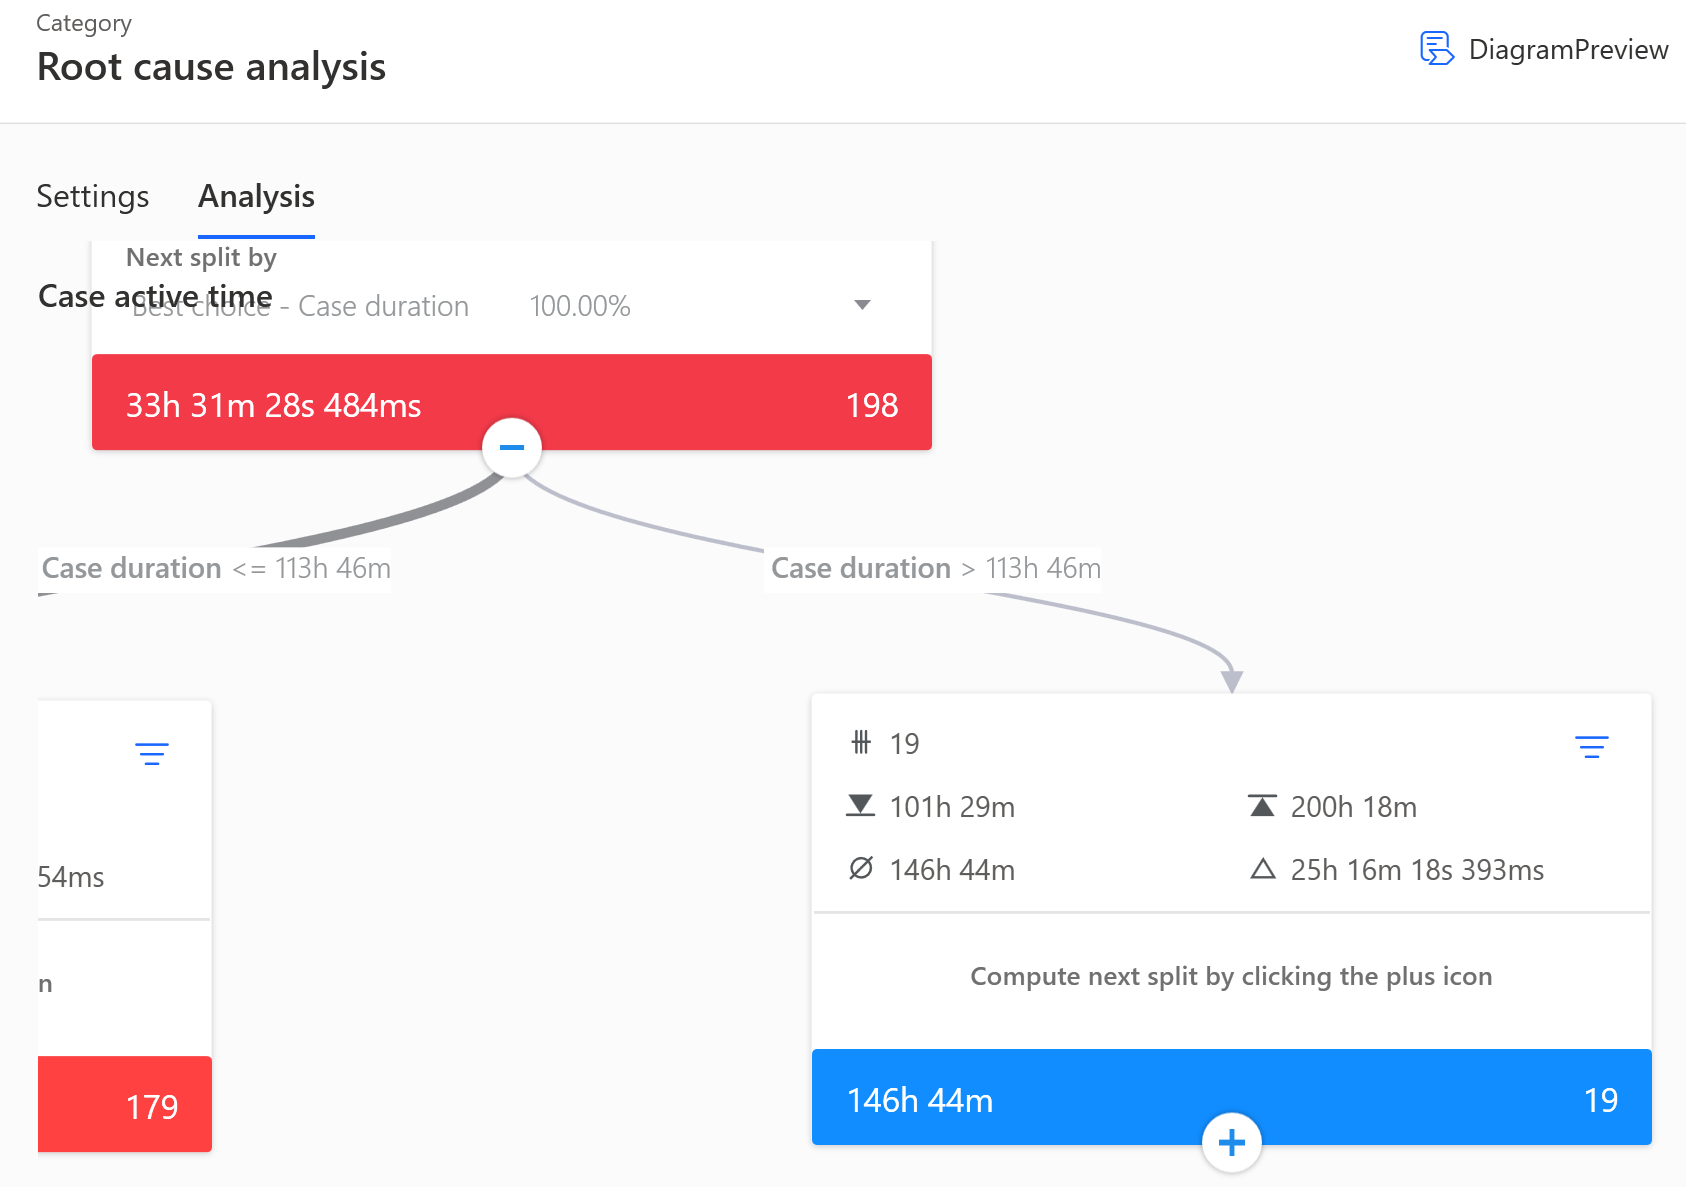
Choose another split
If the split that is chosen as the best one by the algorithm is on an attribute which you don't want to use at that point, you can choose another split from the list. In the list, there is a best split for each selected attribute in the analysis.
To open the available splits you can choose from, select the down arrow in the node heading.
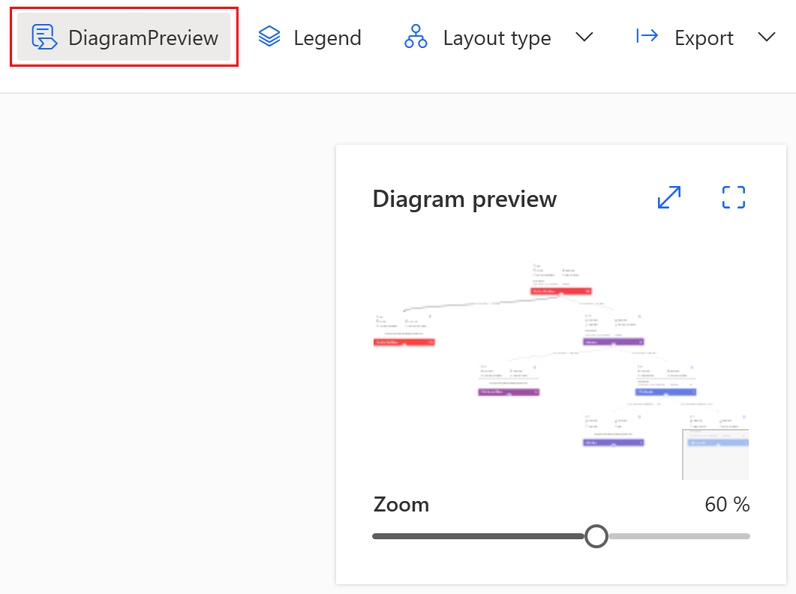
Change the view size
If the tree is too large and can't be navigated easily, you can open the Diagram preview to navigate around the tree. You can also change the layout as you wish.
Note
When you find the correct part of dataset that you need to explore further, you can convert the rules that lead up to that node into a set of filters.
If you do this, the original analysis becomes view only, as the underlying data has changed (filters applied).
Use categorical main metric
If you want to explore why some cases have gone one way or another, it's easy to analyze this with RCA using a custom metric returning string values.
For example, if you want to analyze why some cases end in some activities and others in different ones, you can use the formula LAST(CaseEvents, Activity) as your custom metric.
For other use cases, you might want to explore why cases that went through an activity X are then going to one of direct descendants of activity X. For this, you can use custom metric FIRSTIF(CaseEvents, Activity == "Process start", NEXT(Activity)). This metric returns the name of the activity after activity "Process start". If a case goes through this activity multiple times, it will only take into account the first pass. If you want the last one, you can use LASTIF instead of FIRSTIF.
The same can be achieved with FIRSTIF(CaseEvents, Activity == "Check order numbers", MOVE(1, Activity)), where you can specify the number of events that it has to move down the case.
For other similar use cases, you can use custom metrics to get event attributes on a case level so it can be used in RCA. To do this, get the value of an event attribute Y at an activity X. This is done by using custom metric FIRSTIF(CaseEvents, Activity== "X", Y).
All of these metrics, can be also used in Influenced by.
To learn more about custom metrics, go to List of other operations.