Note
Access to this page requires authorization. You can try signing in or changing directories.
Access to this page requires authorization. You can try changing directories.
Root cause analysis (RCA) allows you to find hidden connections in your data. For example, it helps you understand why some cases take longer to complete than others, or why some cases get stuck in reworks while others run smoothly. RCA will show you the key differences between such cases.
Required data
RCA can use all your case level attributes, metrics and custom metrics to find connections among them, and a metric of your choosing.
The best sample is to include all data you can as a case level attribute and let RCA do the choosing of which attribute actually influences the metric and which doesn't.
How RCA works
The RCA algorithm will compute a tree structure where each node will split the dataset into two smaller parts. This is based on one variable where it finds the best correlation between the variable split and the target metric. From this, you can see the hidden connections in the data. This is where it will tell you which combination of attributes will influence the case in which way.
How RCA finds the best split
First, we generate hundreds to thousands of combinations of possible splits. Then we try each split to discover how well will it actually split the dataset into two parts. We calculate the variance of the main metric in each part of the split and calculate the score for each split with the following calculation:
scoresplit_x = varianceleft * number of casesleft + varianceright * number of casesright
Then, we sort all splits by this score and the best splits are taken from the beginning, with the lowest score. For the categorical main metric (string), we calculate Gini impurity instead of variance.
RCA example
In this example, we want to see the root cause behind the case duration. In the data, we have case level attributes supplier country, supplier city, material, total amount, and cost center. The average case duration is 46 hours.
By looking at each value of each attribute separately, we can see that the highest influencer of case duration is when supplier city is Graz, which on average increases the duration of the case by additional 15 hours. From this initial analysis, we can see that the other values of attributes influence the target metric far less. However, when we compute the tree model, we can see that the computation above is misleading (as in the following screenshot).
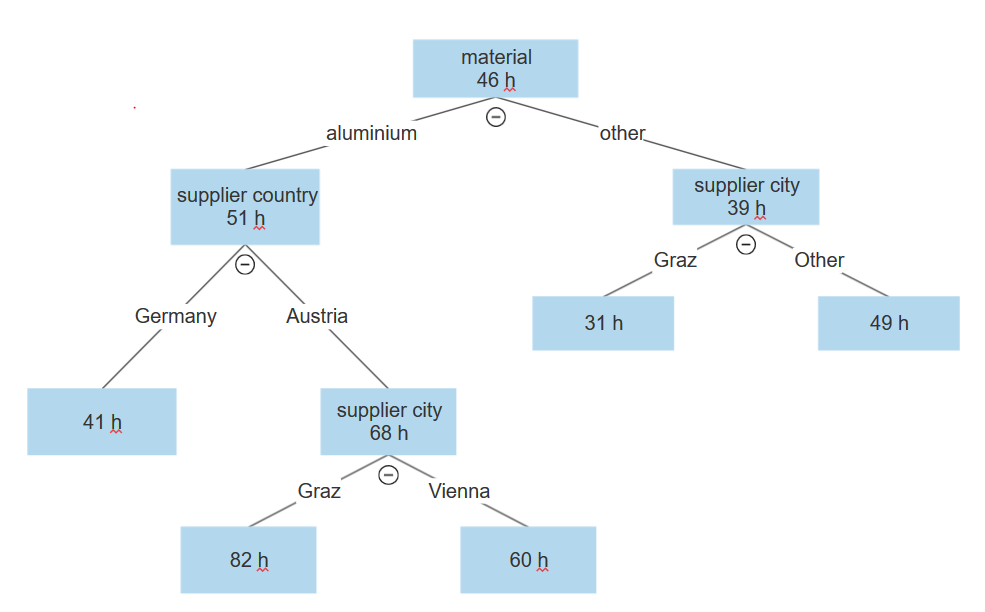
The tree structure looks like this:
The first split is the data along the material variable. The data with aluminium is on one side and all other materials is on the other side.
The aluminium branch is split further by supplier country into Germany and Austria.
The Austria branch continues with a split by supplier city, with Graz on one side and Vienna on the other.
In the node Graz, the average case was 36 hours slower than the overall average duration of 46 hours.
In the same tree, we can see that if we have another material than aluminium, it also splits by the variable supplier city, where on one side is Graz and on the other is Vienna, Munich or Frankfurt. But here, the values are the opposite. Graz has much better statistics than Vienna or any German city, with average case in Graz being 15 hours faster than the overall average for all cases.
From this, we can see that the initial statistics are misleading because Graz is performing poorly when the material is aluminium, It is, however, performing above average when the material is other than aluminium and is completely opposite for other cities.
Case Duration Influence statistics takes into account only one value and sometimes can be misleading. RCA takes into account combinations of them to give you more insights into your process.