Use Python in Power Query Editor
You can use Python, a programming language widely used by statisticians, data scientists, and data analysts, in the Power BI Desktop Power Query Editor. This integration of Python into Power Query Editor lets you perform data cleansing using Python, and perform advanced data shaping and analytics in datasets, including completion of missing data, predictions, and clustering, just to name a few. Python is a powerful language, and can be used in Power Query Editor to prepare your data model and create reports.
Prerequisites
You'll need to install Python and pandas before you begin.
Install Python - To use Python in Power BI Desktop's Power Query Editor, you need to install Python on your local machine. You can download and install Python for free from many locations, including the Official Python download page, and the Anaconda.
Install pandas - To use Python with the Power Query Editor, you'll also need to install pandas. Pandas is used to move data between Power BI and the Python environment.
Use Python with Power Query Editor
To show how to use Python in Power Query Editor, take this example from a stock market dataset, based on a CSV file that you can download from here and follow along. The steps for this example are the following procedure:
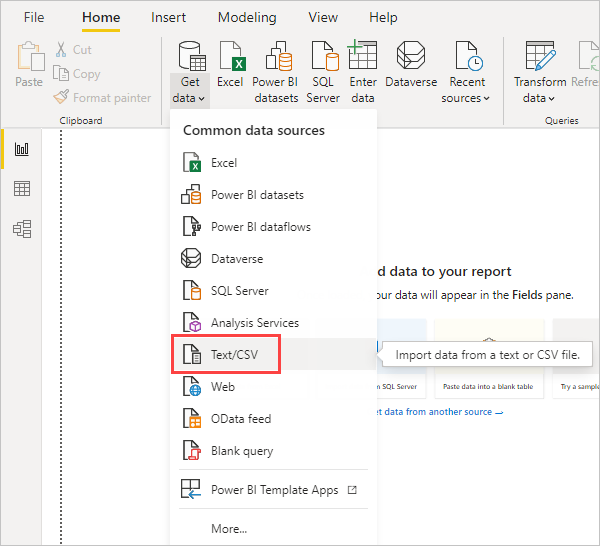
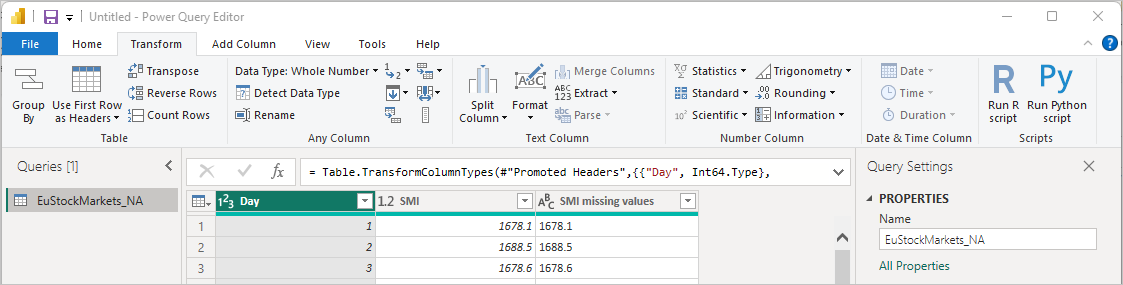
First, load your data into Power BI Desktop. In this example, load the EuStockMarkets_NA.csv file and select Get data > Text/CSV from the Home ribbon in Power BI Desktop.
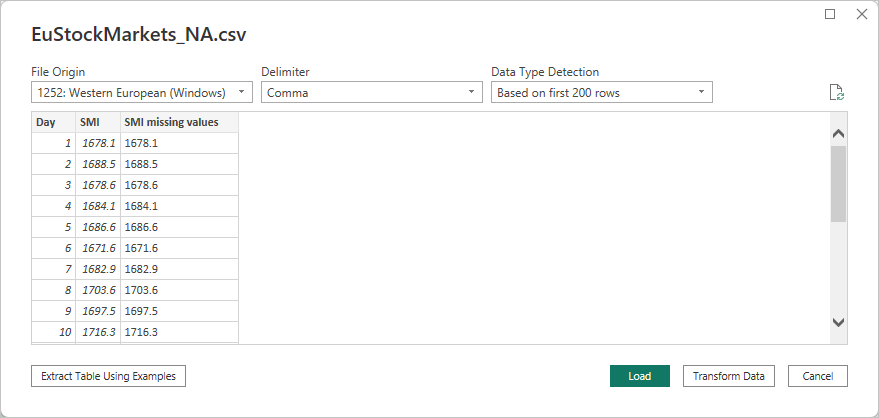
Select the file and select Open, and the CSV is displayed in the CSV file dialog.
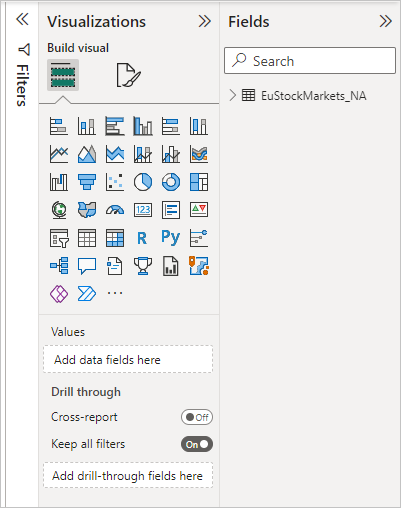
Once the data is loaded, you see it in the Fields pane in Power BI Desktop.
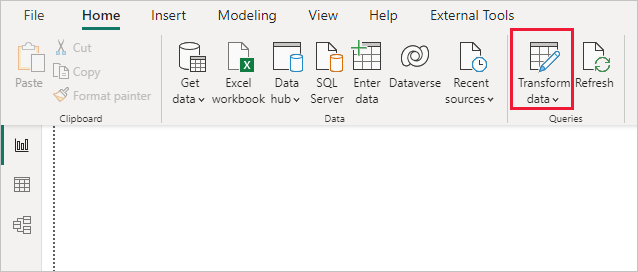
Open Power Query Editor by selecting Transform data from the Home tab in Power BI Desktop.
In the Transform tab, select Run Python Script and the Run Python Script editor appears as shown in the next step. Rows 15 and 20 suffer from missing data, as do other rows you can't see in the following image. The following steps show how Python completes those rows for you.
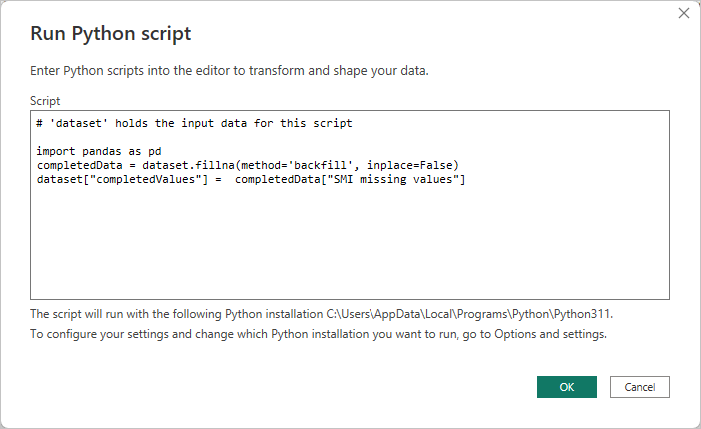
For this example, enter the following script code:
import pandas as pd
completedData = dataset.fillna(method='backfill', inplace=False)
dataset["completedValues"] =  completedData["SMI missing values"]
Note
You need to have the pandas library installed in your Python environment for the previous script code to work properly. To install pandas, run the following command in your Python installation:
pip install pandasWhen put into the Run Python Script dialog, the code looks like the following example:
After you select OK, Power Query Editor displays a warning about data privacy.
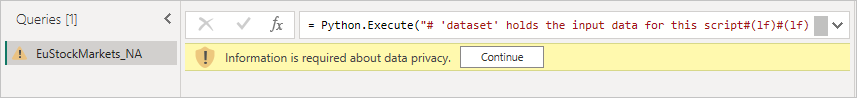
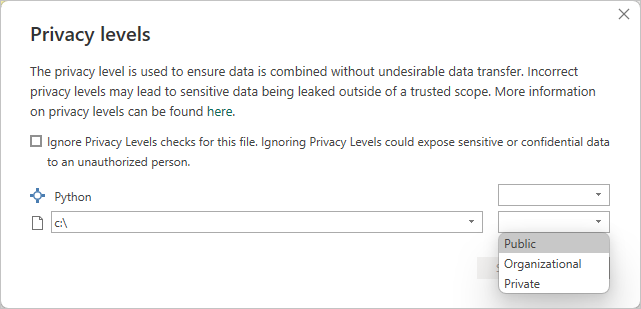
For the Python scripts to work properly in the Power BI service, all data sources need to be set to public. For more information about privacy settings and their implications, see Privacy Levels.
Notice a new column in the Fields pane called completedValues. Notice there are a few missing data elements, such as on row 15 and 18. Take a look at how Python handles that in the next section.
With just three lines of Python script, Power Query Editor filled in the missing values with a predictive model.
Create visuals from Python script data
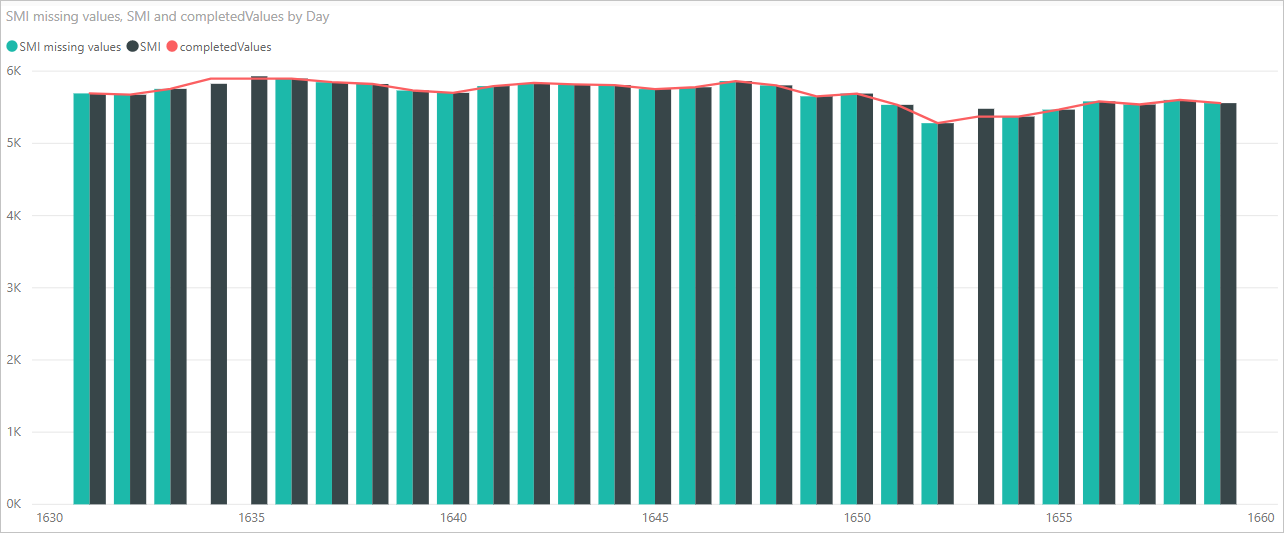
Now we can create a visual to see how the Python script code using the pandas library completed the missing values, as shown in the following image:
Once that visual is complete, and any other visuals you might want to create using Power BI Desktop, you can save the Power BI Desktop file. Power BI Desktop files save with the .pbix file name extension. Then use the data model, including the Python scripts that are part of it, in the Power BI service.
Note
Want to see a completed .pbix file with these steps completed? You're in luck. You can download the completed Power BI Desktop file used in these examples right here.
Once you upload the .pbix file to the Power BI service, a couple more steps are necessary to enable data to refresh in the service and to enable visuals to be updated in the service. The data needs access to Python for visuals to be updated. The other steps are the following steps:
- Enable scheduled refresh for the dataset. To enable scheduled refresh for the workbook that contains your dataset with Python scripts, see Configuring scheduled refresh, which also includes information about Personal Gateway.
- Install the Personal Gateway. You need a Personal Gateway installed on the machine where the file is located, and where Python is installed. The Power BI service must access that workbook and re-render any updated visuals. For more information, see install and configure Personal Gateway.
Considerations and limitations
There are some limitations to queries that include Python scripts created in Power Query Editor:
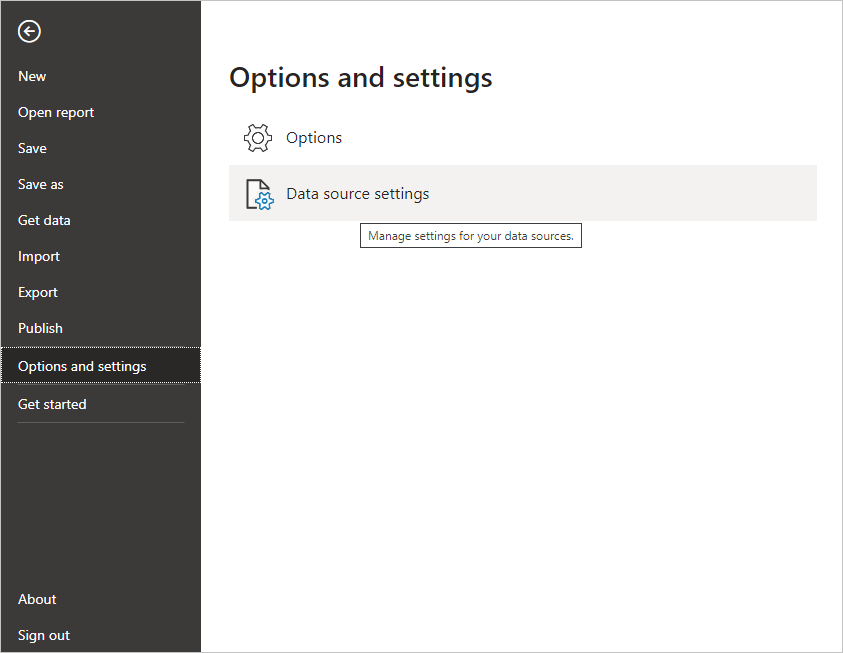
All Python data source settings must be set to Public, and all other steps in a query created in Power Query Editor must also be public. To get to data source settings, in Power BI Desktop select File > Options and settings > Data source settings.
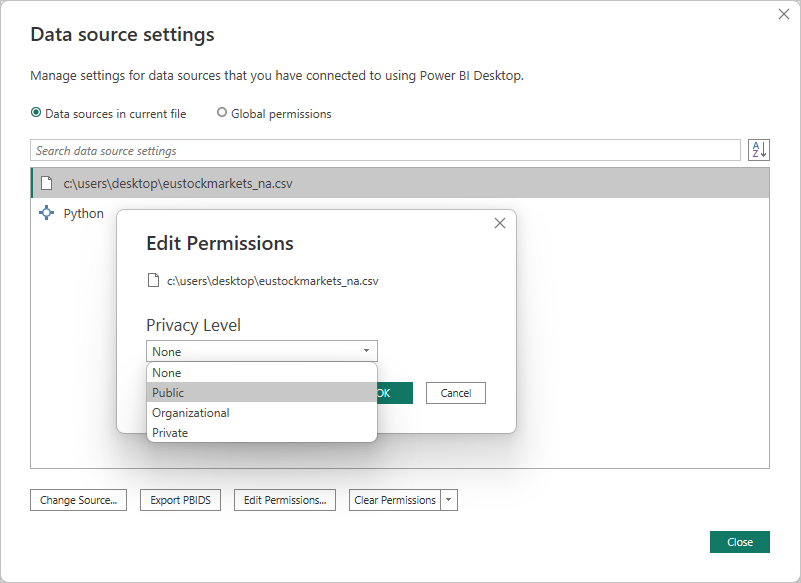
From the Data Source Settings dialog, select the data sources and then select Edit Permissions... and ensure that the Privacy Level is set to Public.
To enable scheduled refresh of your Python visuals or dataset, you need to enable Scheduled refresh and have a Personal Gateway installed on the computer that houses the workbook and the Python installation. For more information on both, see the previous section in this article, which provides links to learn more about each.
Nested tables, which are table of tables, are currently not supported.
There are all sorts of things you can do with Python and custom queries, so explore and shape your data just the way you want it to appear.