Note
Access to this page requires authorization. You can try signing in or changing directories.
Access to this page requires authorization. You can try changing directories.
The R language is a powerful programming language that many statisticians, data scientists, and data analysts use. You can use R in Power BI Desktop's Power Query Editor to:
- Prepare data models.
- Create reports.
- Do data cleansing, advanced data shaping, and semantic model analytics, which include missing data completion, predictions, clustering, and more.
Install R
You can download R for free from the CRAN Repository.
Install mice
As a prerequisite, you must install the mice library in your R environment. Without mice, the sample script code doesn't work properly. The mice package implements a method to deal with missing data.
To install the mice library:
Launch the
R.exeprogram, for example,C:\Program Files\Microsoft\R Open\R-3.5.3\bin\R.exe.Run the install command from the R prompt:
install.packages('mice')
Use an R script in Power Query Editor
To demonstrate using R in Power Query Editor, this example uses a stock market semantic model contained in a .csv file.
Download the EuStockMarkets_NA.csv file. Remember where you save it.
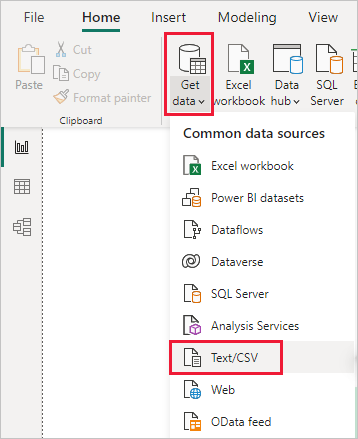
Load the file into Power BI Desktop. From the Home tab, select Get data > Text/CSV.
Select the EuStockMarkets_NA.csv file, and then choose Open. The CSV data is displayed in the Text/CSV file dialog.
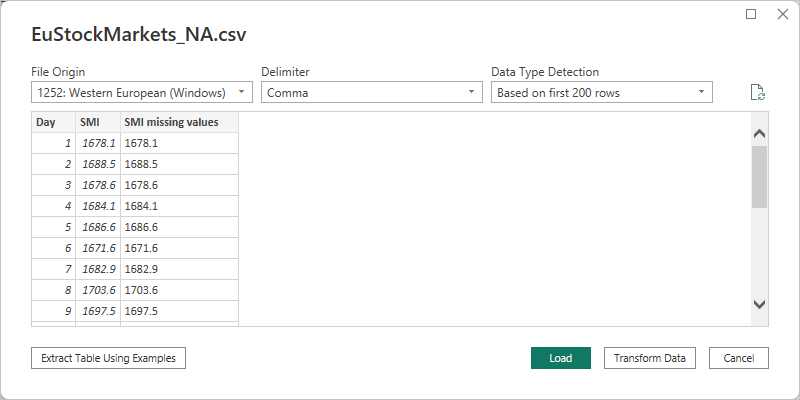
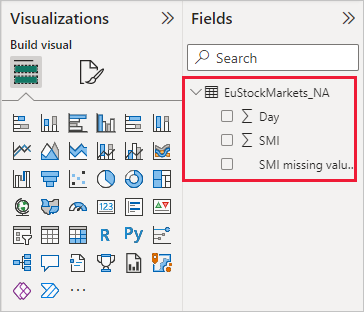
Select Load to load the data from the file. After Power BI Desktop loads the data, the new table appears in the Fields pane.
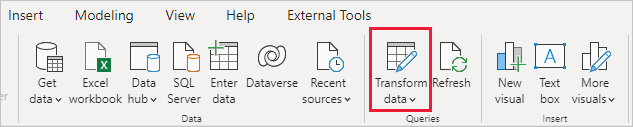
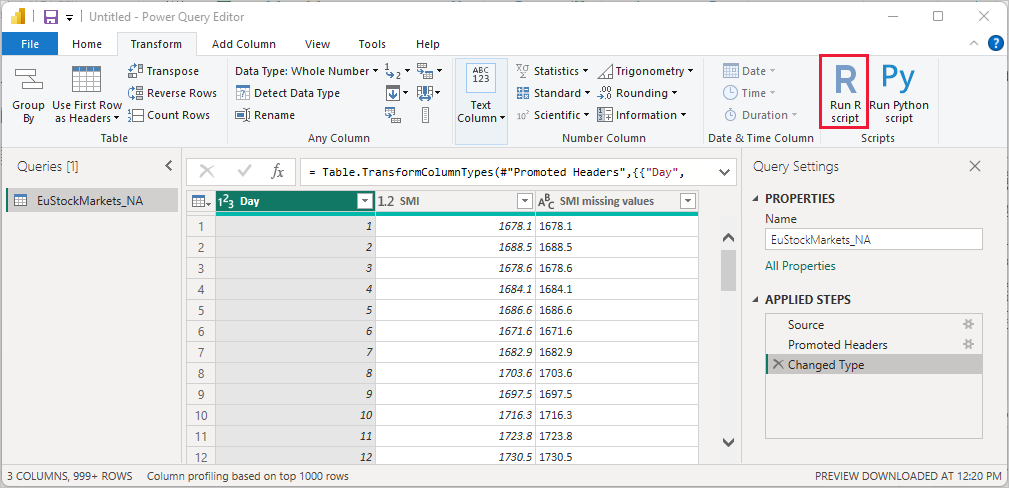
To open Power Query Editor, from the Home ribbon select Transform data.
From the Transform tab, select Run R script. The Run R script editor appears. Rows 15 and 20 have missing data, as do other rows you can't see in the image. The following steps show how R completes those rows for you.
For this example, enter the following script code in the Script box of the Run R script window.
   library(mice)
   tempData <- mice(dataset,m=1,maxit=50,meth='pmm',seed=100)
   completedData <- complete(tempData,1)
   output <- dataset
   output$completedValues <- completedData$"SMI missing values"
Note
You might need to overwrite a variable named output to properly create the new semantic model with the filters applied.
Select OK. Power Query Editor displays a warning about data privacy.
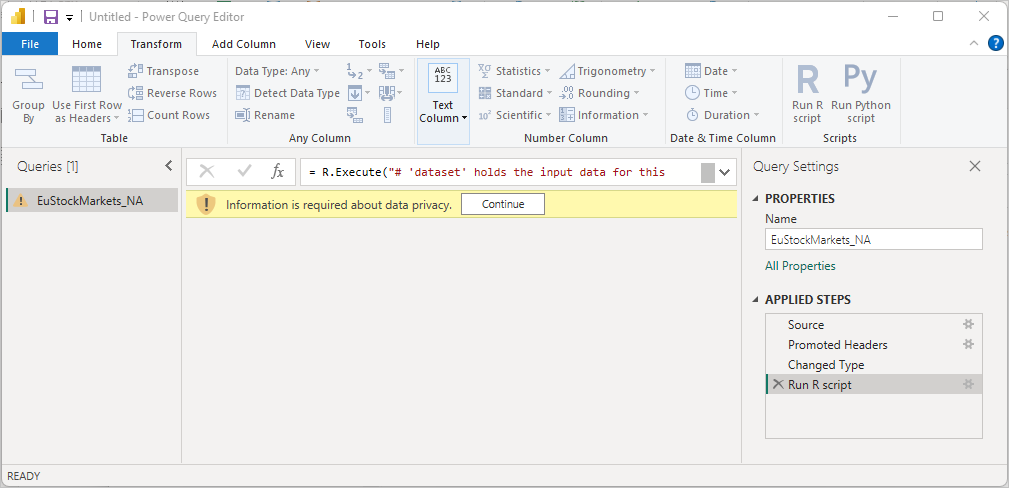
Inside the warning message, select Continue. In the Privacy levels dialog that appears, set all data sources to Public for the R scripts to work properly in the Power BI service.
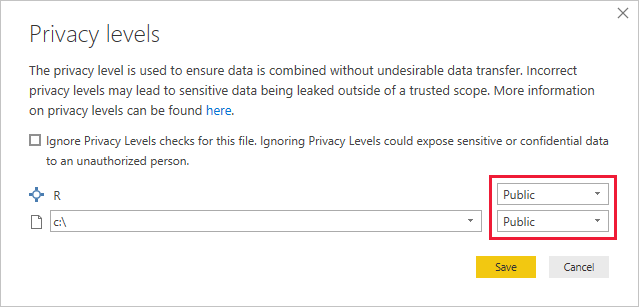
For more information about privacy settings and their implications, see Power BI Desktop privacy levels.
Select Save to run the script.
When you run the script, you see the following result:
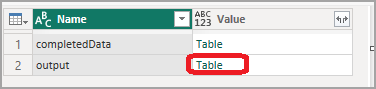
When you select Table next to Output in the table that appears, the table is presented, as shown in the following image.
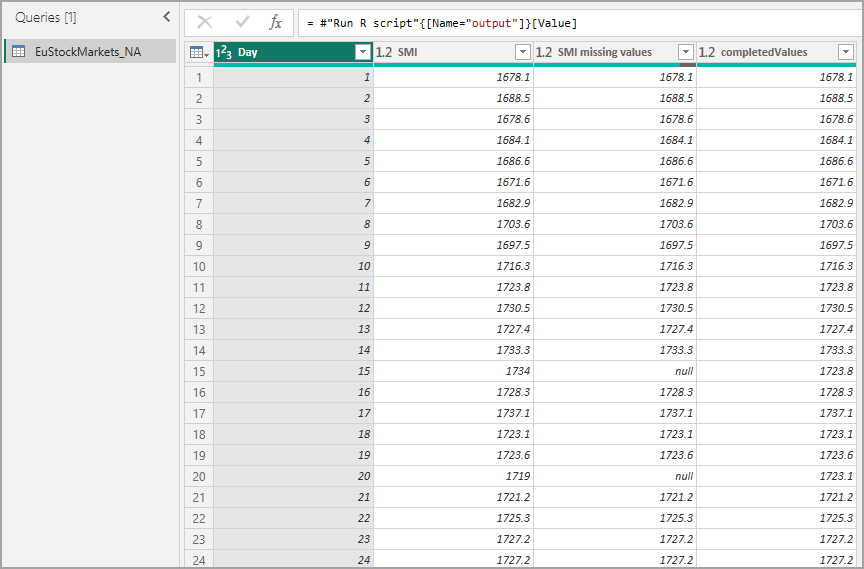
Notice the new column in the Fields pane called completedValues. The SMI missing values column has a few missing data elements. Take a look at how R handles that in the next section.
With just five lines of R script, Power Query Editor filled in the missing values with a predictive model.


Create visuals from R script data
We can now create a visual to see how the R script code with the mice library completes the missing values.

You can save all completed visuals in one Power BI Desktop .pbix file and use the data model and its R scripts in the Power BI service.
Note
You can download a .pbix file with all these steps completed.
After you upload the .pbix file to the Power BI service, you need to take other steps to enable service data refresh and updated visuals:
Enable scheduled refresh for the semantic model: To enable scheduled refresh for the workbook containing your semantic model with R scripts, see Configuring scheduled refresh. This article also includes information about on-premises data gateways.
Install a gateway: You need an on-premises data gateway (personal mode) installed on the machine where the file and R are located. The Power BI service accesses that workbook and re-renders any updated visuals. For more information, see use personal gateways in Power BI.
Considerations and limitations
There are some limitations to queries that include R scripts created in Power Query Editor:
All R data source settings must be set to Public. All other steps in a Power Query Editor query must also be public.
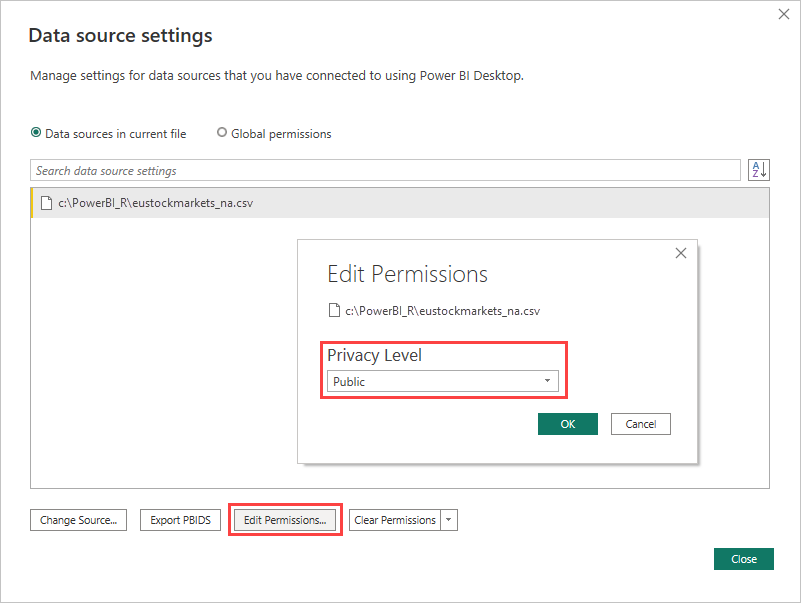
To get to the data source settings, in Power BI Desktop, select File > Options and settings > Data source settings.
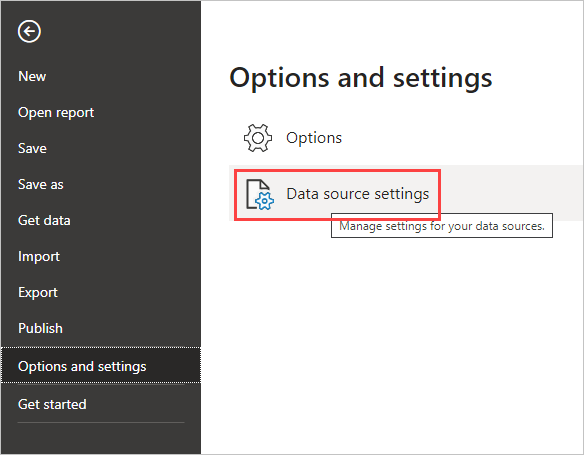
In the Data source settings dialog, select one or more data sources, and then select Edit Permissions. Set the Privacy Level to Public.
To schedule refresh of your R visuals or semantic model, enable scheduled refresh and install an on-premises data gateway (personal mode) on the computer containing the workbook and R. You can't use an enterprise gateway to refresh semantic models containing R scripts in Power Query.

Related content
There are all sorts of things you can do with R and custom queries. Explore and shape your data just the way you want it to appear.