Note
Access to this page requires authorization. You can try signing in or changing directories.
Access to this page requires authorization. You can try changing directories.
This article describes different ways a business user can consume ArcGIS Maps in the Power BI service. ArcGIS Maps in Power BI is also available on Power BI Desktop and mobile. Once a creator shares an ArcGIS map with you, there are many ways to interact with that map. For more information, see Create ArcGIS maps in Power BI.
ArcGIS for Power BI is a map visualization used to enrich data, reports, and dashboards. ArcGIS for Power BI adds geographic, location, and regional demographic data, smart map themes, and analytic features such as drive time, infographics, and points of interest. Combining authoritative data layers on an ArcGIS for Power BI map with spatial analysis provides more complex insight onto your Power BI data.
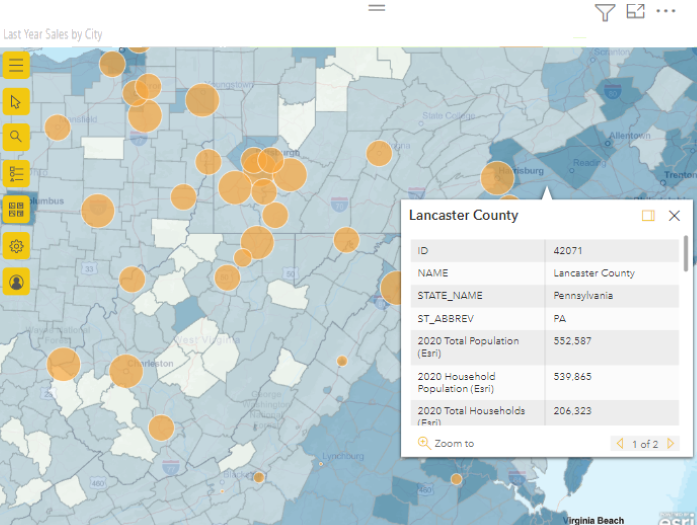
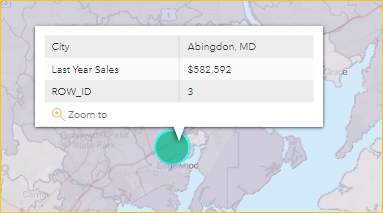
For example, you can use ArcGIS for Power BI to provide regional insight into sales figures. The following ArcGIS map shows regional sales by size against a demographic layer of the 2020 Esri Diversity Index. An interactive tooltip for Lancaster County shows total population, household population, and total households for the selected area.
Tip
To learn more, explore Esri's Get Started page for the ArcGIS for Power BI visual, or visit Esri's Marketing site to see examples and read testimonials. For training and documentation, see Esri's online help.
User consent
Here are some things you should know if this is your first time using ArcGIS for Power BI. ArcGIS Maps for Power BI is provided by Esri. Your use of ArcGIS Maps for Power BI is subject to Esri's terms and privacy policy. Power BI users wanting to use the ArcGIS Maps for Power BI visuals need to accept the consent dialog.
Interact with an ArcGIS map
The features available depend on whether you're the report designer (person who made the map) or a business user (someone shared an ArcGIS map with you). If you're interacting with an ArcGIS map as a business user, you're more likely to use Reading view to consume ArcGIS Maps in the Power BI serve. Here are the actions available to you:
| Action | Premium customer (with view permissions) | Power BI Pro customer |
|---|---|---|
| View the data used to create the visual | Y | Y |
| Subscribe for reports and dashboards | Y | Y |
| See the map in focus mode and full screen mode | Y | Y |
| View related content | Y | Y |
| Interact with the filters set by the report designer | Y | Y |
| Share the report | Y | Y |
| Export the underlying data | N | Y |
| Get usage metrics | N | Y |
| Publish to the web | N | Y |
| Save a copy | N | Y |
Display the Map tools
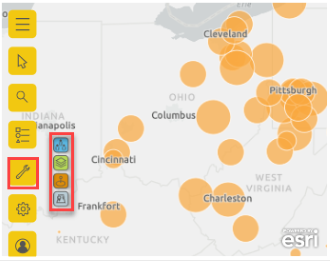
When you first open an ArcGIS for Power BI map visualization in Reading view, the Map tools button is typically collapsed.
Select the map tools button  to expand the tools.
The map tools expand to show the available options. When selected, each tool opens a task pane that provides detailed options.
Tip
Esri provides comprehensive documentation about using ArcGIS for Power BI.
Select locations
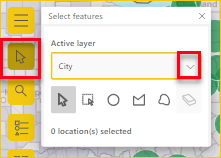
There are multiple ways to select locations on the map. The options available depend on the type of layer selected. If the map contains more than one layer, the selection tool will apply the action to the active layer. A maximum of 250 data points can be selected at a time. For more information, see Select locations on the map.
 Single select. This is the default tool. You can select individual data points and individual features.
 Select by rectangle. With this tool, you can draw a rectangle on the map and select the contained data points and features. Use CTRL to add or remove selections.
 Select by circle. With this tool, you can draw a circular shape on the map and select the contained data points and features. Use CTRL to add or remove selections.
 Select by polygon. With this tool, you can draw boundaries or polygons within reference layers to select contained data points and features. Double-click your mouse to complete a selection. Use CTRL to enable snapping.
 Select by freehand polygon. With this tool, you can draw a freehand shape on the map and select the contained data points and features. Use CTRL to add or remove selections.
 Select by reference layer. This tool is only visible if there's a reference layer on the map and that reference layer is the active layer. Select features on the reference layer to highlight them. For more information, see Work with map layers—ArcGIS for Power BI.
 Drive time select This tool is only visible if there's a search area layer (buffer or drive time area) on the map and the search area layer is the active layer. Draw to select data points and features within the defined area. For more information, see Find Nearby Locations.
![]() The eraser tool. This tool clears all selections. It's only active after selections have been made on the map.
The eraser tool. This tool clears all selections. It's only active after selections have been made on the map.
Pin a location
Pin a specific address, place, or point of interest on the map. In this example, we're looking for the Washington Monument.
- Expand the map tools
and select the Search button
 to open the search pane.
 - Type the keywords Washington Monument in the search field. Keywords can include an address, place, or point of interest. As you type, recent searches or suggestions based on similar keywords appear.
- From the results list, choose Washington Monument, 2 15th St NW, Washington DC 20024 USA and select Close. A symbol appears on the map, and the map automatically zooms to the location, pinning it during your session. Pins remain in place on the map only during the current session. You can't save a pinned location with the map. For more information, see Pin a location—ArcGIS for Power BI.
View, show, or hide layers
As a business user, you can show or hide a layer, change the sequence in which a layer is shown, and zoom to a layer’s data boundaries. To view your map’s layers, follow these steps:
Expand the map tools
and select the Layers button  to open the Layers pane.
To hide a layer, select the Hide button.
To show a hidden layer, select the Show button
 .
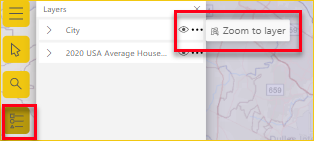
.To change the sequence in which a layer is shown on the map, for example, to display a Demographic reference layer on top of the data layer, drag the reference layer to the top of the list of layers in the Layers pane.
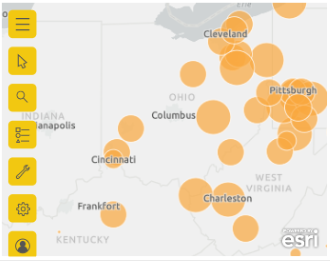
To zoom to the extent of the layer’s data boundaries, select More options (...) and select Zoom to layer.
You can also use the Filters pane to filter layer content on your ArcGIS for Power BI map based on the available data added by the report designer.
Note
If you find that you can't perform these tasks, it may be that the report designer has disabled these features. Contact the report designer if you have questions.
For more information about working with layers, visit Work with map layers—ArcGIS for Power BI.
Filter map layers
The Filters pane contains data added by the report designer. There are many different ways to filter your map content.
Expand the Filters pane to the right of the map visualization.
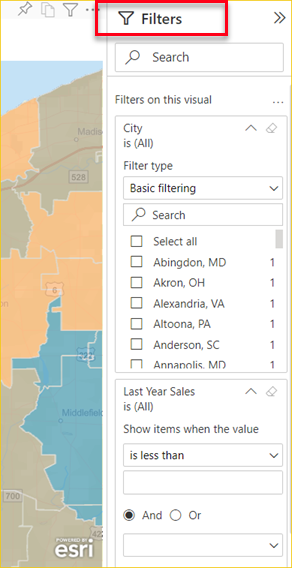
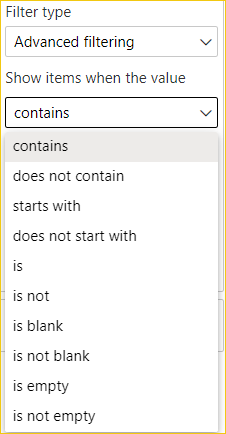
Select fields to filter the map. Use Basic filtering, to choose from data shown on the map. Use Advanced filtering to narrow content by specific parameters.
Some filters have value parameters (Boolean) available.
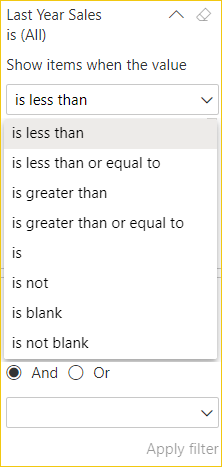
When you've selected your filter options, select Apply filter. The map is filtered by your selections.
Change the basemap
A basemap provides a background, or visual context, for the data in a map. For example, a basemap that shows streets can provide context for address data. As a Power BI business user, there are four basemaps provided: Dark Gray Canvas, Light Gray Canvas, OpenStreetMap, and Streets.
Note
For access to basemaps, the report designer must make them available when designing the report. If the basemaps are unavailable, you will not see the Basemap button in the Map tools.
To change the basemap, follow these steps:
Expand the map tools
and select the Basemap button  to display the gallery of available basemaps.
Select the Dark Gray Canvas basemap.
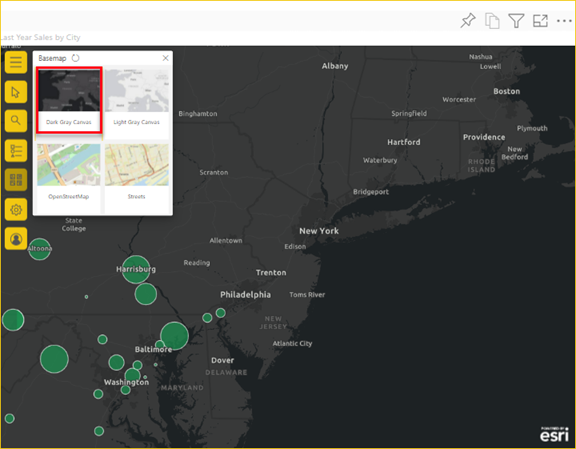
The map updates to the new basemap. For more information, see Change the basemap—ArcGIS for Power BI.
Select Analysis tools
This tool option appears only if the report designer includes data to perform a Find Similar analysis. For more information on the features of the Analysis tools, see Create ArcGIS in Power BI.
 Infographics. With this tool, you can provide interactive cards with specific details about the areas on the map.
 Reference Layer. With this tool, you can add a demographic layer to help contextualize your data from Power BI or add a reference layer from ArcGIS to enrich your data.
 Buffer/Drive time. With this tool, you can find locations on your map within a specific distance, or ring buffer, of the point of origin.
 Find similar. With this tool, you can quickly identify locations with attributes comparable to those locations currently selected on the map.
Get help
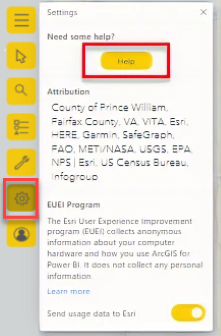
Esri provides comprehensive online documentation for ArcGIS for Power BI. To access the ArcGIS for Power BI online help from the visualization, follow these steps:
Expand the map tools
and select the Settings button  .
.In the Settings pane, select the Help button.
Select OK in the confirmation window that appears. The ArcGIS for Power BI online help opens in a browser window. Then you can:
- Find answers to frequently asked questions about ArcGIS for Power BI.
- Report issues, find the latest information, ask questions, and find answers on the Power BI community thread related to ArcGIS for Power BI.
- Suggest improvements by submitting it to the Power BI Ideas list.
On the Settings pane, you can also view attribution for your map, read about the Esri EUEI (End User Experience) program, and turn Send usage data to Esri on or off.
Use tooltips
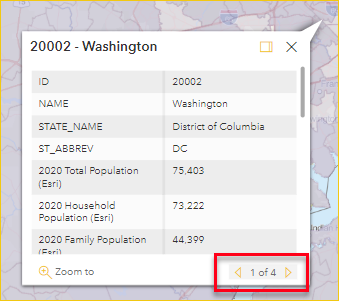
If the map has a reference layer and the report designer has added tooltips, you can select a location to display its details. The following example shows a tooltip for the Cleveland, Ohio, 2020 Total Population broken down by five-year age increments.
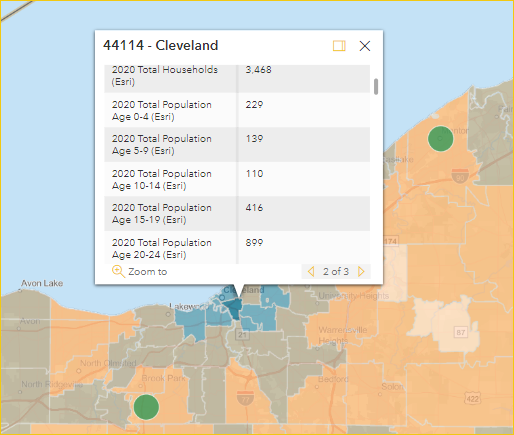
Hover your pointer over basemap location symbols to display symbol details in a tooltip.
Tip
You might have to zoom in to select a specific location. If there are overlapping locations, Power BI will present you with more than one tooltip at a time. Select the arrows to move between the tooltips.
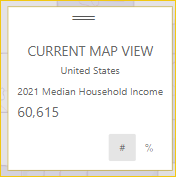
Use infographics
If the report designer adds an Infographics layer to the ArcGIS map, you'll see additional data displayed in the upper right corner of the map. Here's an example where the report designer added the 2021 Median Household Income.
Considerations and Limitations
ArcGIS Maps for Power BI is available in the following services and applications:
| Service/Application | Availability |
|---|---|
| Power BI Desktop | Yes |
| Power BI service (app.powerbi.com) | Yes |
| Power BI mobile applications* | Yes |
| Power BI publish to web | Yes, for designers signed in to a valid licensed ArcGIS account. |
| Power BI Embedded | Yes, for designers signed in to a valid licensed ArcGIS account. |
| Power BI service embedding (powerbi.com) | No |
| Power BI Report Server | Yes, when signed into a valid ArcGIS Enterprise account through Report Server (online environment only). Not supported in a disconnected environment or with ArcGIS Online. Accessing Report Server with ArcGIS for Power BI consumes ArcGIS credits. For more information about credits, see Understand credits |
*In mobile environments, you can view maps created using the ArcGIS for Power BI visualization included with Power BI (Standard account). Maps that contain premium content from ArcGIS aren't supported in mobile environments.
In services or applications for which ArcGIS for Power BI isn't available, ArcGIS visualizations will show as an empty visual with the Power BI logo.
How do ArcGIS Maps for Power BI work together?
ArcGIS Maps for Power BI is provided by Esri. When you provide your consent, any data you use that is connected to the map visualization is sent to Esri’s services for geocoding. This means that location information is transformed into latitude and longitude coordinates that can be represented on a map. Through ArcGIS for Power BI, Esri provides services to enrich your data. These include basemaps, spatial analytics, location services, demographic data, and other authoritative data layers. ArcGIS for Power BI interacts with Power BI using an SSL connection protected by a certificate provided and maintained by Esri. For more information about ArcGIS Maps for Power BI, see Esri's ArcGIS Map for Power BI product page.
What is an ArcGIS account?
Esri offers an Esri ArcGIS account through ArcGIS for Power BI. Adding an ArcGIS account to Power BI can greatly enhance your mapping visualization capabilities by adding an extensive library of data reference layers and geo enrichment.
Power BI doesn't send personal information about you to Esri. This is a separate relationship with a third-party vendor. Once you add ArcGIS account content to your ArcGIS for Power BI visualization, you'll have access to all the Esri content and data associated with your account, role, and organization. Any other Power BI user with whom you share that data‐whether within your organization or the public‐might also need an ArcGIS account to view shared, potentially licensed content. For details about account types and data limitations, see ArcGIS for Power BI online help.
For technical or detailed questions about ArcGIS for Power BI, see ArcGIS for Power BI get started or reach out to Esri Technical Support.
The following table compares the standard features available to all Power BI users to those features available to users signed in to a valid, licensed ArcGIS account.
| Feature | Standard, included with Power BI | Requires ArcGIS account |
|---|---|---|
| Basemaps | Four basic basemaps | All Esri basemaps, access to your organization's basemaps, custom basemaps. |
| Geocoding | 3,500 locations per map, 10,000 locations per month | 10,000 locations per map, no monthly limit |
| Reference layers | 10 curated reference layers that contain U.S. demographic data and publicly shared feature layers in ArcGIS | Access to all global web maps and layers as defined by your ArcGIS organization or account. This includes access to ArcGIS Living Atlas of the World maps and layers (feature services) and publicly shared feature layers in ArcGIS. |
| Infographics | A curated gallery of U.S. demographic data variables, a maximum of two variables, support for drive time and radius settings | Access to all global demographic data variables as defined by your ArcGIS organization or account. This includes access to the ArcGIS GeoEnrichment data browser, a maximum of five variables, and support for all distance and travel settings. |
The ArcGIS map is not showing up
In services or applications where ArcGIS Maps for Power BI isn't available, the visualization will show as an empty visual with the Power BI logo.
I'm not seeing all of my information on the map
When geocoding latitude and longitude on the map, up to 30,000 data points are displayed. When geocoding data points such as zip codes or street addresses, only the first 15,000 data points are geocoded. Geocoding place names or countries/regions aren't subject to the 15,000 address limit.
Is there any charge for using ArcGIS Map for Power BI?
ArcGIS Maps for Power BI is available to all Power BI users at no extra cost. It's a component provided by Esri, and your use is subject to the terms and privacy policy provided by Esri, as noted earlier in this article. If you sign up for an Esri ArcGIS account, there are costs associated.
I'm getting an error message about my cache being full
This is a bug that is being addressed. In the meantime, select the link in the error message for instructions on clearing your Power BI cache.
Can I view my ArcGIS maps offline?
No, Power BI needs network connectivity to display the maps.