Note
Access to this page requires authorization. You can try signing in or changing directories.
Access to this page requires authorization. You can try changing directories.
APPLIES TO: ![]() Power BI Desktop
Power BI Desktop ![]() Power BI service
Power BI service
By using dynamic format strings for measures, you can control how measures appear in visuals. Conditionally apply a format string by using a separate Data Analysis Expression (DAX) formula.
Note
Dynamic format strings for measures is available in Power BI Desktop and Power BI Report Server (January 2025 and later). If you're using Power BI Report Server, make sure you have the latest version installed. For more information, see What's new in Power BI Report Server.
Dynamic format strings solve a problem with the FORMAT function. FORMAT returns all results as strings, even numeric data types. This behavior can cause problems with visuals like charts that need numeric values.
When you use dynamic format strings, the measure keeps its data type and doesn't change to a string data type. You apply different format strings to the measure depending on the context.
You can also use dynamic format strings with calculation groups. The same DAX patterns that work with calculation groups also work in dynamic format strings for measures. However, the scope is limited to individual measures instead of all measures in the model. For more information, see Calculation groups - Dynamic format strings.
Create dynamic format strings
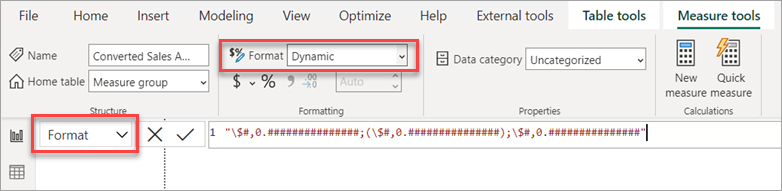
- In the Data pane, select the measure for which you want to specify a dynamic format string.
- In the Measure tools ribbon, under the Formatting section, select Dynamic in the Format listbox. A new drop-down with Format already selected appears to the left of the DAX formula bar. This drop-down is how you can switch between the static measure DAX expression and the dynamic format string DAX expression. The static format string that you used before switching to Dynamic is prepopulated as a string in the DAX formula bar.
Use the value part of a text box
When you work with text boxes in your reports, you can display measure values with dynamic formatting. To use the value part of a text box:
Select the text box in your report.
In the Format pane, under Values, select the field button (fx icon).
Choose the measure that has a dynamic format string applied.
The text box displays the measure value using the dynamic format string.
For more information about text boxes and dynamic content, see Add text boxes and shapes to Power BI reports.
Overwrite the string with a DAX expression that outputs the correct format string for your measure. For example, the following expression looks up the currency format string you want from a Country/Region Currency Format Strings table:
Verify your dynamic format string works in a visual.
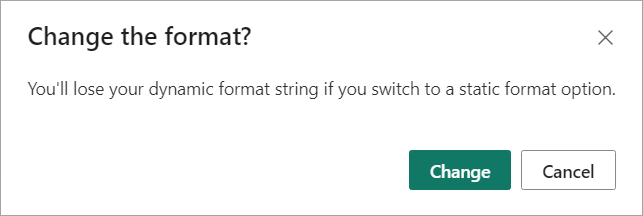
To delete the dynamic format string and return to using a static format string, in the Formatting section > Format drop-down, select a different format option. Because there's no undo to this action, a dialog appears asking if you want to proceed. If you want to go back to using a dynamic format string again, you must reenter the DAX expression.


Example
The best way to learn about a new feature is to try it yourself. You can do just that with the sample Adventure Works 2020 PBIX file available at DAX sample model. By using the sample model, you can add currency conversion to show converted sales amount by year. After downloading, open the file in Power BI Desktop.
Create new tables
The sample model doesn't contain all the data necessary to create and use dynamic format strings. To get started, you need to add two tables.
On the Home ribbon, select Enter data.
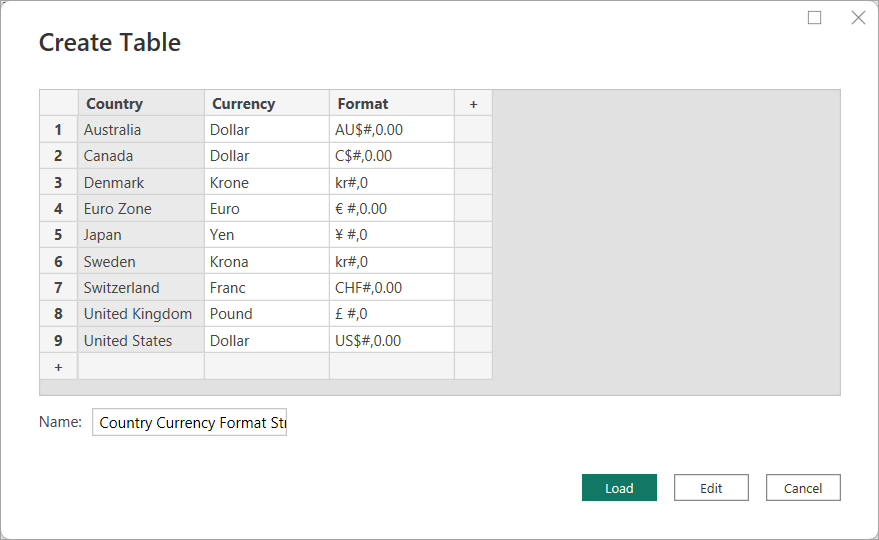
In the Create Table dialog, enter Country/Region Currency Format Strings in the Name field, then copy and paste the following table:
Country/Region Currency Format Australia Dollar AU$#,0.00 Canada Dollar C$#,0.00 Denmark Krone kr#,0 Euro Zone Euro € #,0.00 Japan Yen ¥ #,0 Sweden Krona kr#,0 Switzerland Franc CHF#,0.00 United Kingdom Pound £ #,0 United States Dollar US$#,0.00 Verify the table looks correct and select Load.
Repeat the previous steps for the following table:
Table name: Yearly Average Exchange Rates
Country/Region Currency Year Yearly Average Exchange Rate Australia Dollar 2022 1.442 Australia Dollar 2021 1.332 Australia Dollar 2020 1.452 Australia Dollar 2019 1.439 Australia Dollar 2018 1.34 Australia Dollar 2017 1.358 Canada Dollar 2022 1.301 Canada Dollar 2021 1.254 Canada Dollar 2020 1.341 Canada Dollar 2019 1.327 Canada Dollar 2018 1.297 Canada Dollar 2017 1.35 Denmark Krone 2022 7.077 Denmark Krone 2021 6.29 Denmark Krone 2020 6.538 Denmark Krone 2019 6.67 Denmark Krone 2018 6.319 Denmark Krone 2017 6.864 Euro Zone Euro 2022 0.951 Euro Zone Euro 2021 0.846 Euro Zone Euro 2020 0.877 Euro Zone Euro 2019 0.893 Euro Zone Euro 2018 0.848 Euro Zone Euro 2017 0.923 Japan Yen 2022 131.454 Japan Yen 2021 109.817 Japan Yen 2020 106.725 Japan Yen 2019 109.008 Japan Yen 2018 110.424 Japan Yen 2017 116.667 Sweden Krona 2022 10.122 Sweden Krona 2021 8.584 Sweden Krona 2020 9.205 Sweden Krona 2019 9.457 Sweden Krona 2018 8.703 Sweden Krona 2017 8.894 Switzerland Franc 2022 0.955 Switzerland Franc 2021 0.914 Switzerland Franc 2020 0.939 Switzerland Franc 2019 0.994 Switzerland Franc 2018 0.979 Switzerland Franc 2017 1.024 United Kingdom Pound 2022 0.811 United Kingdom Pound 2021 0.727 United Kingdom Pound 2020 0.779 United Kingdom Pound 2019 0.784 United Kingdom Pound 2018 0.75 United Kingdom Pound 2017 0.808

Create a Year column
Add a new Year column to the existing Date table.
In Model view, right-click the Date table and select New column.
In the DAX formula bar, enter the following expression:
Year = YEAR([Date]), and then press Enter.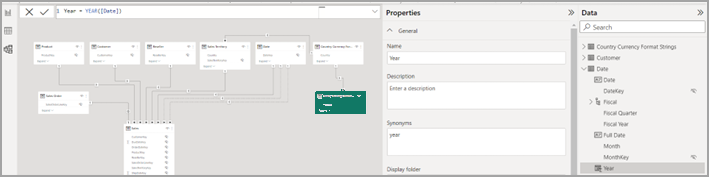

Create relationships
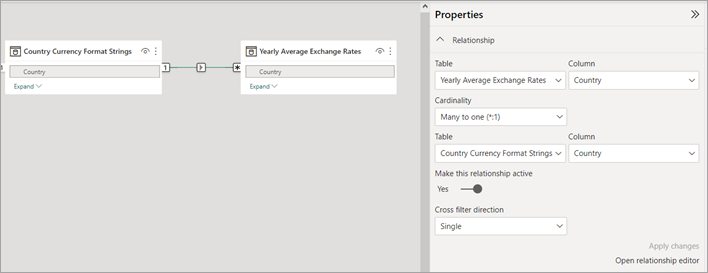
Create relationships between your new Yearly Average Exchange Rates and Country/Region Currency Format Strings tables, and between the Yearly Average Exchange Rates table and the existing Date table.
If you turn on Autodetect for relationships (on the Column tools tab, select Manage relationships, and then select Autodetect), the relationship between Country/Region Currency Format Strings and Yearly Average Exchange Rates on the Country/Region column might be created for you. If not, create this relationship by using the New relationship button in Column tools > Manage relationships:
- Table 1: Yearly Average Exchange Rates
- Table 1 Column: Country/Region
- Cardinality: Many to one
- Table 2: Country/Region Currency Format Strings
- Table 2 Column: Country/Region
- Make this relationship active: Yes
- Cross filter direction: Single
The relationship should look like this:
If you turn on Autodetect for relationships, a relationship between Country/Region Currency Format Strings and Sales territory on the Country/Region column might be created. Delete this relationship because it isn't correct for the model.
Instead, create a relationship between Yearly Average Exchange Rates and Date on the Year column.
- Table 1: Yearly Average Exchange Rates
- Table 1 Column: Year
- Cardinality: Many to Many
- Table 2: Date
- Table 2 Column: Year
- Make this relationship active: Yes
- Cross filter direction: Single ('Yearly Average Exchange Rate' filters 'Date')
The relationship should look like this:

Save your model.


Create a measure group table
A measure group helps you organize different measures by having them in a single table.
- On the Home ribbon, select Enter data.
- In the Create Table dialog, leave the values blank. Name the table Sales measures, and then select Load. This table contains your new measures.
Create measures
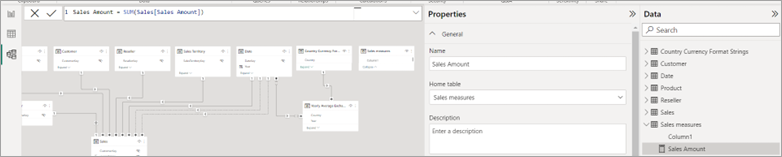
In the Data pane, expand and right-click Sales measures, and then select New measure. Enter the following DAX expression into the DAX formula bar, and then press Enter:
Sales Amount = SUM(Sales[Sales Amount])It should look like this:
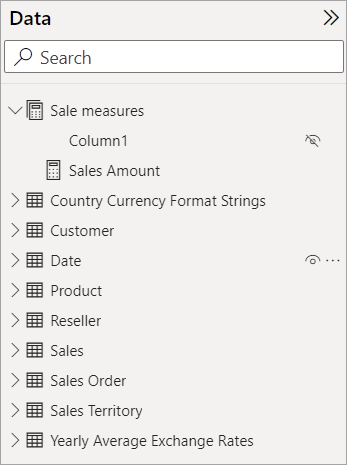
In Sales measures, right-click Column1 and select Hide in report view. This change makes Sales measures a measure group, which now appears at the top of the Data pane with a measure group icon, like this:
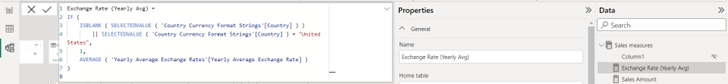
You can now create a measure to compute the exchange rate. Right-click Sales measures, select New measure, enter the following expression into the DAX formula bar, and press Enter:
Exchange Rate (Yearly Avg) =
IF (
    ISBLANK ( SELECTEDVALUE ( 'Country/Region Currency Format Strings'[Country/Region] ) )
        || SELECTEDVALUE ( 'Country/Region Currency Format Strings'[Country/Region] ) = "United States",
    1,
    AVERAGE ( 'Yearly Average Exchange Rates'[Yearly Average Exchange Rate] )
)
It should look like this:
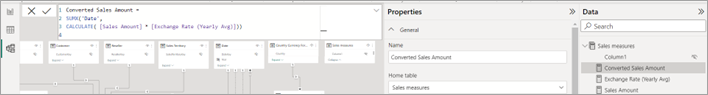
Now, create another measure to convert the Sales Amount measure to other currencies. Right-click Sales measures, select New measure, enter the following expression into the DAX formula bar, and press Enter:
    Converted Sales Amount =
    SUMX('Date',
    CALCULATE( [Sales Amount] * [Exchange Rate (Yearly Avg)]))
The Sales measures measure group should now look like this:


Create a report
Go to Report view. Add a new blank page to the report.
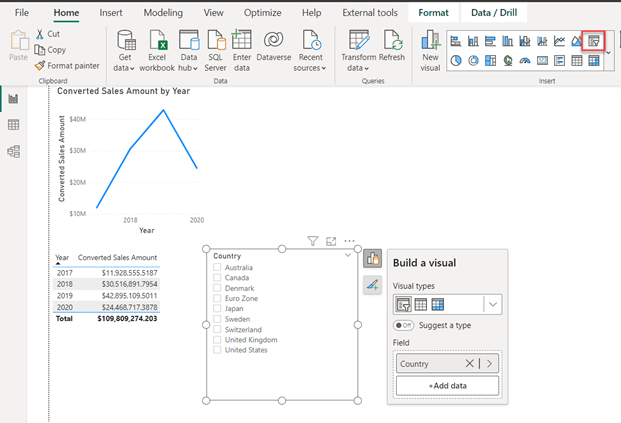
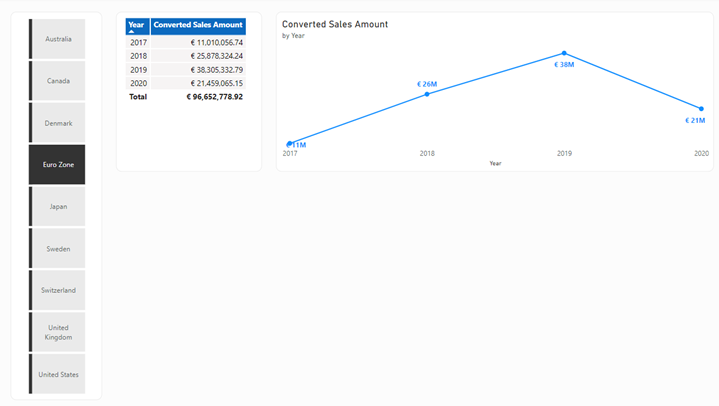
Add a line chart visual to your new report page. Use this visual to see your measure before adding the dynamic format string for measures.
In the Data pane > Sales measures, select Converted Sales Amount. Without selecting anywhere else, also select Year in the Date table.
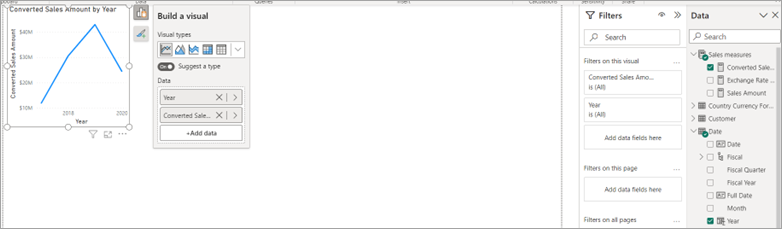
Copy and paste the visual so you have two line chart visuals. Change the second line chart visual to a table visual, and then move it below the line chart, like this:
Add a list slicer visual to your report page by selecting List slicer in the Visualizations pane. In the Data pane, select Country/Region from the Country/Region Currency Format Strings table to add it to the slicer.
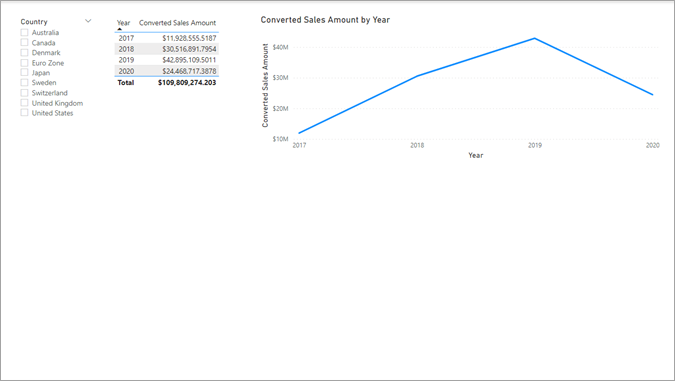
Rearrange the visuals until they have a better layout, something like this:
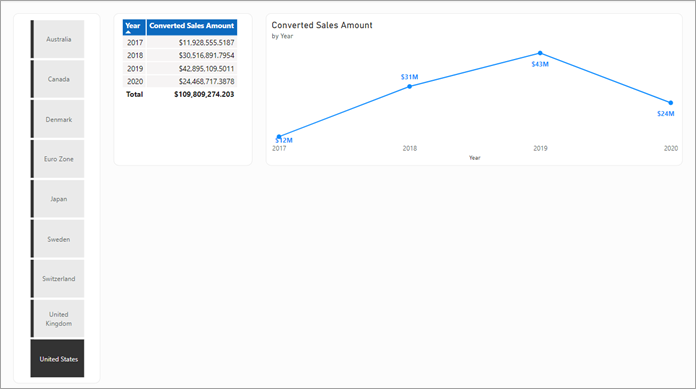
Although not required, you can change visual properties to make a nicer report. Use the Format your visual button in the Visualizations pane to make the following changes:
Slicer
- Visual tab > Slicer settings > Single select > On
- General tab > Properties > Padding: 10 px, all edges
- General tab > Effects > Visual border: On, light gray, 10-px rounded corners
- General tab > Title: Off
- Visual tab > Buttons > Border: #333333, 6 line width
Table
- General tab > Properties > Padding: 10 px, all edges
- General tab > Effects > Visual border: On, light gray, 10-px rounded corners
- Visual tab > Grid > Horizontal gridlines: On, White, 2 width
- Visual tab > Grid > Vertical gridlines: On, White, 2 width
- Visual tab > Grid > Border: White
- Visual tab > Grid > Options: 2 row padding
- Visual tab > Values > Background color: #F6F4F4
- Visual tab > Values > Alternate background color: #F6F4F4
- Visual tab > Column headers > Text: Bold, Text color white, Background color #0D6ABF
Line chart
- General tab > Properties > Padding: 10 px, all edges
- General tab > Effects > Visual border: On, light gray, 10 px rounded corners
- General tab > Properties > Title > Subtitle: On
- Visual tab > Y-axis > Title: Off
- Visual tab > Y-axis > Values: Off
- Visual tab > Markers: On
- Visual tab > Data labels: On
- Visual tab > Data labels > Value: Bold, Blue
Canvas (optional)
- Canvas settings > Canvas background: light gray, 85% transparency
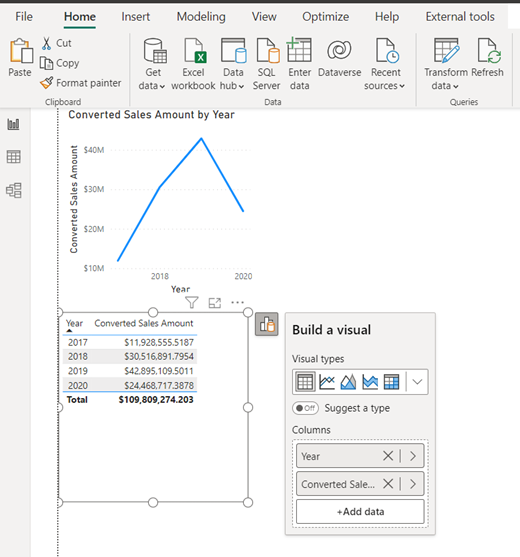
By using these visual properties, you create a report page that looks like this:


Create a dynamic format string
When you select different Country/Region names in the slicer, the visuals show the Converted Sales Amount measure result but not in the right format for that country/region.
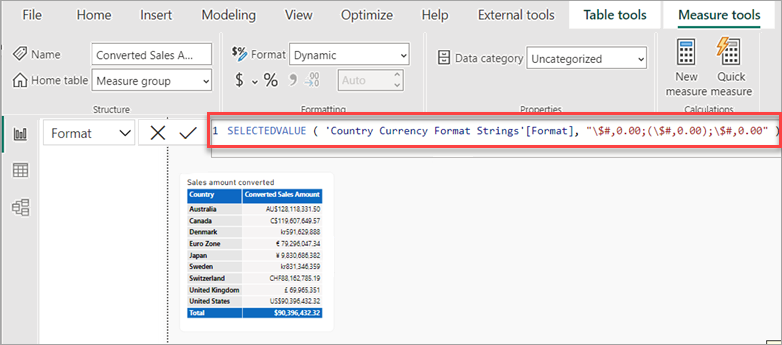
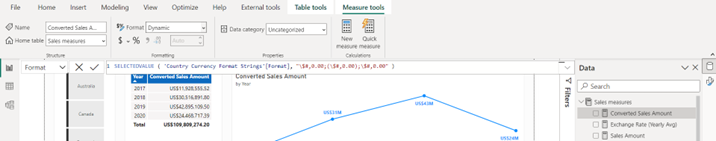
In the Data pane, under Sales measures, select Converted Sales Amount.
In the Measure tools ribbon, select Dynamic from the Format drop-down.
The drop-down to the left of the formula bar now says Format, and the formula in the formula bar has a format string. Replace the format string with the following DAX expression, and then press Enter:
SELECTEDVALUE ( 'Country/Region Currency Format Strings'[Format], "\$#,0.00;(\$#,0.00);\$#,0.00" )It should look like this:
Select a different Country/Region in the slicer. The table and line chart visuals now show the converted currency amount, in the correct format, for that Country/Region or region. Try selecting a different country/region in the slicer to see how the visuals change.
Save your model.


Dynamic format strings for duration measures
When you have duration data stored in milliseconds, displaying raw values like "3,600,000 ms" isn't user-friendly. You can use dynamic format strings to show "1.0 h" instead, while keeping the underlying measure in milliseconds for accurate calculations and comparisons.
Create a test table
To try this pattern, create a calculated table with sample duration values:
Events =
DATATABLE(
    "Event", STRING,
    "DurationMs", INTEGER,
    {
        {"Quick click", 500},
        {"Page load", 5000},
        {"Report refresh", 120000},
        {"Data export", 7200000}
    }
)
Create the duration measure
Create a measure that sums the duration and returns the raw milliseconds:
Duration (ms) = SUM(Events[DurationMs])
Add the dynamic format string
Add a dynamic format string that converts and formats the value into the appropriate time unit:
VAR ms = SELECTEDMEASURE()
RETURN
    SWITCH(
        TRUE(),
        ms < 1000, FORMAT(ms, "#,0") & " \m\s",
        ms < 60000, "'" & FORMAT(ms / 1000, "#,0.0") & " s'",
        ms < 3600000, "'" & FORMAT(ms / 60000, "#,0.0") & " m'",
        "'" & FORMAT(ms / 3600000, "#,0.0") & " h'"
    )
How the format string works
The following table shows how raw millisecond values convert to readable formats:
| Raw value (ms) | Converted | Display |
|---|---|---|
| 500 | 500 | 500 ms |
| 5,000 | 5.0 | 5.0 s |
| 120,000 | 2.0 | 2.0 m |
| 7,200,000 | 2.0 | 2.0 h |
The SELECTEDMEASURE() function retrieves the actual measure value, converts it to the appropriate unit, and then wraps it in a literal format string using single quotes.
Benefits of this approach
- Calculations stay accurate: Your measure returns milliseconds, so totals, averages, and comparisons all work correctly.
- Display is human-readable: Users see "2.5 s" instead of "2,500".
- One pattern, many measures: Apply the same format string to all your duration measures.
- Charts work properly: Unlike using
FORMAT()in the measure itself, dynamic format strings preserve the numeric data type for visualizations.
Tips for duration format strings
- Use
\m\sto escape "ms" as literal text in format strings. - The single quotes (
'...') in the return statement force Power BI to treat the entire formatted string as a literal. - This pattern works with calculation groups too. Apply it once and format multiple measures automatically.
Tip
If you have multiple duration measures that need this format string, consider creating a DAX user-defined function to define the formatting logic once and reuse it across all your measures.
Known problems and considerations
Visuals have formatting options that might affect how the format string appears. If the formatting unexpectedly appears in a visual, go to the visual Visualizations > Format visual options, search for Display units, and change them from Auto to None.

To turn off display units for all visuals in a report, you can use a custom report theme. Create a JSON file with the following content and import it as a theme:
{
   "$schema": "https://raw.githubusercontent.com/microsoft/powerbi-desktop-samples/main/Report%20Theme%20JSON%20Schema/reportThemeSchema-2.149.json",
   "name": "DisplayUnitsNone",
   "visualStyles": {
     "*": {
       "*": {
         "*": [
           {
             "displayUnits": 1,
             "labelDisplayUnits": 1,
             "titleDisplayUnits": 1,
             "detailDisplayUnits": 1,
             "valueDisplayUnits": 1,
             "secLabelDisplayUnits": 1,
             "titleLabelDisplayUnits": 1
           }
         ]
       }
     },
     "cardVisual": {
       "*": {
         "*": [{
             "$id": "default",
             "displayUnits": 1,
             "labelDisplayUnits": 1,
             "titleDisplayUnits": 1,
             "detailDisplayUnits": 1,
             "valueDisplayUnits": 1,
             "secLabelDisplayUnits": 1,
             "titleLabelDisplayUnits": 1
           }
         ]
       }
     }
   }
}
You can reference the measure itself in its dynamic format string directly by using its name, such as [Measure A], or indirectly by using
SELECTEDMEASURE().Dynamic format strings for measures apply only to model measures. You can't add dynamic format strings for report measures in a live connect report.
By using DirectQuery for Analysis Services, when you select Make changes to this model on a live connect report, you shift the connection to the DirectQuery over Analysis Services. In general, you can make changes to the format strings of the remote model measures. By using dynamic format strings for measures:
- Remote model measures with dynamic format strings defined are blocked from making format string changes to a static format string or to a different dynamic format string DAX expression.
- You can't change remote model measures from a static format string to a dynamic format string DAX expression defined in the local model.
- Local model measures are blocked from using dynamic format strings for measures.
