Let users personalize visuals in a report
APPLIES TO: ![]() Power BI Desktop
Power BI Desktop ![]() Power BI service
Power BI service
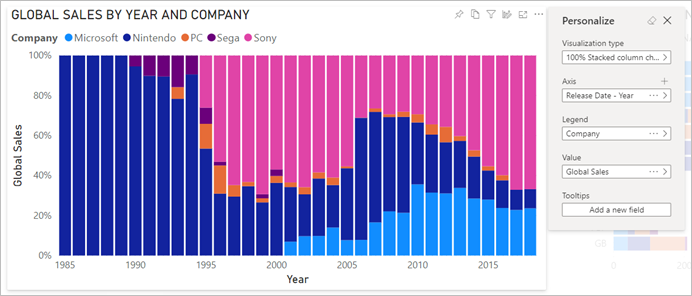
When you share a report with a broad audience, some of your users might want to see slightly different views of particular visuals. Maybe they'd want to swap what's on the axis, change the visual type, or add something to the tooltip. It's difficult to make one visual that satisfies everyone's requirements. With this new capability, you can empower your business users to explore and personalize visuals, all in report reading view. They can adjust the visual the way they want and save it as a bookmark to come back to. They don't need to have edit permission for the report or go back to the report author for a change.
What report users can change
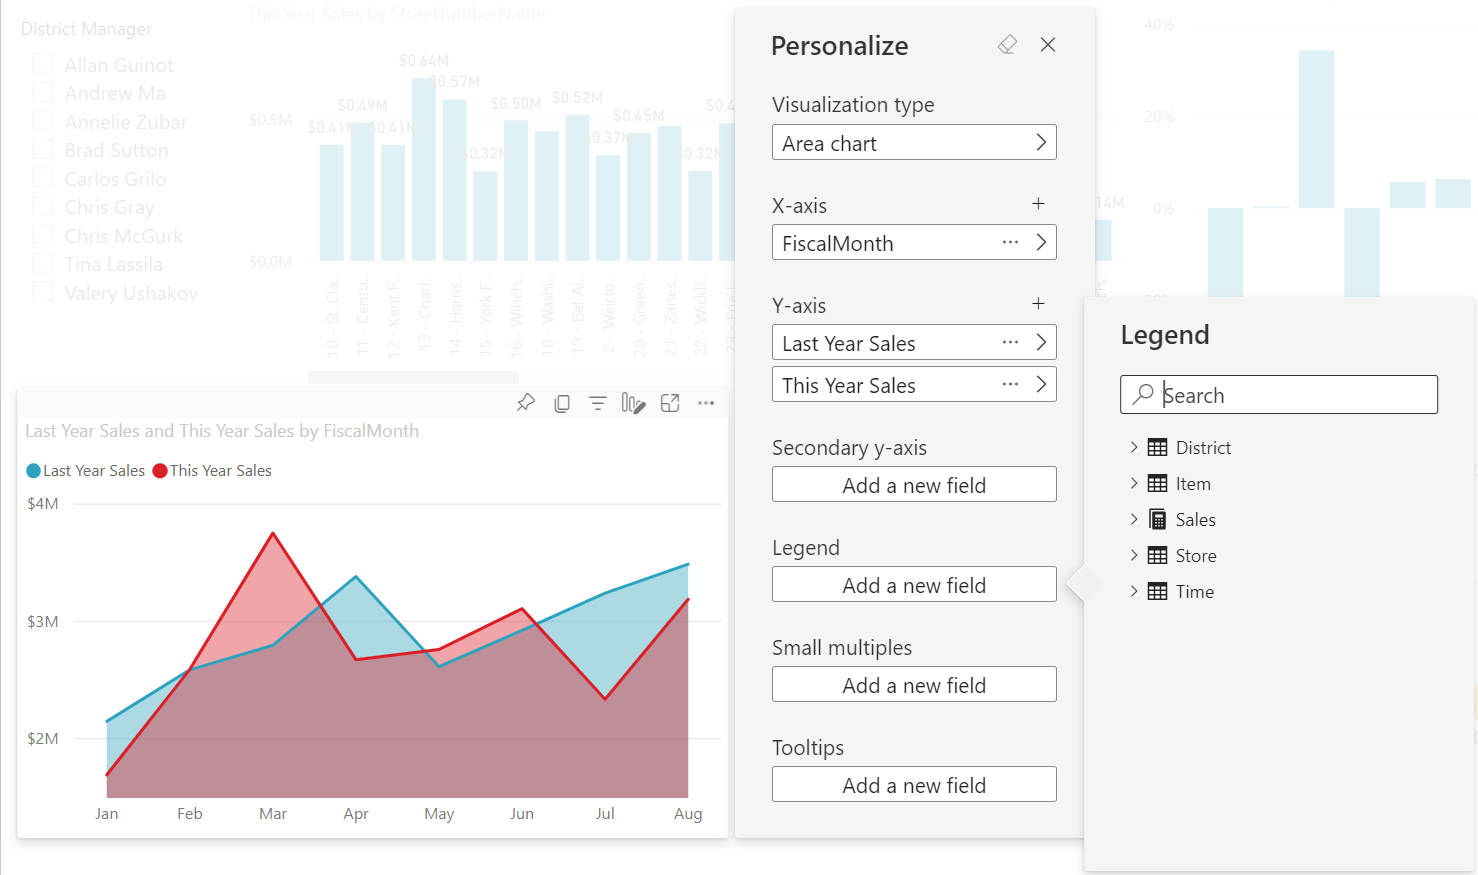
This feature is ideal for report creators: You can enable basic exploration scenarios for your report readers. Your report readers gain further insights through ad hoc exploration of visuals on a Power BI report. Here are modifications that they can make:
- Change the visualization type.
- Swap out a measure or dimension.
- Add or remove a legend.
- Compare two or more measures.
- Change aggregations, etc.
Not only does this feature allow for new exploration capabilities, it also includes ways for users to capture and share their changes:
- Capture their changes.
- Share their changes.
- Reset all their changes for a report. Selecting Reset to default removes all personalizations.
- Reset all their changes for a visual.
- Clear out their recent changes.
After report readers personalize a report, they can create personal bookmarks to save their personalizations. To learn how report readers can use this feature, see Personalize visuals in your reports.
Enable personalization in a report
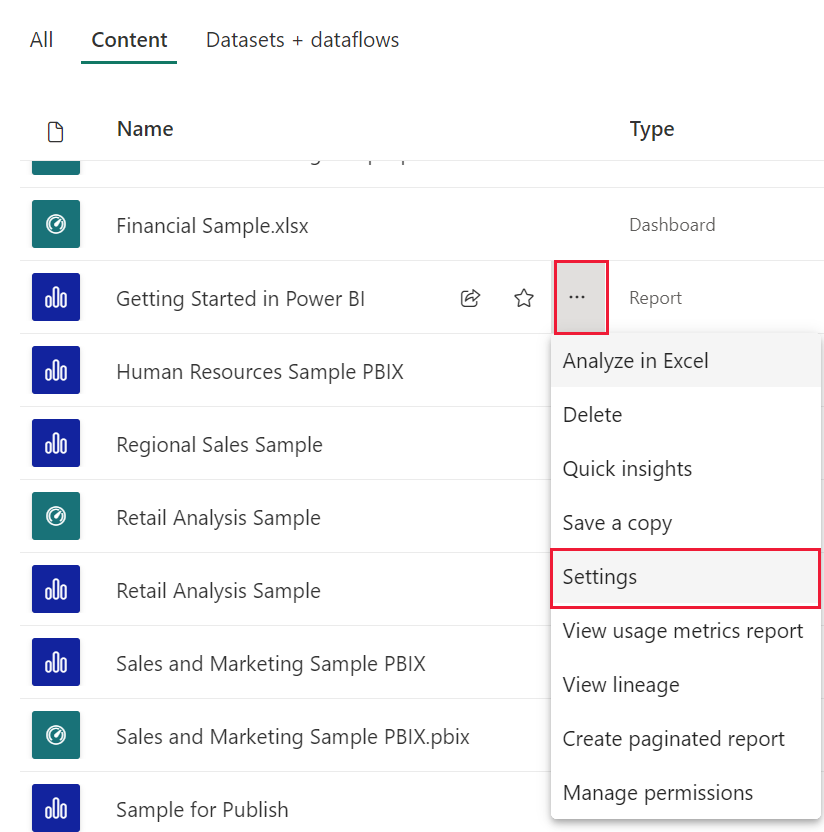
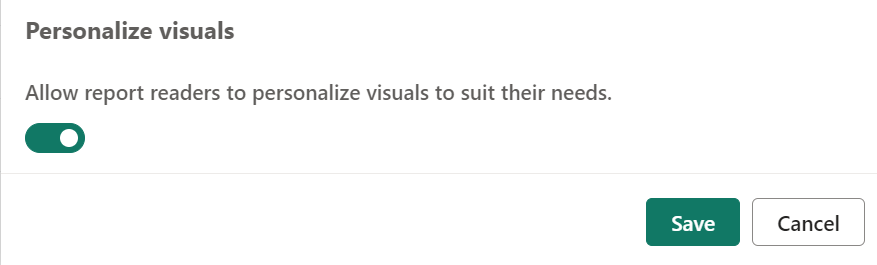
You can enable the feature either in Power BI Desktop or the Power BI service. You can also enable it in embedded reports.
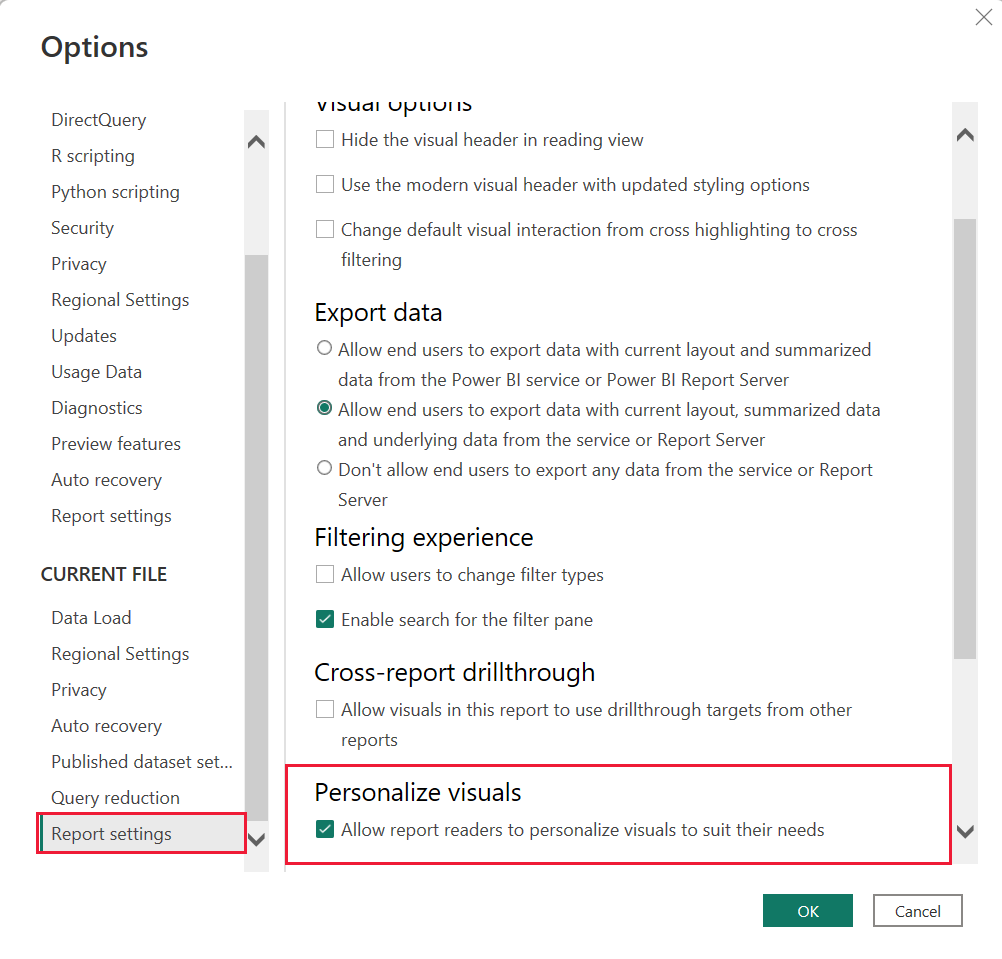
To enable the feature in Power BI Desktop, go to File > Options and settings > Options > Current file > Report settings. Select the Personalize visuals checkbox.
Switch the feature on or off at a page or visual level
When you enable Personalize visuals for a given report, by default all visuals in that report can be personalized. If you don't want all the visuals to be personalized, you can switch the setting on or off per page or per visual.
Personalize visual per page
Select the page tab > select Format in the Visualizations pane.
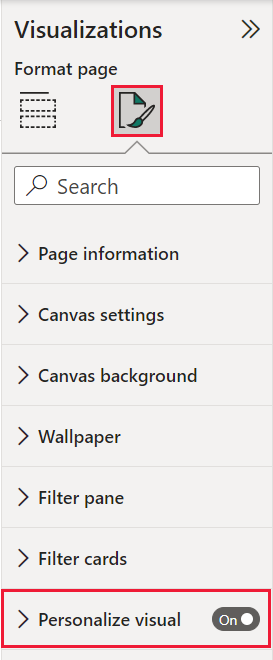
Slide Personalize visual > On or Off.
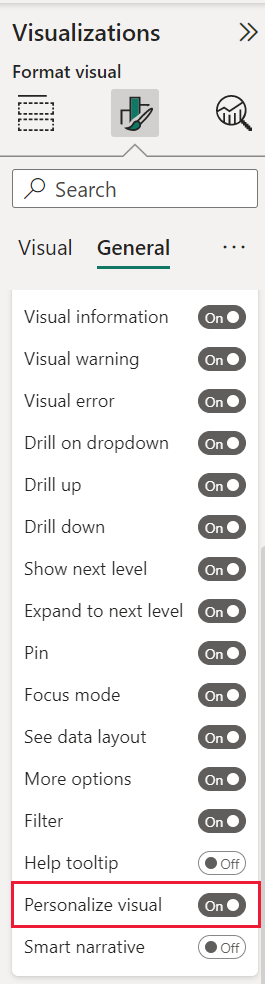
Personalize visual per visual
Select the visual. Then select Format > General > Header icons > Icons.
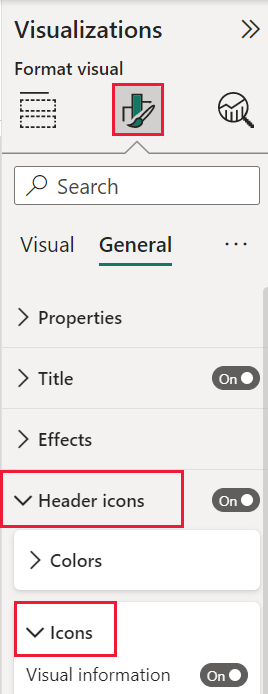
Slide Personalize visual > On or Off.
Use Perspectives for a more focused view
For Personalize visuals, you can use Perspectives to choose a subset of a model that provides a more focused view. Choosing a subset can be helpful when working with a large data model, allowing you to focus on a manageable subset of fields. Choosing a subset can also help to not overwhelm report readers with the full collection of fields in that large model.
Keep the following considerations in mind when working with perspectives:
Perspectives aren't meant to be used as a security mechanism, they're a tool for providing a better end-user experience. All security for a perspective is inherited from the underlying model.
Perspectives in both tabular and multi-dimensional models are supported. However, for perspectives in multi-dimensional models, you can only set the perspective to be the same as the base cube for the report.
Before deleting a perspective from a model, be sure to check that the perspective isn't being used in the Personalize visuals experience.
To use Perspectives, you must enable Personalize visuals for the report. You also must create at least one Perspective that includes the dimensions and measures you want end-users to interact with for the Personalize visuals experience.
To create the perspective use Tabular Editor, which you can download from the following location: Tabular Editor download.
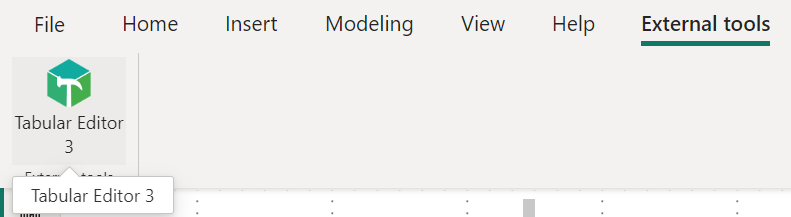
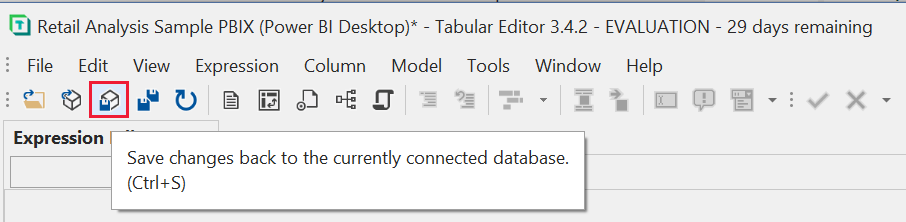
Once you install Tabular Editor, open your report in Power BI Desktop and launch Tabular Editor from the External Tools tab of the ribbon.
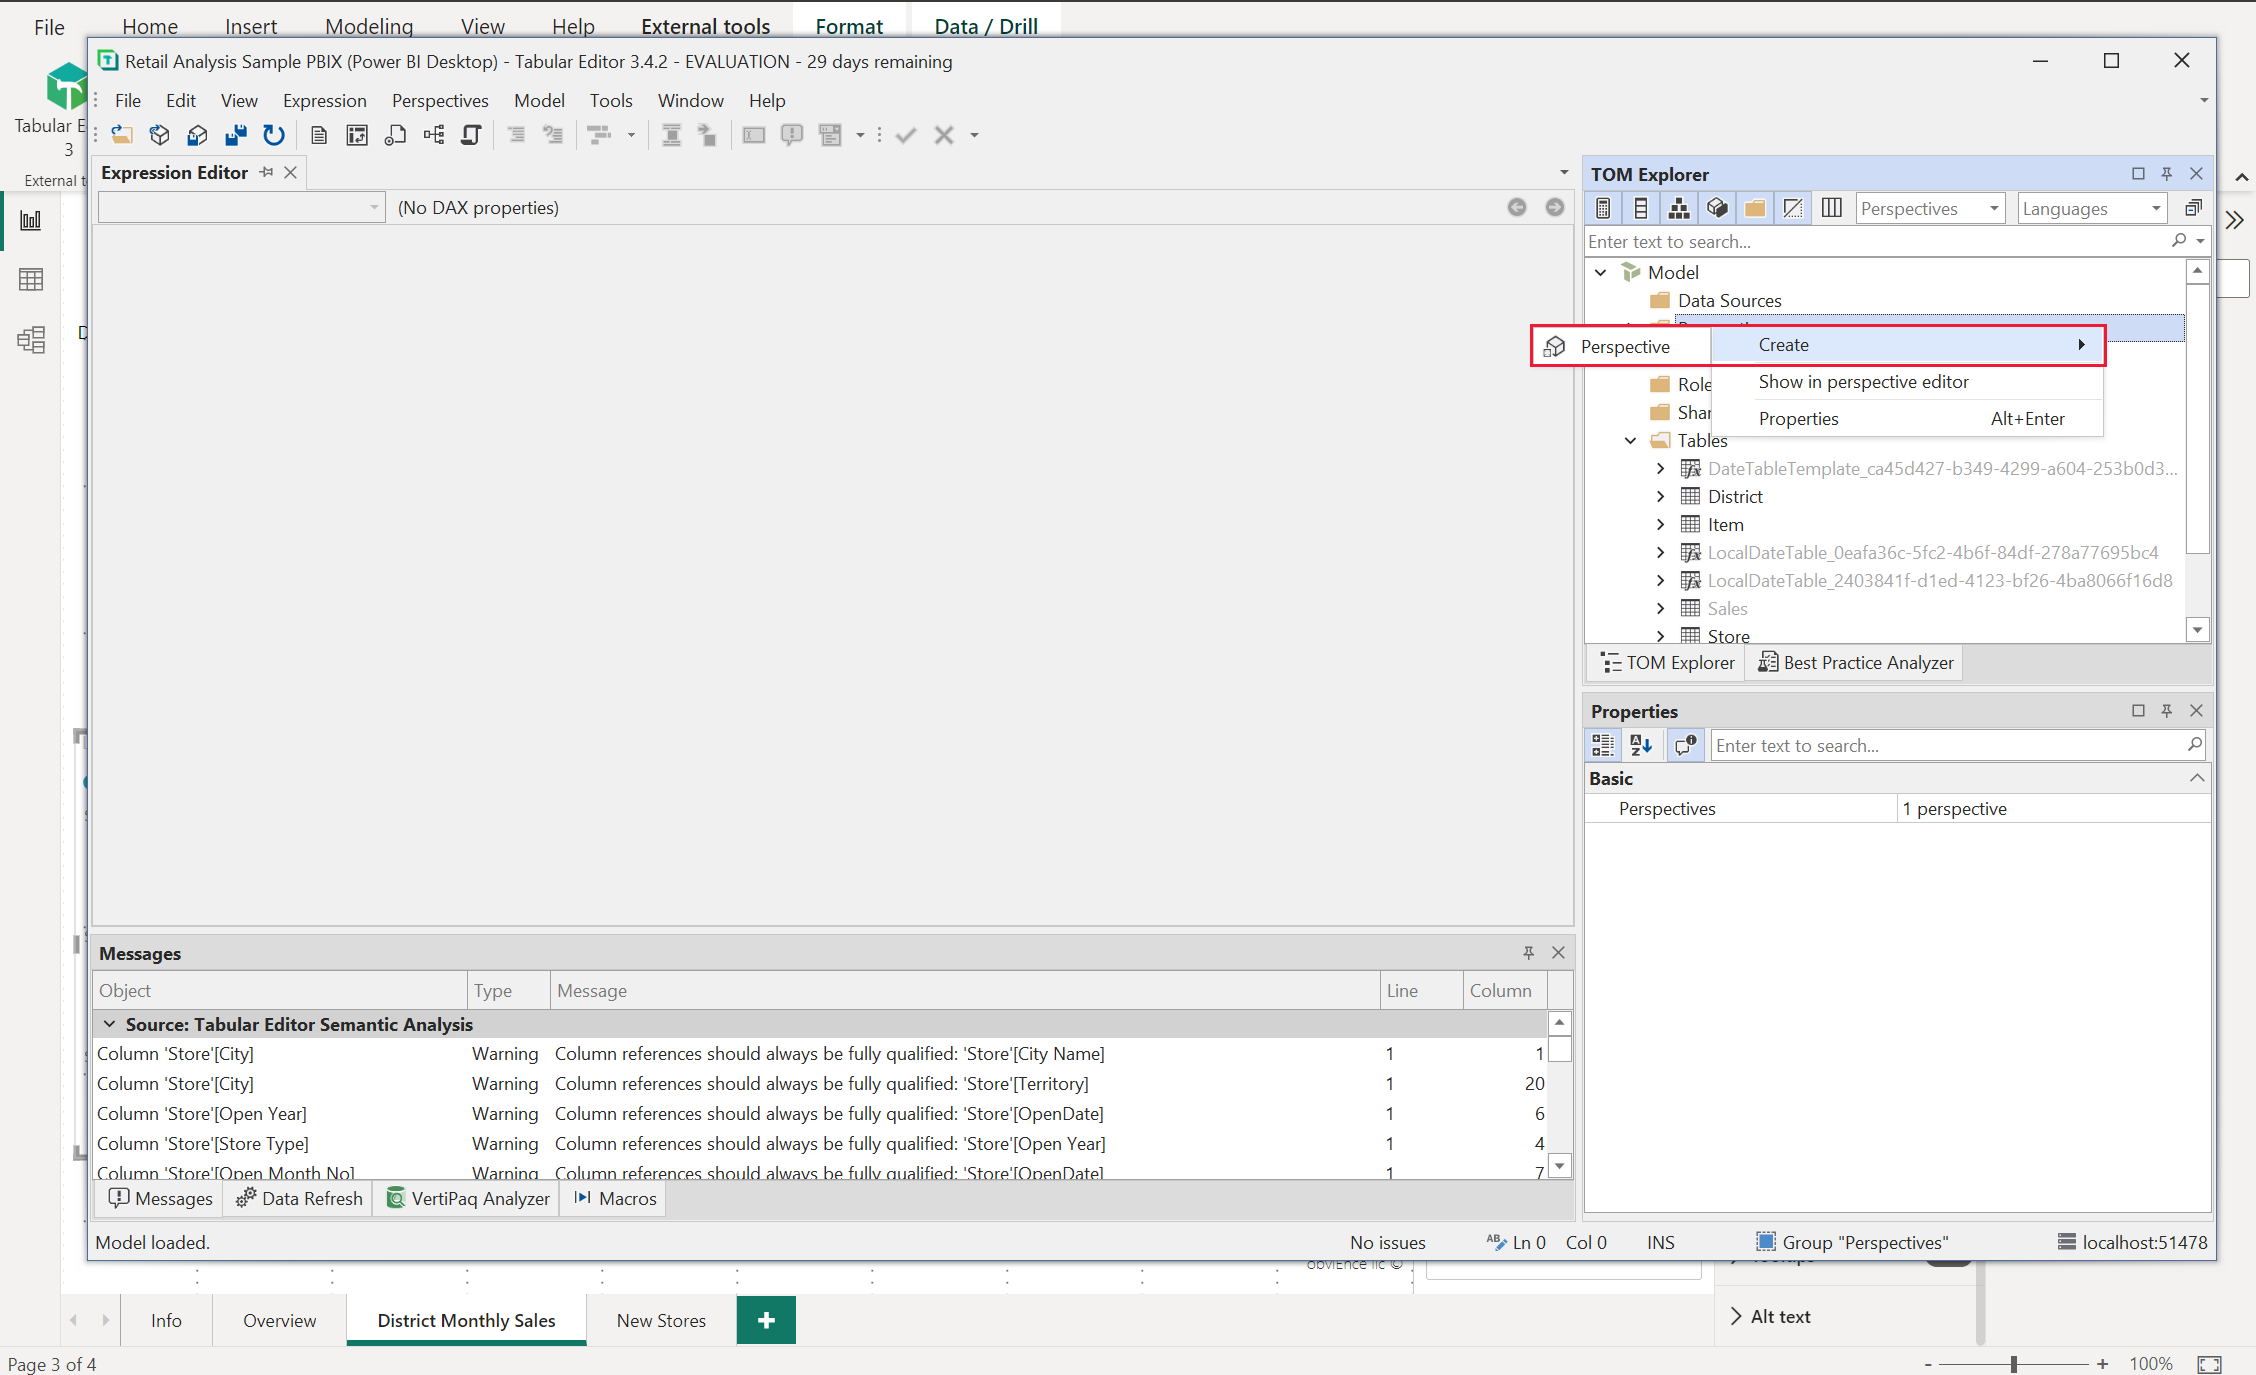
In Tabular Editor, right-click on Perspectives > Create > Perspective.
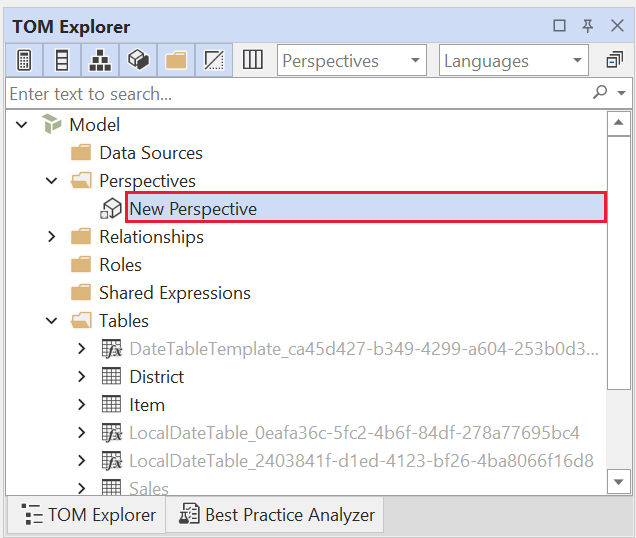
You can double-click the text to rename the perspective.
Next, add fields to the perspective by opening the Tables folder in Tabular Editor. Then right-click on the fields you want to show in the perspective.
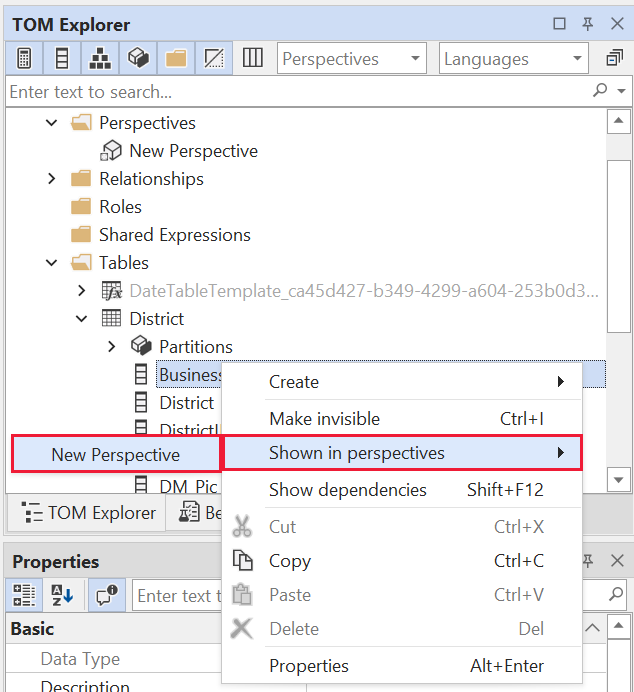
Repeat that process for each field you want to add to the perspective. You can’t add duplicate fields in a perspective, so any field you already added can’t be added again.
After you added all the fields you want, be sure to save your settings, both in Tabular Editor and then also in Power BI Desktop.
Once you save the new perspective to the model and save the Power BI Desktop report, go to the Format pane for the page, where you see a new section for Personalize visual.
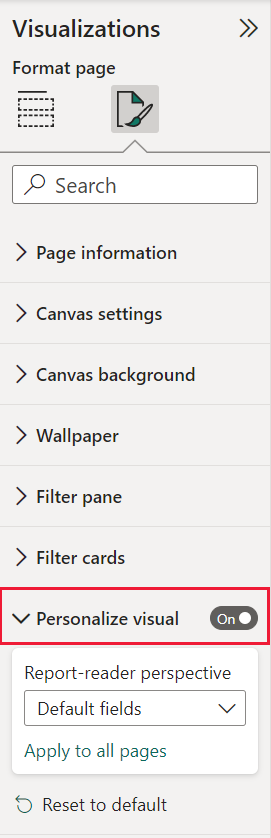
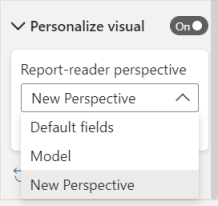
The selection for Report-reader perspective is set to Default fields initially. Once you select the dropdown arrow, you see the other Perspectives you’ve created.
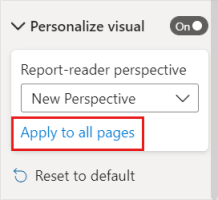
Once you set the Perspective for the report page, the Personalize visuals experience for that page is filtered to the selected Perspective. Select Apply to all pages to apply your Perspective setting to all existing pages in your report.
Considerations and limitations
The feature has a few limitations to be aware of.
- This feature isn't supported for publish to web.
- Export to PowerPoint and PDF don't capture personalized visuals.
- User explorations don't automatically persist. Encourage your report readers to save their views as personal bookmarks to capture their changes.
- This feature is supported in the Power BI mobile apps for iOS and Android tablets, and in the Power BI Windows app. It isn't supported in the Power BI mobile apps for phones. However, any change to a visual you save in a personal bookmark while in the Power BI service is respected in all the Power BI mobile apps.
Related content
More questions? Ask the Power BI Community
Feedback
Coming soon: Throughout 2024 we will be phasing out GitHub Issues as the feedback mechanism for content and replacing it with a new feedback system. For more information see: https://aka.ms/ContentUserFeedback.
Submit and view feedback for