Note
Access to this page requires authorization. You can try signing in or changing directories.
Access to this page requires authorization. You can try changing directories.
APPLIES TO: ![]() Power BI Desktop
Power BI Desktop ![]() Power BI service
Power BI service
In this tutorial, you start with a built-in Power BI sample semantic model and create a report with a decomposition tree. A decomposition tree is an interactive visual for exploration and conducting root cause analysis.
A decomposition tree is also an artificial intelligence (AI) visualization. You can ask it to find the next category, or dimension, to drill down into based on certain criteria. For more information, see Create and view decomposition tree visuals in Power BI.

Note
You can also create a decomposition tree in the Power BI service by following similar steps. For simplicity, the rest of this tutorial demonstrates the process in Power BI Desktop.
This tutorial shows you how to:
- Download the Retail Analysis sample and open it in Power BI Desktop.
- Create a decomposition tree.
- Do root cause analysis on your data in the decomposition tree in Edit mode.
- Save the report and continue root cause analysis in reading view.
If you want to get familiar with the built-in sample in this tutorial and its scenario, see Retail Analysis sample for Power BI: Take a tour before you start.
Prerequisites
Tip
You don't need a Power BI license to explore the samples in Power BI Desktop.
- To open a Power BI .pbix file, you need to get Power BI Desktop. It's a free download.
- You need to download the Retail Analysis Sample .pbix file.
Open the sample in Power BI Desktop
Download the Retail Analysis Sample .pbix file.
Open the Retail Analysis Sample in Power BI Desktop. The report should open in Report view.


Create a decomposition tree
Now you can create a decomposition tree to analyze the sample data.
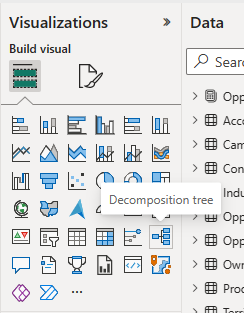
In the Visualizations pane under Build visual, select the Decomposition tree icon.
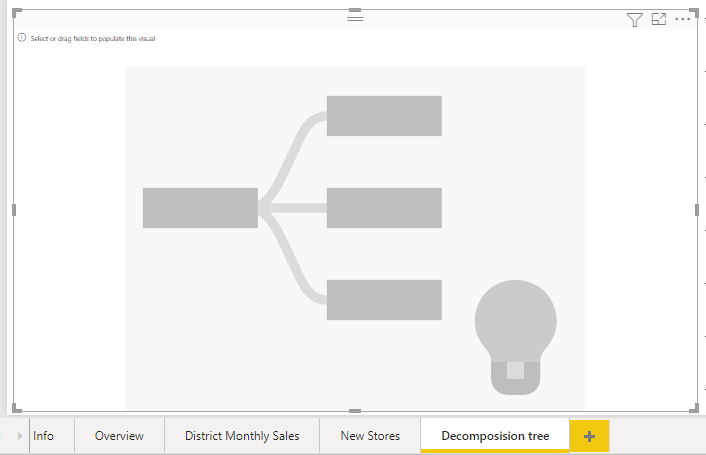
Decomposition trees can get wide. Select the focus mode icon or drag the edge so the visualization fills most of the page. In this example, we're in focus mode.
Expand Sales > This Year Sales and then select Value. Power BI adds the corresponding value to the Analyze box.
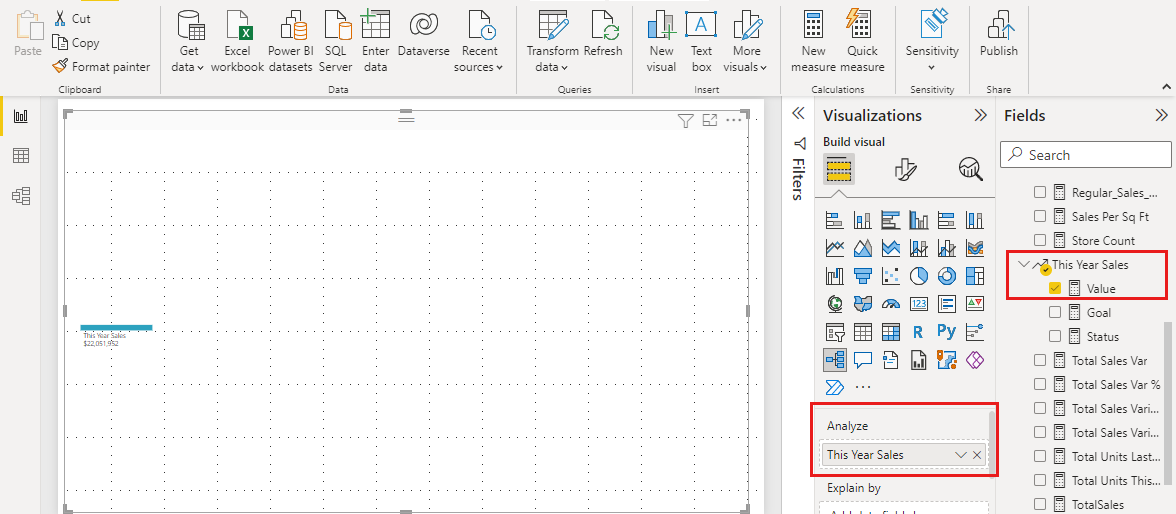
Decomposition trees analyze one value by many categories, or dimensions.
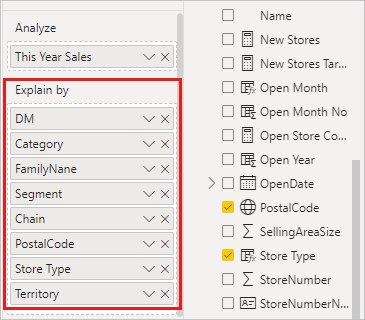
Next, select each dimension field that you want added to the Explain by box. Let's select these fields:
- District > DM (District Manager)
- Item > Category
- Item > FamilyNane (Family Name)
- Item > Segment
- Store > Chain
- Store > PostalCode
- Store > Store Type
- Store > Territory
Add as many as you want, in any order. You can use them or not, in any order, in the decomposition tree.


Analyze in the decomposition tree
Now comes the analysis part.
Select the plus sign (+) next to This Year Sales and select High value.
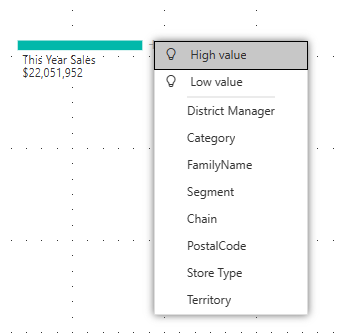
That means Power BI uses artificial intelligence to analyze all the different categories in the Explain by box, and pick the one to drill into to get the highest value of the measure being analyzed.
Power BI selects Store type.
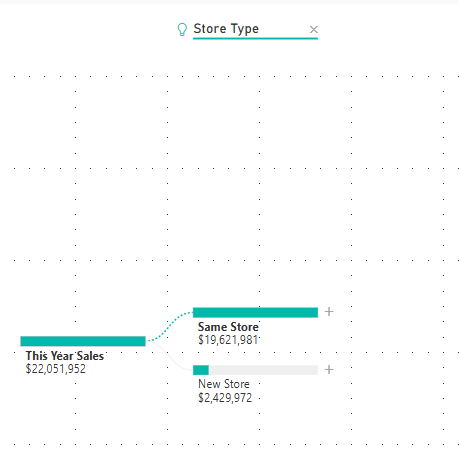
Select the plus sign (+) next to Same Store and select High value. Keep selecting High value from the top nodes until you have a decomposition tree that looks like this one.
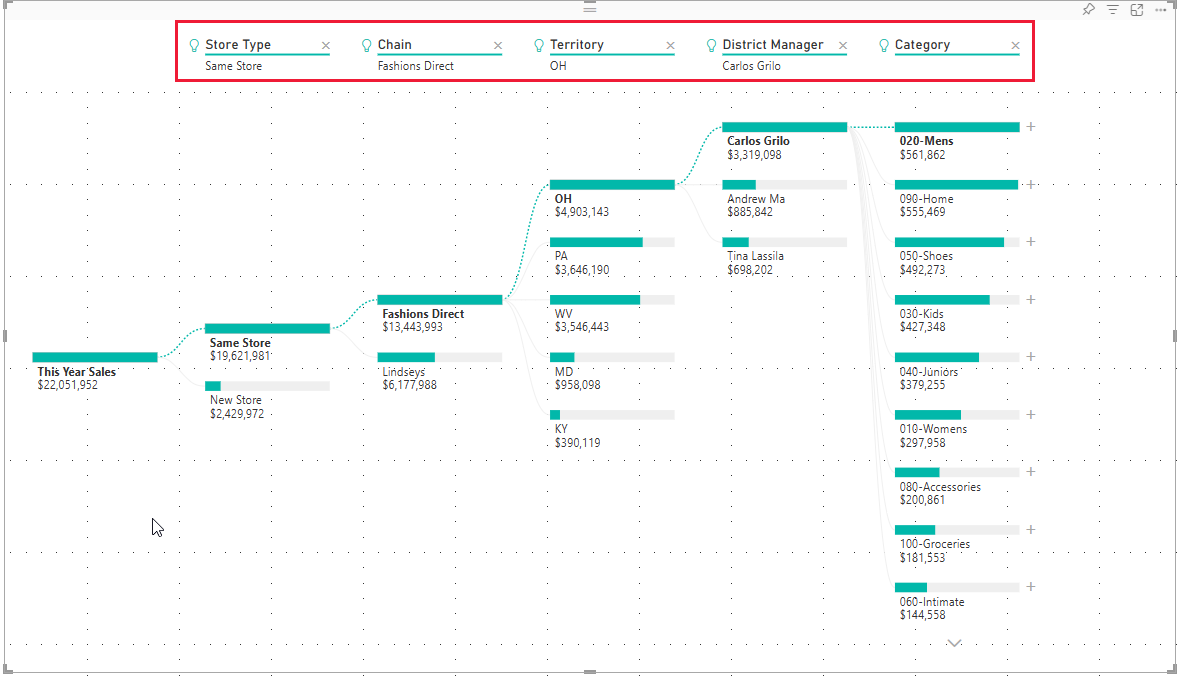
We selected Same store > Chain > Territory > DM > Category. Or select other values yourself, and see what you end up with.
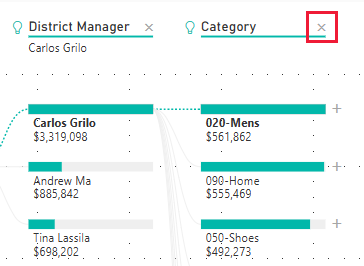
You can delete a dimension by selecting the X next to the corresponding heading.
Save the report by selecting Share > Share or Share > Copy link.


Now anyone who views your report can interact with the decomposition tree, starting from the first This Year Sales and choosing their own path to follow.
Learn about everything else you can do with decomposition trees in Create and view decomposition tree visuals in Power BI.
Related content
More questions? Try the Power BI Community