Note
Access to this page requires authorization. You can try signing in or changing directories.
Access to this page requires authorization. You can try changing directories.
APPLIES TO: ![]() Power BI Desktop
Power BI Desktop ![]() Power BI service
Power BI service
Before you can pin a tile from your Excel workbook, you must connect that workbook to the Power BI service. Connecting a workbook brings a linked read-only version of that workbook into the Power BI service and allows you to pin ranges to dashboards. You can even pin an entire worksheet to a dashboard. If a workbook has been shared with you, you can view the tiles pinned by the owner but can't create any dashboard tiles yourself.
For in-depth information about how Excel and Power BI work together, see Get data from Excel workbook files.
Connect your Excel workbook from OneDrive for work or school to Power BI
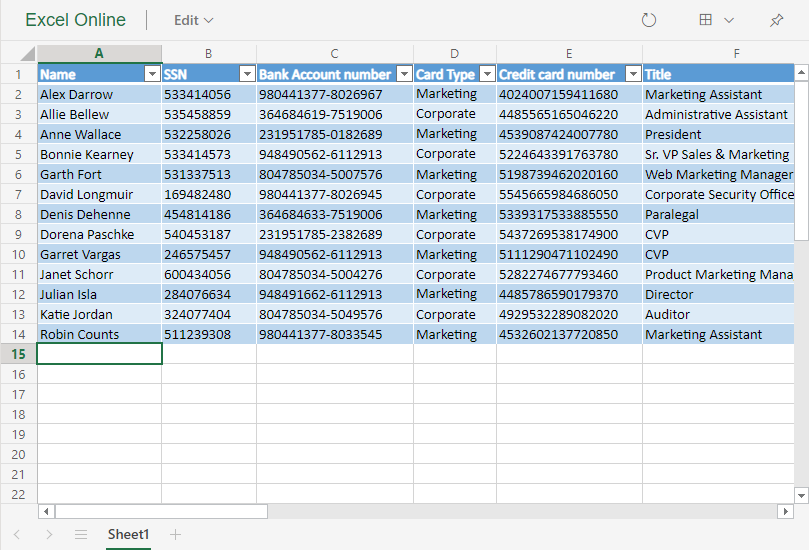
When you choose Connect, your workbook appears in Power BI just like it would in Excel Online. However, unlike Excel Online, you have some great features to help you pin elements from your worksheets right to your dashboards.
You can't edit your workbook in Power BI, but if you need to make some changes, you can select Edit from the Workbooks tab of your workspace. Then choose to edit your workbook in Excel Online or open it in Excel on your computer. Any changes you make save to the workbook on OneDrive.
Upload your workbook to your OneDrive for work or school.
From Power BI, connect to that workbook by going to My workspace and selecting Upload > OneDrive - Business and navigating to the location where you saved the Excel file. Select the file and choose Upload.
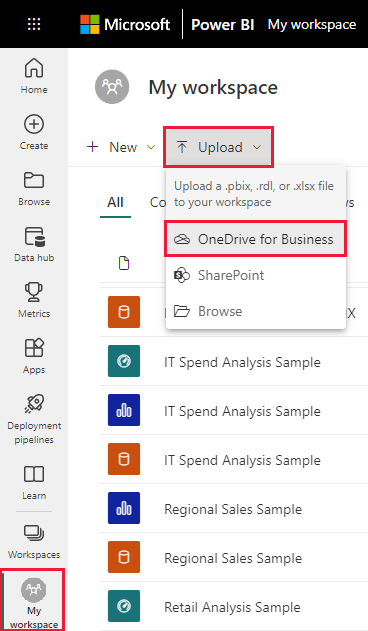
In Power BI, the workbook is added to your workspace. The
 icon indicates an Excel workbook.
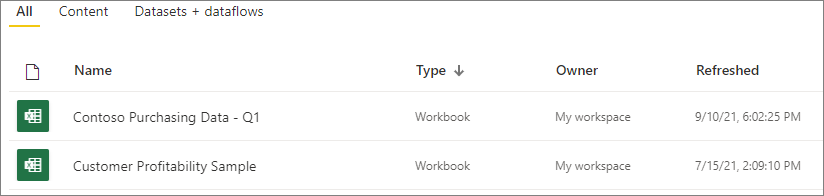
Open the workbook in Power BI by selecting the workbook name.
Changes you make to the workbook in Power BI aren't saved and don't affect the original workbook on OneDrive for work or school. If you sort, filter, or change values in Power BI, those changes can't be saved or pinned. If you need to save changes, select Edit from the upper-right corner to open it for editing in Excel Online or Excel. Changes made this way might take a few minutes to update in the tiles on the dashboards.
Pin a range of cells to a dashboard
One way to add a new dashboard tile is from within an Excel workbook in Power BI. Ranges can be pinned from Excel workbooks that have been saved in your OneDrive for work or school or another group-shared document library. The ranges can contain data, charts, tables, PivotTables, PivotCharts, and other Excel parts.
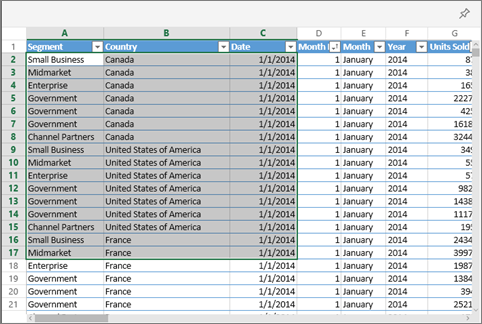
Highlight the cells that you want to pin to a dashboard.
Select the pin
 icon.
icon.Pin the tile to an existing dashboard or to a new dashboard.
- Existing dashboard: select the name of the dashboard from the dropdown.
- New dashboard: type the name of the new dashboard.
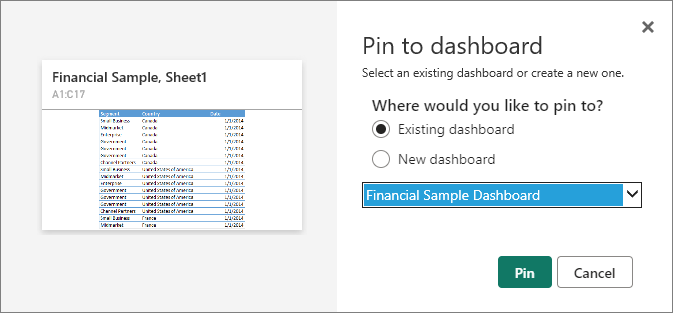
Select Pin. A success message near the top right corner lets you know the range was added as a tile to your dashboard.
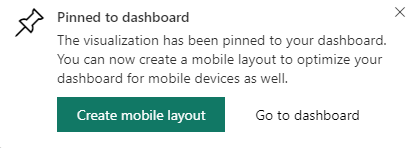
Select Go to dashboard. From here, you can create or edit a dashboard tile. By default, selecting the pinned tile opens the workbook in Power BI.
Pin an entire table or PivotTable to a dashboard
Follow the previous steps except instead of selecting a range of cells, select an entire table or PivotTable.
To pin a table, select the entire range of the table and be sure to include the headers. To pin a PivotTable, be sure to include every visible part of the PivotTable, including filters if used.
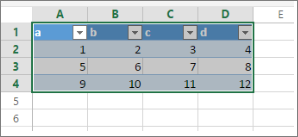
A tile created from a table or PivotTable shows the entire table. If you add, remove, or filter rows or columns in the original workbook, the rows or columns are also added, removed, or filtered in the tile.
View the workbook linked to the tile
Selecting a workbook tile opens the linked workbook in Power BI. Since the workbook file is located on the owner’s OneDrive for work or school, viewing the workbook requires you to have read permissions for the workbook. If you don't have permission, you receive an error message.
Note
The animation might use earlier versions of the Power BI service.
Considerations and troubleshooting
Power BI uses Excel Services to retrieve the workbook tiles. Therefore, since some features from Excel aren't supported in Excel Services REST API, they aren't visible on tiles in Power BI, for example: Sparklines, icon set conditional formatting, and time slicers. For a full list of unsupported features, see Unsupported Features in Excel Services REST API.
Related content
- Share a Power BI dashboard that links to an Excel file in OneDrive
- Get data from Excel workbook files
More questions? Ask the Power BI Community