Note
Access to this page requires authorization. You can try signing in or changing directories.
Access to this page requires authorization. You can try changing directories.
APPLIES TO: ![]() Power BI Desktop
Power BI Desktop ![]() Power BI service
Power BI service
Metrics in Power BI let your customers curate their metrics and track them against key business objectives, in a single pane. In addition to seeing all your metrics in one view, scorecards make it easy for you to dig deeper into the data, update your metrics, make notes on important events. These features are covered in this article. You can also follow your goals, to be notified when they change.
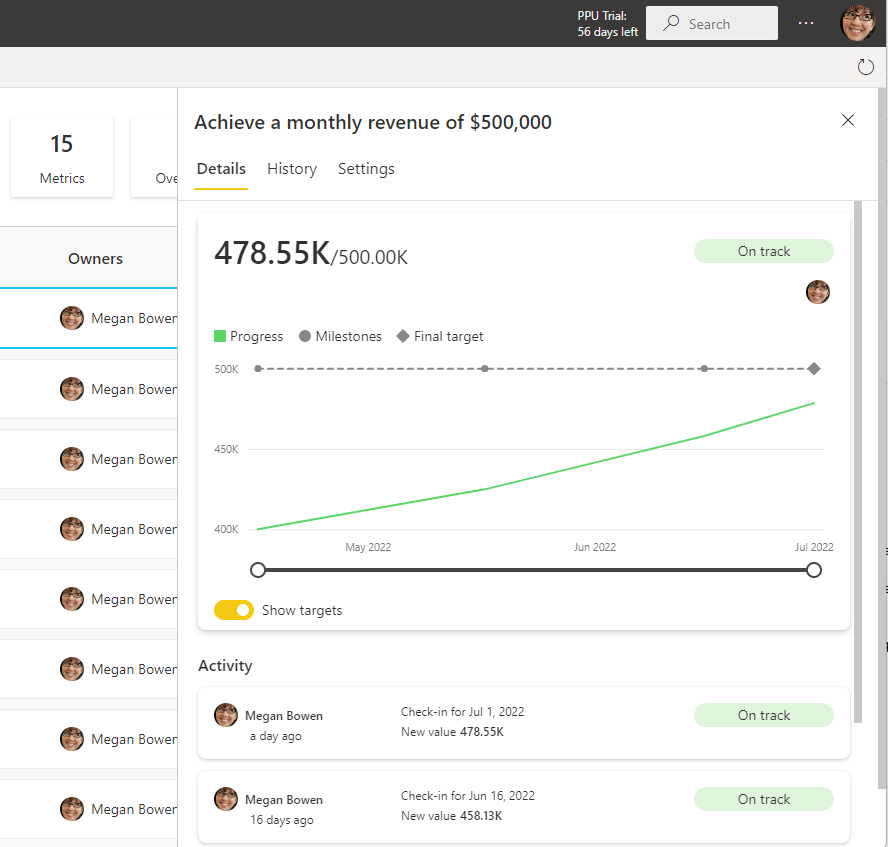
View metric details
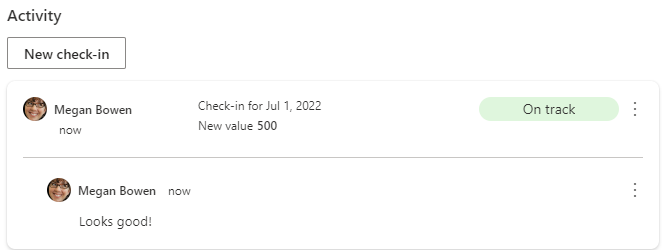
The goals Details pane provides the entire history for the metric from the start date, including check-ins, status changes, and relevant notes.
To access the details pane, open a scorecard and select the metric name. Power BI automatically shows the details pane.
Filtering and keyword search
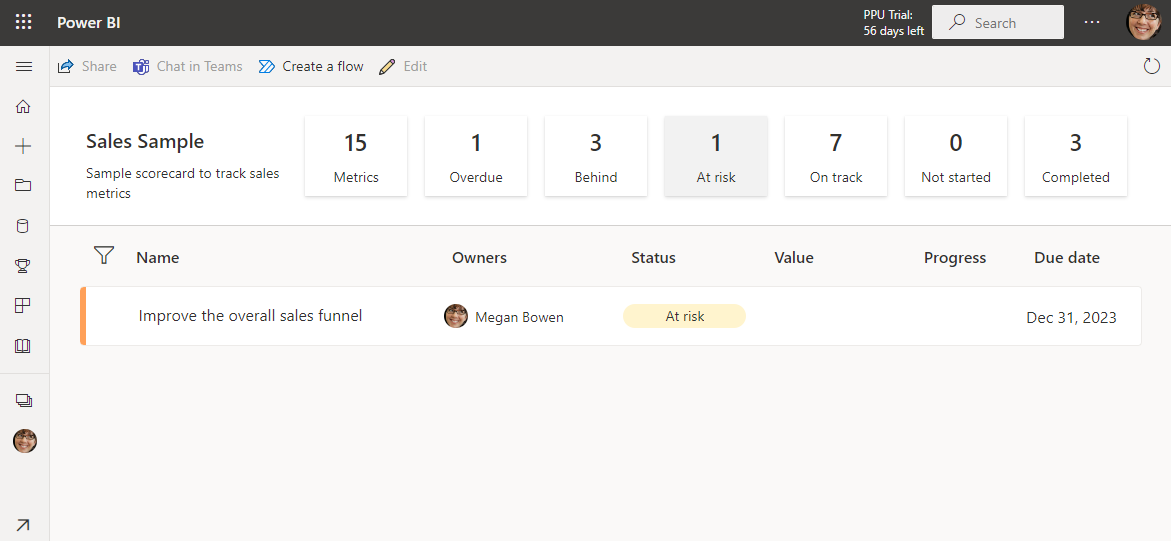
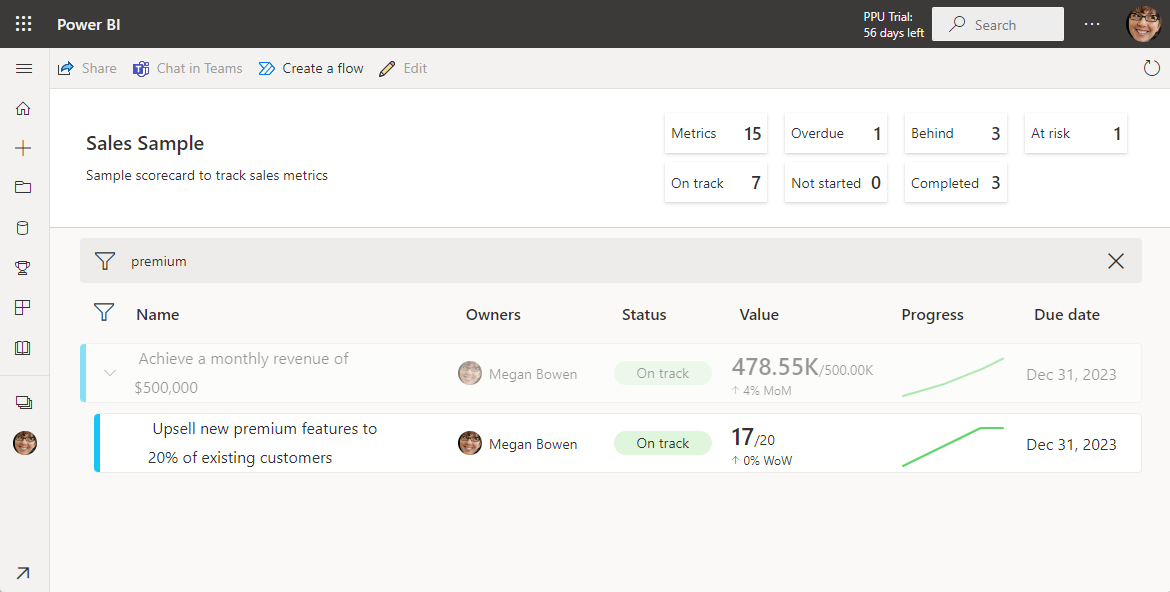
You can filter scorecards to goals labeled as a particular status. Selecting the summary cards at the top of the scorecard makes it easy to see what is on track or at risk.
This metric is at risk.
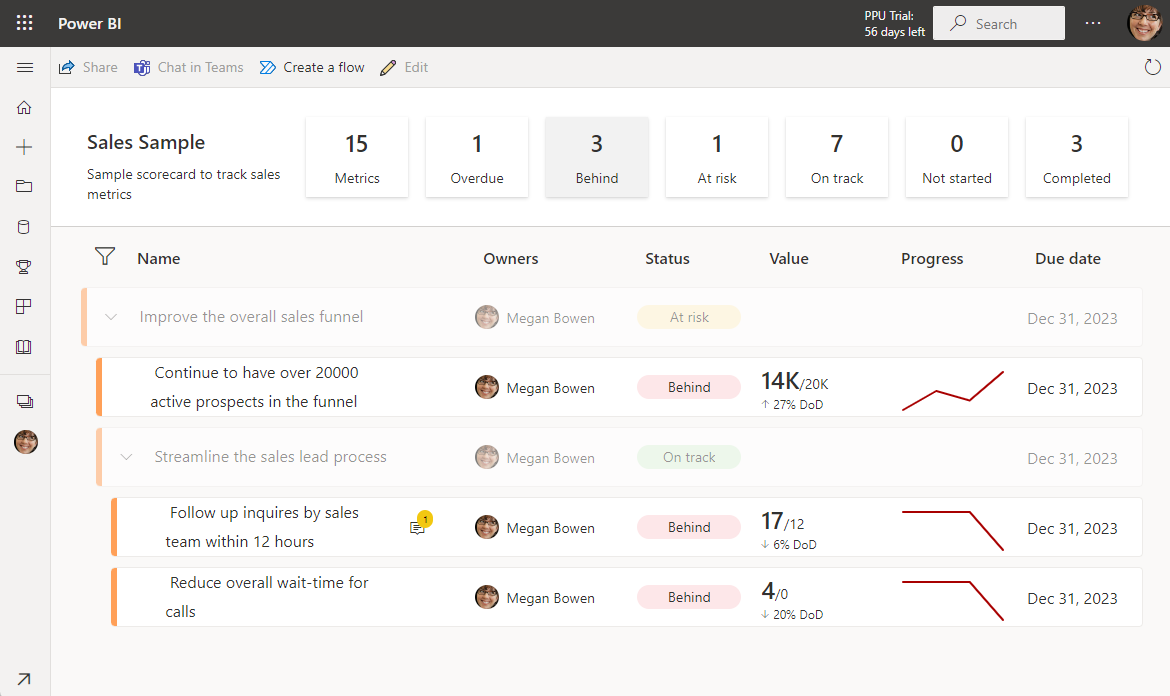
This metric is behind.
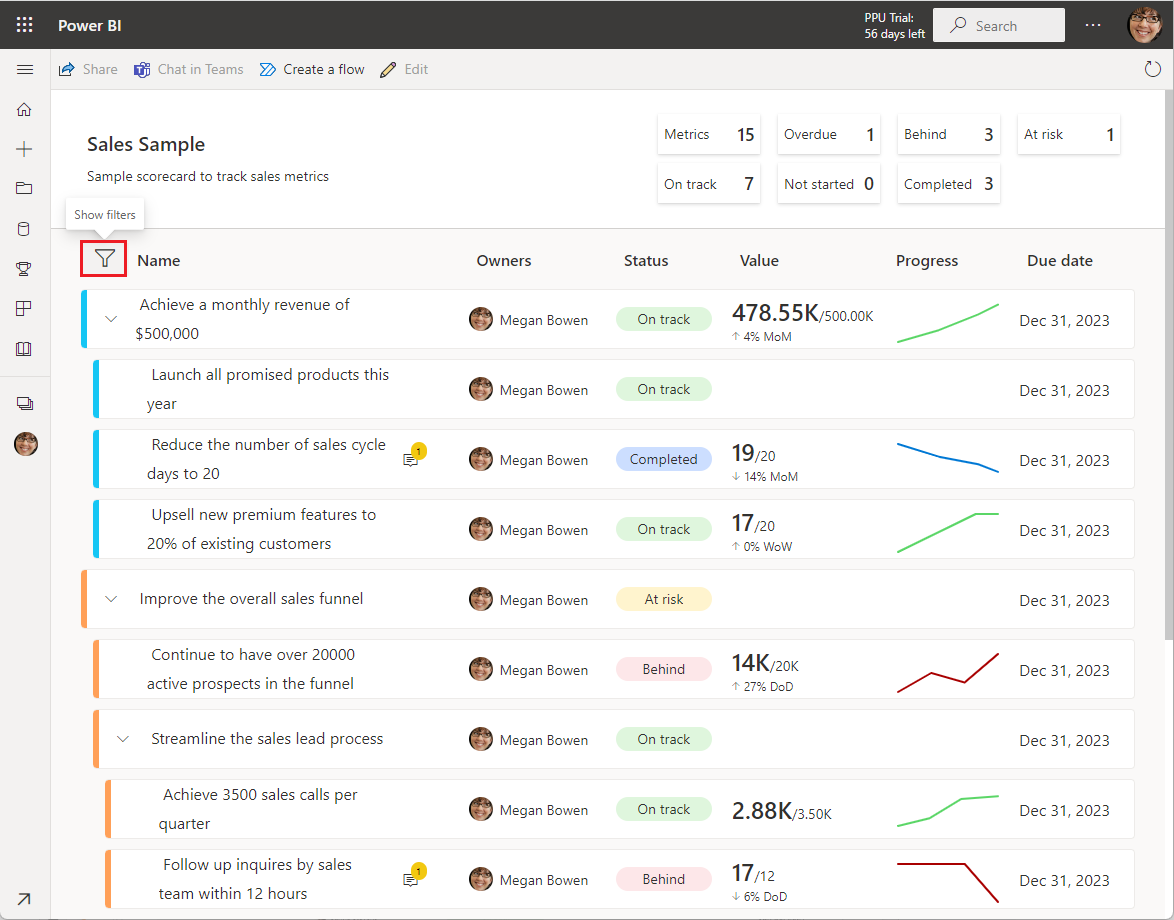
There's also a keyword search that filters the scorecard down to goals that match the keyword. Select the Filter icon above the first metric and type the keywords you're looking for. The scorecard filters to show those results, without losing the context of any parent/child metric relationships, making it easy to quickly find a particular metric and see how it's doing.
The scorecard before filtering.
The scorecard filtered to Premium.
Update manual values
In a scorecard, select the metric name.
In the Details pane, select New check-in.
Complete the following actions in any order:
Choose a date.
Enter a new or updated value.
Select a status.
Optionally, include a note.
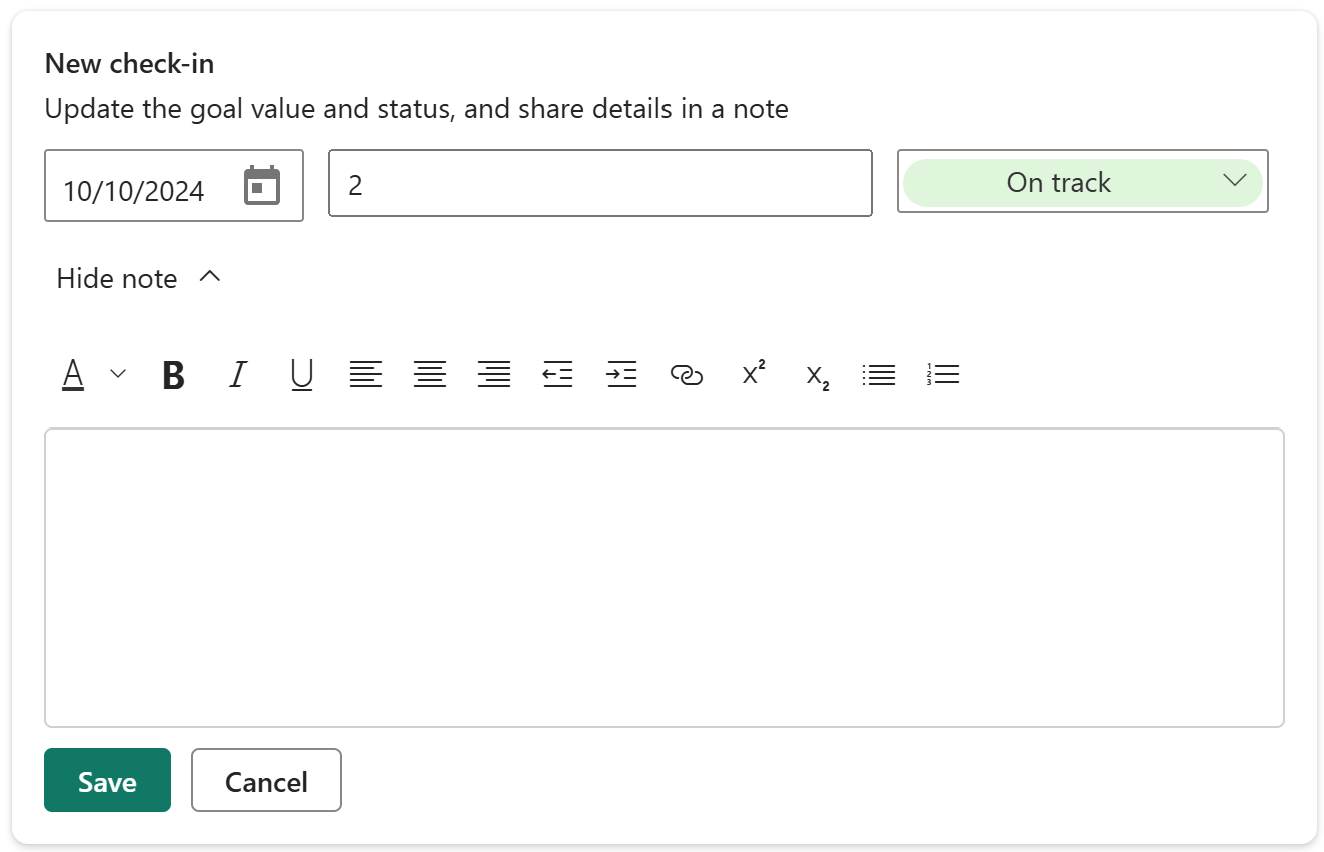
Select Save.
Update connected values
In a scorecard, select the metric name.
In the Details pane, select New check-in.
Complete the following actions in any order:
Choose a date. Choosing a date auto-populates the value for that day. You can't override a connected value.
Select a status.
Optionally, include a note.
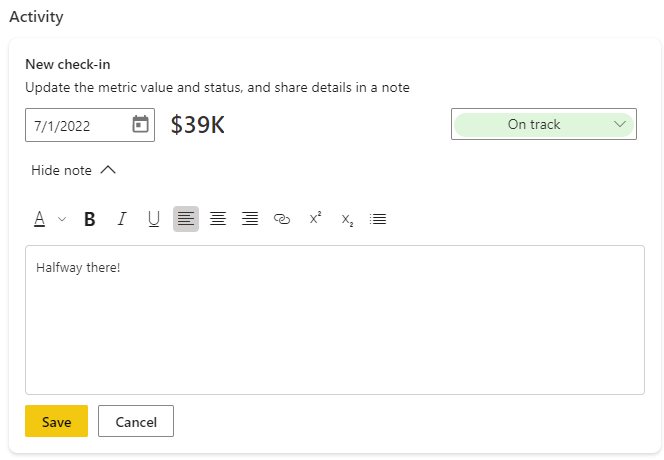
Select Save.
Related content
- Get started with goals in Power BI
- Create scorecards and manual goals in Power BI
- Create connected goals in Power BI
More questions? Try the Power BI Community.