View hierarchies in Power BI metrics
APPLIES TO: ![]() Power BI Desktop
Power BI Desktop ![]() Power BI service
Power BI service
Metrics support cascading scorecards that roll up along hierarchies you set up in your scorecard. You can view and interact with hierarchies in scorecards two different ways.
Scorecard list view
To view your hierarchical scorecard, you can use the slicer to navigate to whichever level of your hierarchy you want to view. From here you can do things like open the details pane, go to a report, and perform check-ins, just like any other scorecard view.

All connected values, mapped owners, and statuses dictated by rules will reflect the appropriate data at each hierarchy level, so long as the relationships exist. There needs to be a relationship between the hierarchy level fields in the underlying semantic models to correctly filter the values. Manual metrics will be indicated by an information icon showing which values are manual for that metric.
![]()
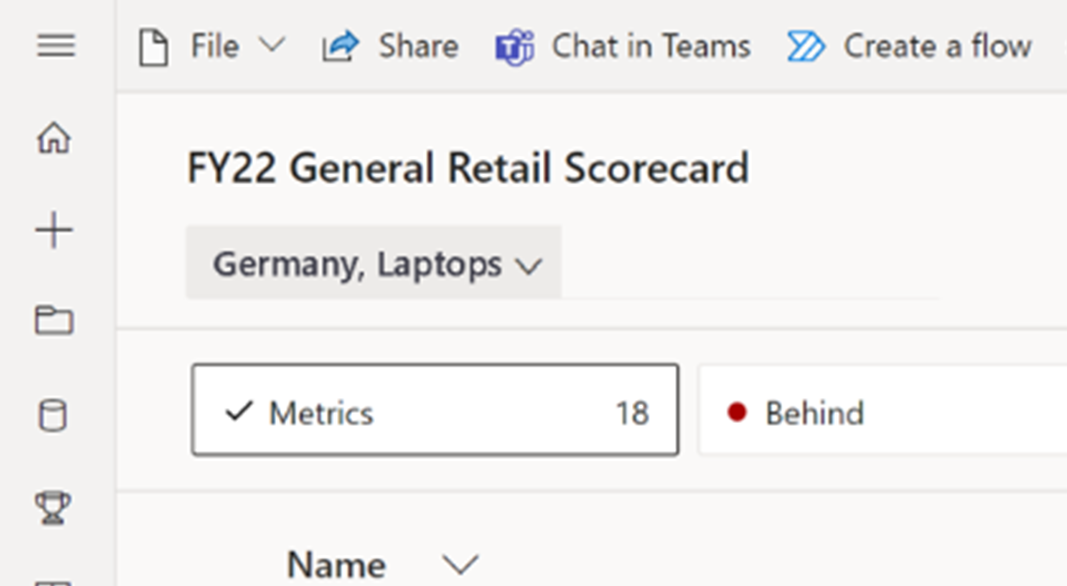
You can view intersections of multiple hierarchies. For example, you can look at a cross section between one selection from product, and one selection from the geography hierarchy, indicated in the slicer name as shown in the following images.

Here the header within a scorecard restates the two levels of the hierarchy that a user chose, Germany and Laptops.
Heatmap view
By selecting Heatmap from the view options, you can start to build a custom heatmap view that allows side by side comparison of different hierarchy levels. This experience is exposed in read mode, so consumers can also do their own exploration using the pane, showing and comparing different segments, though saving and sharing views aren't yet supported.

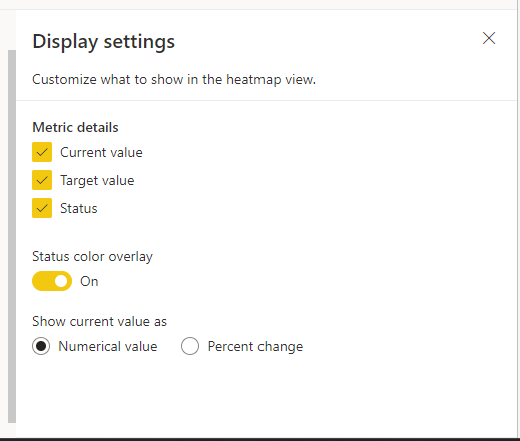
You can also customize what information to show in each metric box by selecting the slicer dropdown, then selecting Open display settings. This is a great view to use in business reviews.
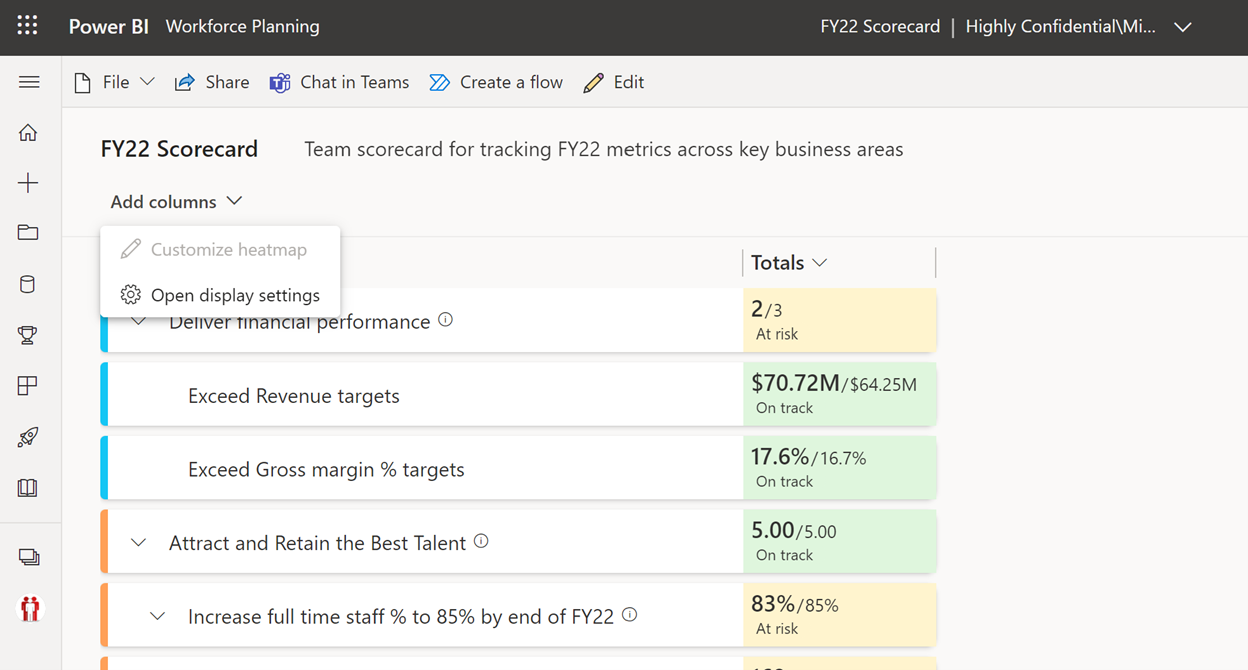
Customize the heatmap view in the Display settings dialog box.
Additional considerations for viewing a hierarchy
Premium or PPU workspace is required.
There are data limits on hierarchies:
- Up to 10,000 items per hierarchy (across all semantic models)
- Up to five hierarchies
- Up to five levels per hierarchy
Permissions can't be set at a hierarchy level – metric level permissions are set at the scorecard and applied to all hierarchy views.
Data connections are evaluated by impersonating the hierarchy owner/creator where row-level security (RLS) may apply. This does not change metric level permissions.
Dynamic and static RLS is supported but it is routed through the hierarchy creator. All scorecard viewers impersonate the hierarchy creator’s access.
Hierarchy permissions can't be set at a specific hierarchy level. Metric level permissions are inherited from the original scorecard and are applied at all levels, and RLS via the hierarchy creator dictate permissions.
Non-admin users may experience refresh issues when setting up hierarchies on a semantic model with dynamic RLS.
Manual metrics are indicated by an information icon showing which values are manual for that metric.
Notifications regarding status changes on child scorecard levels aren't triggered.
There is a limit of one selection per hierarchy for viewing a hierarchical scorecard.
History for hierarchical metrics isn't supported because data is always queried live from the semantic model, instead of cached when the semantic model refreshes.
Saving and sharing heatmap views isn't yet supported.