Note
Access to this page requires authorization. You can try signing in or changing directories.
Access to this page requires authorization. You can try changing directories.
This article targets IT professionals and IT managers. You'll learn about BI solution architecture in the COE and the different technologies employed. Technologies include Azure, Power BI, and Excel. Together, they can be leveraged to deliver a scalable and data-driven cloud BI platform.
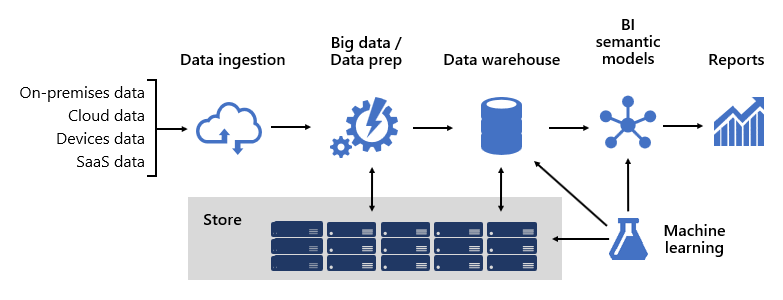
Designing a robust BI platform is somewhat like building a bridge; a bridge that connects transformed and enriched source data to data consumers. The design of such a complex structure requires an engineering mindset, though it can be one of the most creative and rewarding IT architectures you could design. In a large organization, a BI solution architecture can consist of:
- Data sources
- Data ingestion
- Big data / data preparation
- Data warehouse
- BI semantic models
- Reports

The platform must support specific demands. Specifically, it must scale and perform to meet the expectations of business services and data consumers. At the same time, it must be secure from the ground up. And, it must be sufficiently resilient to adapt to change—because it's a certainty that in time new data and subject areas must be brought online.
Frameworks
At Microsoft, from the outset we adopted a systems-like approach by investing in framework development. Technical and business process frameworks increase the reuse of design and logic and provide a consistent outcome. They also offer flexibility in architecture leveraging many technologies, and they streamline and reduce engineering overhead via repeatable processes.
We learned that well-designed frameworks increase visibility into data lineage, impact analysis, business logic maintenance, managing taxonomy, and streamlining governance. Also, development became faster and collaboration across large teams became more responsive and effective.
We'll describe several of our frameworks in this article.
Data models
Data models provide you with control over how data is structured and accessed. To business services and data consumers, data models are their interface with the BI platform.
A BI platform can deliver three different types of models:
- Enterprise models
- BI semantic models
- Machine Learning (ML) models
Enterprise models
Enterprise models are built and maintained by IT architects. They're sometimes referred to as dimensional models or data marts. Typically, data is stored in relational format as dimension and fact tables. These tables store cleansed and enriched data consolidated from many systems and they represent an authoritative source for reporting and analytics.
Enterprise models deliver a consistent and single source of data for reporting and BI. They're built once and shared as a corporate standard. Governance policies ensure data is secure, so access to sensitive data sets—such as customer information or financials—is restricted on a needs-basis. They adopt naming conventions ensuring consistency, thereby further establishing credibility of data and quality.
In a cloud BI platform, enterprise models can be deployed to a Synapse SQL pool in Azure Synapse. The Synapse SQL pool then becomes the single version of truth the organization can count on for fast and robust insights.
BI semantic models
BI semantic models represent a semantic layer over enterprise models. They're built and maintained by BI developers and business users. BI developers create core BI semantic models that source data from enterprise models. Business users can create smaller-scale, independent models—or, they can extend core BI semantic models with departmental or external sources. BI semantic models commonly focus on a single subject area, and are often widely shared.
Business capabilities are enabled not by data alone, but by BI semantic models that describe concepts, relationships, rules, and standards. This way, they represent intuitive and easy-to-understand structures that define data relationships and encapsulate business rules as calculations. They can also enforce fine-grained data permissions, ensuring the right people have access to the right data. Importantly, they accelerate query performance, providing extremely responsive interactive analytics—even over terabytes of data. Like enterprise models, BI semantic models adopt naming conventions ensuring consistency.
In a cloud BI platform, BI developers can deploy BI semantic models to Azure Analysis Services, Power BI Premium capacities of Microsoft Fabric capacities.
Important
This article refers to Power BI Premium or its capacity subscriptions (P SKUs). Currently, Microsoft is consolidating purchase options and retiring the Power BI Premium per-capacity SKUs. New and existing customers should consider purchasing Fabric capacity subscriptions (F SKUs) instead.
For more information, see Important update coming to Power BI Premium licensing and Power BI Premium FAQ.
We recommend deploying to Power BI when it's used as your reporting and analytics layer. These products support different storage modes, allowing data model tables to cache their data or to use DirectQuery, which is a technology that passes queries through to the underlying data source. DirectQuery is an ideal storage mode when model tables represent large data volumes or there's a need to deliver near-real time results. The two storage modes can be combined: Composite models combine tables that use different storage modes in a single model.
For heavily queried models, Azure Load Balancer can be used to evenly distribute the query load across model replicas. It also allows you to scale your applications and create highly available BI semantic models.
Machine Learning models
Machine Learning (ML) models are built and maintained by data scientists. They're mostly developed from raw sources in the data lake.
Trained ML models can reveal patterns within your data. In many circumstances, those patterns can be used to make predictions that can be used to enrich data. For example, purchasing behavior can be used to predict customer churn or segment customers. Prediction results can be added to enterprise models to allow analysis by customer segment.
In a cloud BI platform, you can use Azure Machine Learning to train, deploy, automate, manage, and track ML models.
Data warehouse
Sitting at the heart of a BI platform is the data warehouse, which hosts your enterprise models. It's a source of sanctioned data—as a system of record and as a hub—serving enterprise models for reporting, BI, and data science.
Many business services, including line-of-business (LOB) applications, can rely upon the data warehouse as an authoritative and governed source of enterprise knowledge.
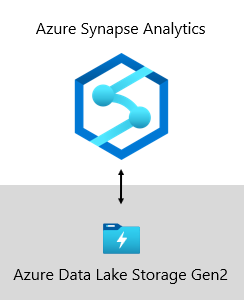
At Microsoft, our data warehouse is hosted on Azure Data Lake Storage Gen2 (ADLS Gen2) and Azure Synapse Analytics.

- ADLS Gen2 makes Azure Storage the foundation for building enterprise data lakes on Azure. It's designed to service multiple petabytes of information while sustaining hundreds of gigabits of throughput. And, it offers low-cost storage capacity and transactions. What's more, it supports Hadoop compatible access, which allows you to manage and access data just as you would with a Hadoop Distributed File System (HDFS). In fact, Azure HDInsight, Azure Databricks, and Azure Synapse Analytics can all access data stored in ADLS Gen2. So, in a BI platform, it's a good choice to store raw source data, semi-processed or staged data, and production-ready data. We use it to store all our business data.
- Azure Synapse Analytics is an analytics service that brings together enterprise data warehousing and Big Data analytics. It gives you the freedom to query data on your terms, using either serverless on-demand or provisioned resources—at scale. Synapse SQL, a component of Azure Synapse Analytics, supports complete T-SQL-based analytics, so it's ideal to host enterprise models comprising your dimension and fact tables. Tables can be efficiently loaded from ADLS Gen2 using simple Polybase T-SQL queries. You then have the power of MPP to run high-performance analytics.
Business Rules Engine framework
We developed a Business Rules Engine (BRE) framework to catalog any business logic that can be implemented in the data warehouse layer. A BRE can mean many things, but in the context of a data warehouse it's useful for creating calculated columns in relational tables. These calculated columns are usually represented as mathematical calculations or expressions using conditional statements.
The intention is to split business logic from core BI code. Traditionally, business rules are hard-coded into SQL stored procedures, so it often results in much effort to maintain them when business needs change. In a BRE, business rules are defined once and used multiple times when applied to different data warehouse entities. If calculation logic needs to change, it only needs to be updated in one place and not in numerous stored procedures. There's a side benefit, too: a BRE framework drives transparency and visibility into implemented business logic, which can be exposed via a set of reports that create self-updating documentation.
Data sources
A data warehouse can consolidate data from practically any data source. It's mostly built over LOB data sources, which are commonly relational databases storing subject-specific data for sales, marketing, finance, etc. These databases can be cloud-hosted or they can reside on-premises. Other data sources can be file-based, especially web logs or IOT data sourced from devices. What's more, data can be sourced from Software-as-a-Service (SaaS) vendors.
At Microsoft, some of our internal systems output operational data direct to ADLS Gen2 using raw file formats. In addition to our data lake, other source systems comprise relational LOB applications, Excel workbooks, other file-based sources, and Master Data Management (MDM) and custom data repositories. MDM repositories allow us to manage our master data to ensure authoritative, standardized, and validated versions of data.
Data ingestion
On a periodic basis, and according to the rhythms of the business, data is ingested from source systems and loaded into the data warehouse. It could be once a day or at more frequent intervals. Data ingestion is concerned with extracting, transforming, and loading data. Or, perhaps the other way round: extracting, loading, and then transforming data. The difference comes down to where the transformation takes place. Transformations are applied to cleanse, conform, integrate, and standardize data. For more information, see Extract, transform, and load (ETL).
Ultimately, the goal is to load the right data into your enterprise model as quickly and efficiently as possible.
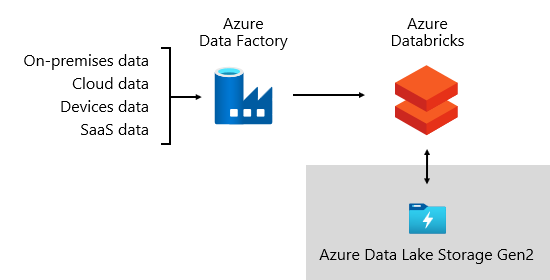
At Microsoft, we use Azure Data Factory (ADF). The services is used to schedule and orchestrate data validations, transformations, and bulk loads from external source systems into our data lake. It's managed by custom frameworks to process data in parallel and at scale. In addition, comprehensive logging is undertaken to support troubleshooting, performance monitoring, and to trigger alert notifications when specific conditions are met.
Meanwhile, Azure Databricks—an Apache Spark-based analytics platforms optimized for the Azure cloud services platform—performs transformations specifically for data science. It also builds and executes ML models using Python notebooks. Scores from these ML models are loaded into the data warehouse to integrate predictions with enterprise applications and reports. Because Azure Databricks accesses the data lake files directly, it eliminates or minimizes the need to copy or acquire data.

Ingestion framework
We developed an ingestion framework as a set of configuration tables and procedures. It supports a data-driven approach to acquiring large volumes of data at high speed and with minimal code. In short, this framework simplifies the process of data acquisition to load the data warehouse.
The framework depends on configuration tables that store data source and data destination-related information such as source type, server, database, schema, and table-related details. This design approach means we don't need to develop specific ADF pipelines or SQL Server Integration Services (SSIS) packages. Instead, procedures are written in the language of our choice to create ADF pipelines that are dynamically generated and executed at run time. So, data acquisition becomes a configuration exercise that's easily operationalized. Traditionally, it would require extensive development resources to create hard-coded ADF or SSIS packages.
The ingestion framework was designed to simplify the process of handling upstream source schema changes, too. It's easy to update configuration data—manually or automatically, when schema changes are detected to acquire newly added attributes in the source system.
Orchestration framework
We developed an orchestration framework to operationalize and orchestrate our data pipelines. The orchestration framework uses a data-driven design that depends on a set of configuration tables. These tables store metadata describing pipeline dependencies and how to map source data to target data structures. The investment in developing this adaptive framework has since paid for itself; there's no longer a requirement to hard-code each data movement.
Data storage
A data lake can store large volumes of raw data for later use along with staging data transformations.
At Microsoft, we use ADLS Gen2 as our single source of truth. It stores raw data alongside staged data and production-ready data. It provides a highly scalable and cost-effective data lake solution for big data analytics. Combining the power of a high-performance file system with massive scale, it's optimized for data analytic workloads, accelerating time to insight.
ADLS Gen2 provides the best of two worlds: it's BLOB storage and a high-performance file system namespace, which we configure with fine-grained access permissions.
Refined data is then stored in a relational database to deliver a high-performance, highly scalable data store for enterprise models, with security, governance, and manageability. Subject-specific data marts are stored in Azure Synapse Analytics, which are loaded by Azure Databricks or Polybase T-SQL queries.
Data consumption
At the reporting layer, business services consume enterprise data sourced from the data warehouse. They also access data directly in the data lake for ad hoc analysis or data science tasks.
Fine-grained permissions are enforced at all layers: in the data lake, enterprise models, and BI semantic models. The permissions ensure data consumers can only see the data they have rights to access.
At Microsoft, we use Power BI reports and dashboards, and Power BI paginated reports. Some reporting and ad hoc analysis is done in Excel—particularly for financial reporting.
We publish data dictionaries, which provide reference information about our data models. They're made available to our users so they can discover information about our BI platform. Dictionaries document model designs, providing descriptions about entities, formats, structure, data lineage, relationships, and calculations. We use Azure Data Catalog to make our data sources easily discoverable and understandable.
Typically, data consumption patterns differ based on role:
- Data analysts connect directly to core BI semantic models. When core BI semantic models contain all data and logic they need, they use live connections to create Power BI reports and dashboards. When they need to extend the models with departmental data, they create Power BI composite models. If there's a need for spreadsheet-style reports, they use Excel to produce reports based on core BI semantic models or departmental BI semantic models.
- BI developers and operational report authors connect directly to enterprise models. They use Power BI Desktop to create live connection analytic reports. They can also author operational-type BI reports as Power BI paginated reports, writing native SQL queries to access data from the Azure Synapse Analytics enterprise models by using T-SQL, or Power BI semantic models by using DAX or MDX.
- Data scientists connect directly to data in the data lake. They use Azure Databricks and Python notebooks to develop ML models, which are often experimental and require specialty skills for production use.

Related content
For more information about this article, check out the following resources:
- Fabric adoption roadmap: Center of Excellence
- Enterprise BI in Azure with Azure Synapse Analytics
- Questions? Try asking the Fabric Community
- Suggestions? Contribute ideas to improve Fabric
Professional services
Certified Power BI partners are available to help your organization succeed when setting up a COE. They can provide you with cost-effective training or an audit of your data. To find a Power BI partner, visit the Microsoft Power BI partners portal.
You can also engage with experienced consulting partners. They can help you assess, evaluate, or implement Power BI.