Note
Access to this page requires authorization. You can try signing in or changing directories.
Access to this page requires authorization. You can try changing directories.
APPLIES TO: ![]() Power BI Desktop
Power BI Desktop ![]() Power BI service
Power BI service
Important
Q&A experiences are going away in December 2026. We recommend using Copilot for Power BI, which offers a more advanced and integrated way to query your data using natural language. For more details and recommended alternatives, see Deprecating Power BI Q&A.
Q&A is available throughout Power BI, and this article focuses on using Q&A on a dashboard. We import a sample and use Q&A to explore our data and pin interesting findings to our dashboard.
Prerequisites
Read the Q&A intro article Q&A for Power BI business users.
Sign up for a free or trial license for the Power BI service.
Open the Power BI service in a browser.
Import the sample in the Power BI service
Open the Power BI service (
app.powerbi.com), and select Learn in the left navigation pane.On the Learning center page, under Sample reports, scroll until you see the Retail Analysis Sample.
Select the sample. It opens in Reading mode.
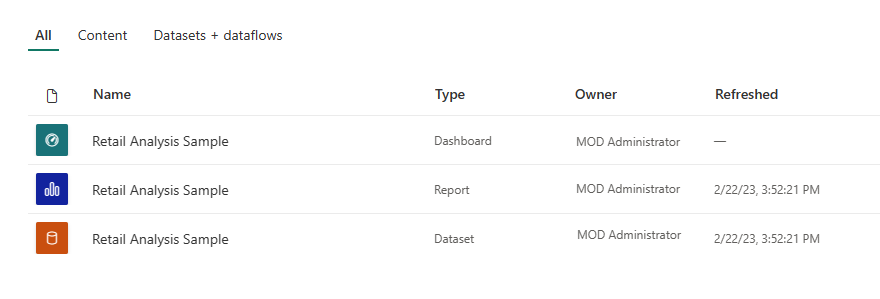
Select My workspace in the left navigation pane and scroll until you find the Retail Analysis sample. Power BI imports the built-in sample, adding a new dashboard, report, and semantic model to the current Retail Analysis workspace.

Get started using Q&A on a dashboard
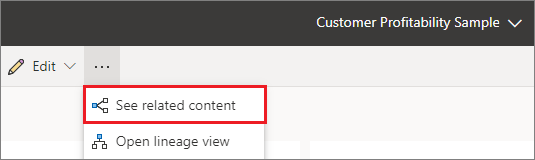
In the Power BI service (app.powerbi.com), a dashboard contains tiles pinned from one or more semantic models, so you can ask questions about any of the data contained in any of those semantic models. To see what reports and semantic models were used to create the dashboard, select More options (...) from the menu bar, and then choose See related content.
When you type a question, Power BI looks for the best answer using any semantic model that has a tile on that dashboard. If all the tiles are from semantic modelA, then your answer comes from semantic modelA. If there are tiles from semantic modelA and semantic modelB, then Q&A searches for the best answer from those two semantic models.
Tip
Be careful. If you only have one tile from semantic modelA and you remove it from your dashboard, Q&A will no longer have access to semantic modelA.
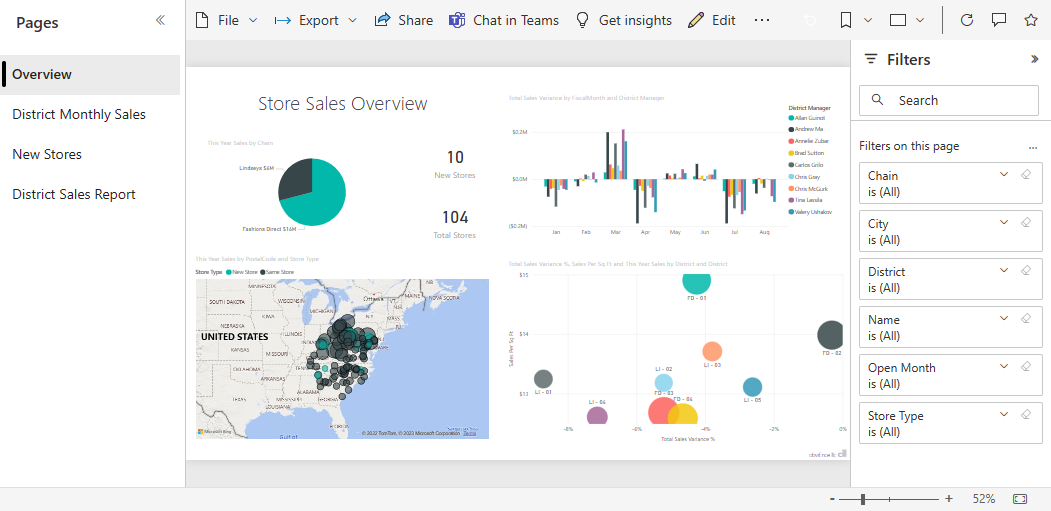
In our example, most of the tiles on this dashboard are from the Retail analysis sample. To help form your questions, get familiar with the Retail analysis sample content. Take a look at the visuals on the dashboard and in the report. Get a feel for the type and range of data that is available to you. Optionally, read the article that describes the sample, Retail Analysis sample for Power BI: Take a tour.
Note
If you already feel comfortable with the data, just place your cursor in the question box to open the Q&A screen.
For example:
If a visual's axis labels and values include "sales", "account", "month", and "opportunities", then you can confidently ask questions such as: "Which account has the highest opportunity" or "show sales by month as a bar chart."
If your semantic model has website performance data for Google Analytics, you can ask Q&A about time spent on a web page, number of unique page visits, and user engagement rates. Or, if you're querying demographic data, you might ask questions about age and household income by location.
Once you're familiar with the data, head back to the dashboard and place your cursor in the question box. The Q&A screen opens.

Don't see the Q&A box? See Considerations and limitations in the Q&A for for Power BI business users article.
Use Q&A on a dashboard in the Power BI service
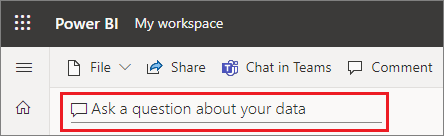
The Q&A field is where you type your question using natural language. The Q&A field is in the upper-left corner of your dashboard. Q&A recognizes the words you type and figures out where, and in which semantic model, to find the answer. Q&A also helps you form your question with autocompletion, restatement, and other textual and visual aids.
Let's try it out.
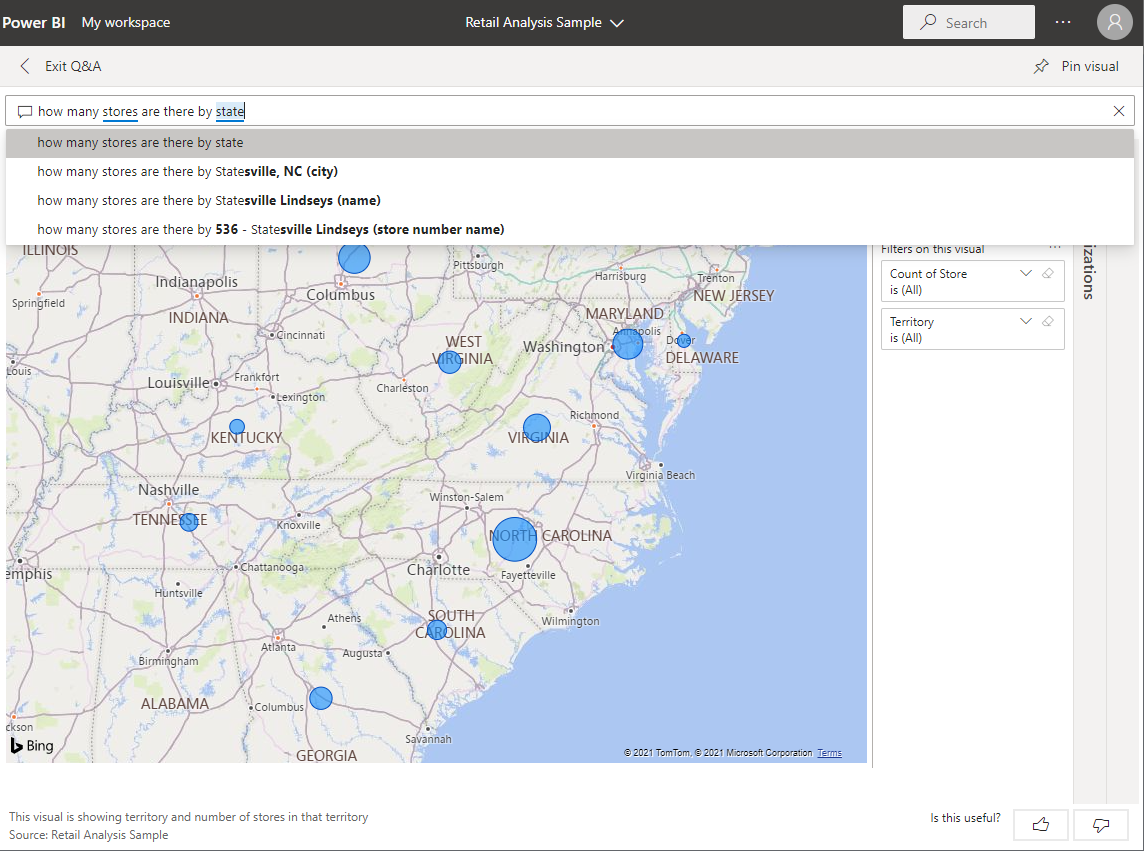
Create a visual using the Q&A field on a dashboard
Open a dashboard and place your cursor in the Q&A field.
Even before you start typing, Q&A displays a new screen with suggestions to help you form your question. You see phrases and complete questions containing the names of the tables in the underlying semantic models. And, you might even see complete questions listed if the semantic model owner created featured questions.
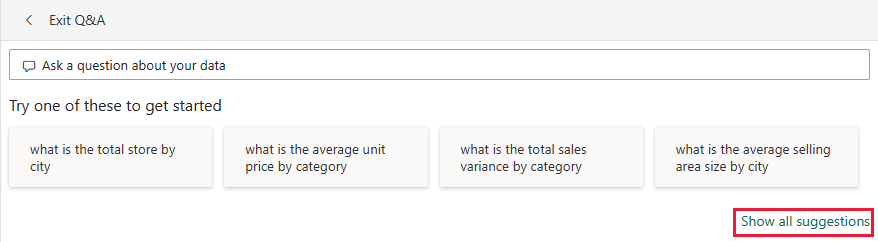
You can select any of these options to add them to the question box and then refine the question to find a specific answer.
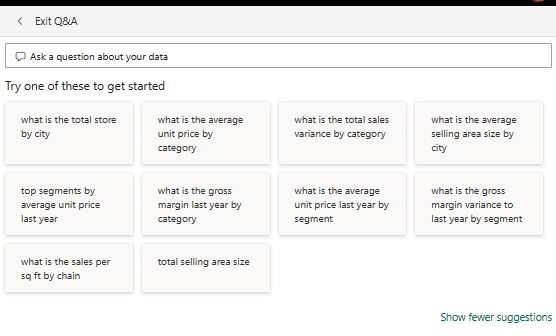
If you're unsure what type of questions to ask or terminology to use, expand Show all suggestions or look through the other visuals in the report. These techniques get you familiar with the terms and content of the semantic model.
Choose one of these questions as a starting point or begin typing your own question and select from the dropdown suggestions.
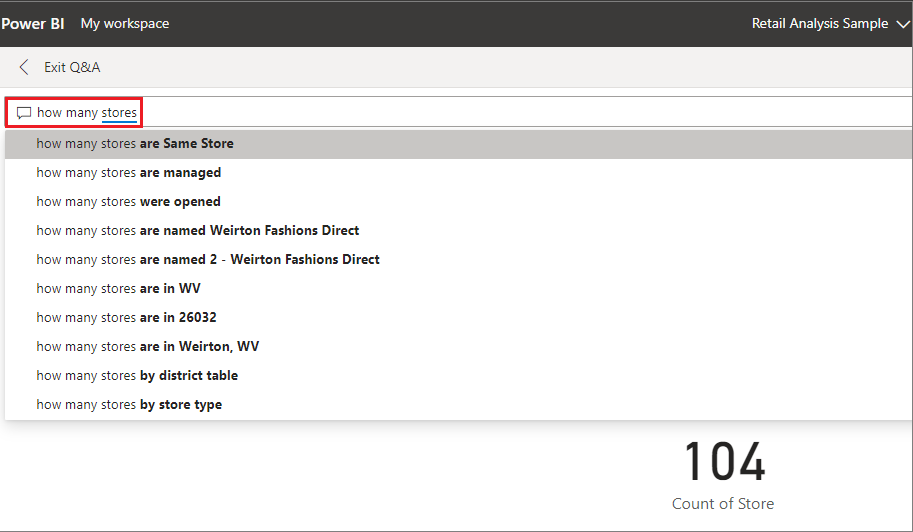
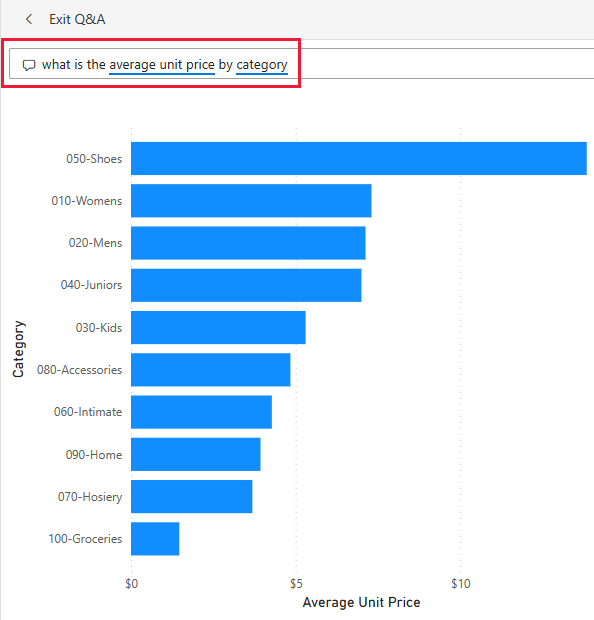
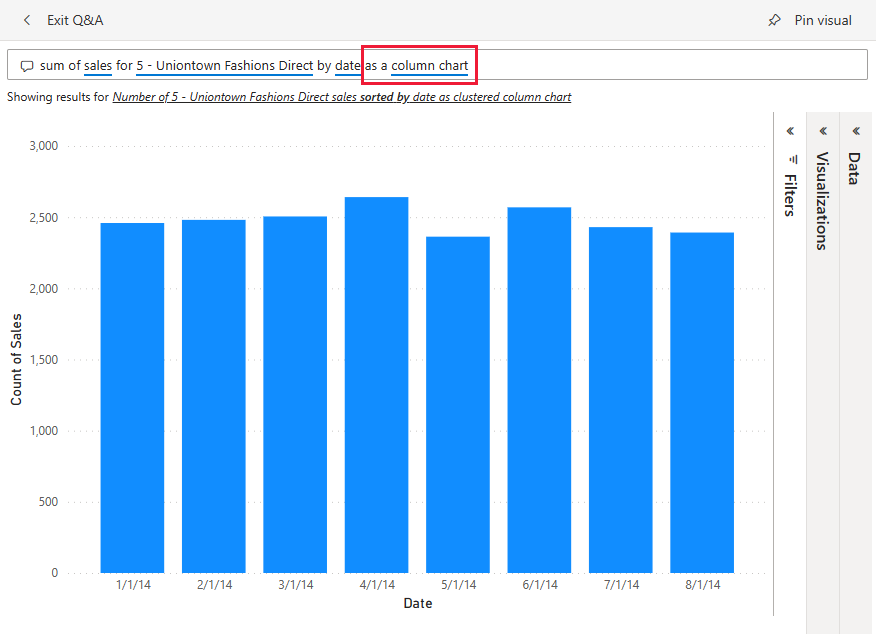
As you type a question, Power BI helps you with autocomplete, visual cues, restatement, and feedback. Power BI also picks the best visualization to display your answer.
The visualization changes dynamically as you modify the question.
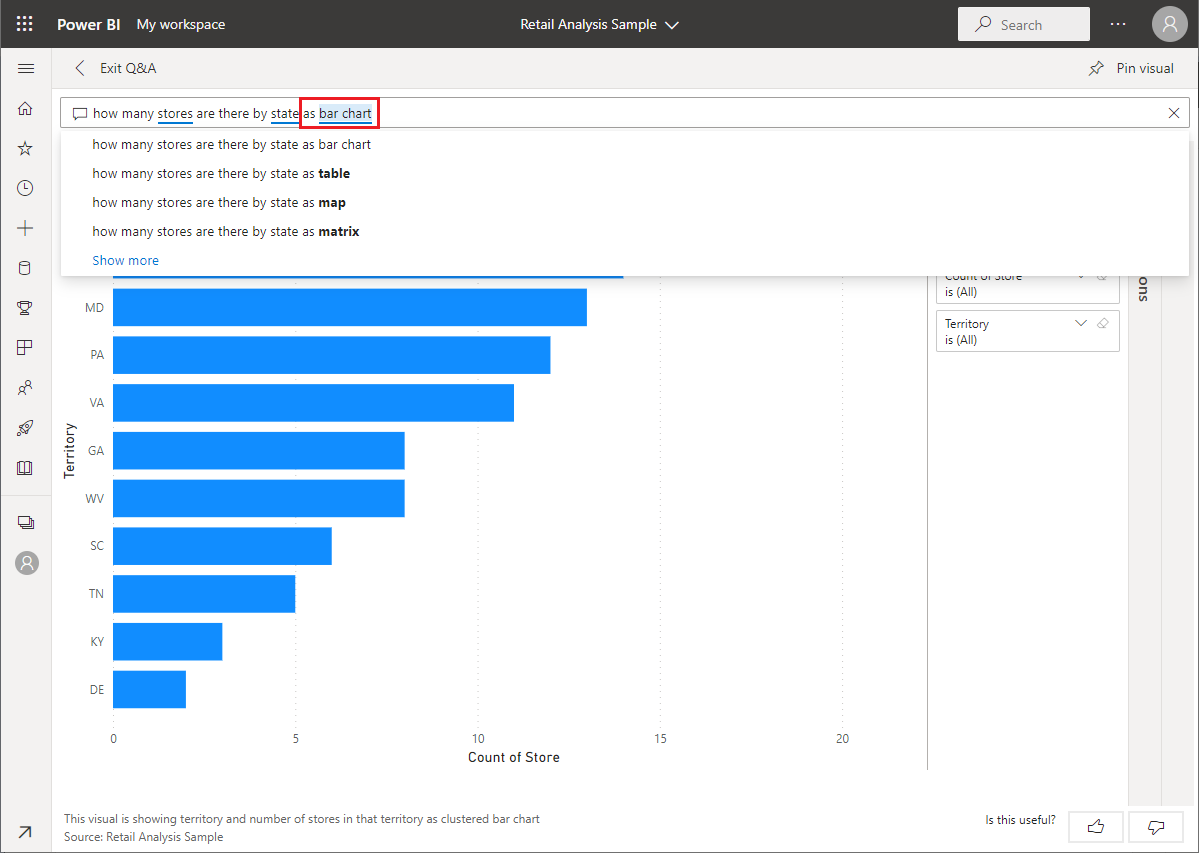
Don't like the default visualization that Power BI Q&A chose? Edit the natural language question to include the visualization type that you'd prefer.
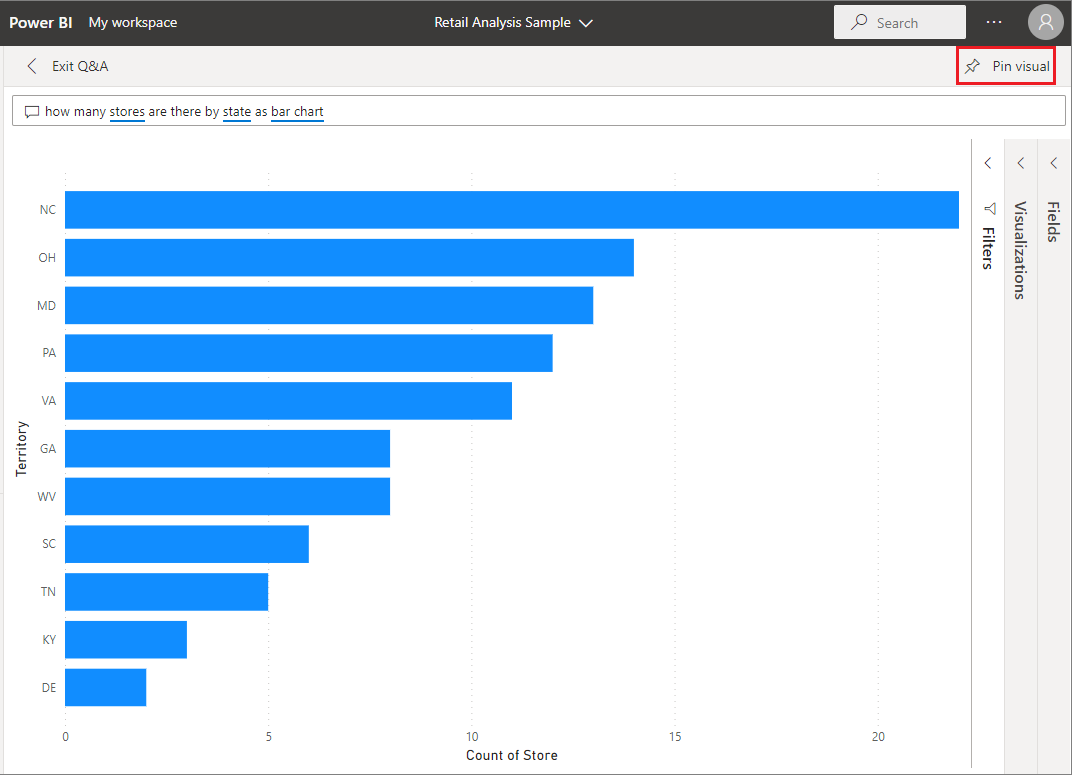
When you're happy with the result, pin the visualization to a dashboard by selecting the pin icon in the top right corner. If the dashboard was shared with you, or is part of an app, you might not be able to pin.
Considerations and limitations
If you connected to a semantic model using a live connection or gateway, Q&A needs to be enabled for that semantic model.
At the current time, Power BI Q&A only supports answering natural language queries asked in English. There's a preview available for Spanish that your Power BI administrator can enable.