View diagnostics for Power BI paginated reports
APPLIES TO: ![]() Power BI service
Power BI service ![]() Power BI Report Builder
Power BI Report Builder ![]() Power BI Desktop
Power BI Desktop
In this article, you learn how to view, read, and use the diagnostics feature of a paginated report rendered in the Power BI service. Diagnostics data provides report viewers with the ability to read displayed data on performance metrics and rendering.
Any user with at least a Contributor role in a workspace can use this feature. Read more about workspace roles.
View diagnostics
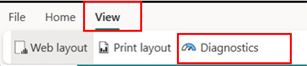
On the View menu for a paginated report, select Diagnostics.
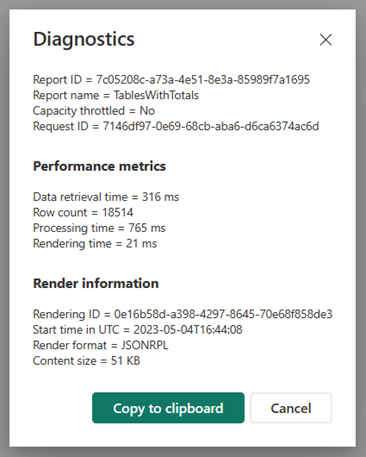
When you select the diagnostics button the dialog box appears.
Diagnostics data that's captured
The following table describes the data that's captured in the diagnostics dialog.
| Property | Description |
|---|---|
| Report ID | Paginated Report internal object ID. |
| Report Name | The name of the paginated report rendered. |
| Capacity Throttled | Each capacity consists of a defined number of v-cores. The CPU time measured in utilization records reflects the v-cores' utilization, and that utilization determines if the workload exceeds the available resources. This value is displayed as either yes or no. For additional information, see Power BI Premium capacity load, overload, and autoscale - Power BI. |
| Request ID | Paginated Report internal object ID. |
| Data Retrieval time | Number of milliseconds (ms) spent retrieving the data from its source. |
| Row Count | Number of rows returned from queries. |
| Processing Time | Number of milliseconds (ms) spent processing the report. |
| Rendering Time | Number of milliseconds (ms) spent rendering the report. |
| Rendering ID | Paginated Render and ProcessParameters IDs can be used to correlate the OperationName in the Microsoft Fabric Capacity Metrics app. |
| Start Time in UTC | Start time in UTC indicates the duration of a report process. It can be used in conjunction with the rendering ID (OperationName) start and end time in the Microsoft Fabric Capacity Metrics app.. |
| Render Format | JSONRPL, PDF, XLSX |
| Content Size | Size of rendered reports in kilobytes (kb). |
Considerations and limitations
This feature isn't available in Power BI apps or in the paginated report visual. It's designed for report authors to view performance data coming from a paginated report in the Power BI service.
Next steps
View a paginated report in the Power BI service
More questions? Try the Power BI Community.
Feedback
Coming soon: Throughout 2024 we will be phasing out GitHub Issues as the feedback mechanism for content and replacing it with a new feedback system. For more information see: https://aka.ms/ContentUserFeedback.
Submit and view feedback for