Note
Access to this page requires authorization. You can try signing in or changing directories.
Access to this page requires authorization. You can try changing directories.
Website administrators and developers use Power Pages to create websites for their customers. Developers often debug issues while developing the website. To help debug, you can access detailed error logs for any issues on your website. There are multiple ways that you can get error logs for your website.
Tip
To learn about the roles required to perform tasks in this article, read Admin roles required for portal administrative tasks.
Custom error
If any server-side exception occurs on your website, a customized error page with a user-friendly error message is shown by default. To configure the error message, see Display a custom error message.
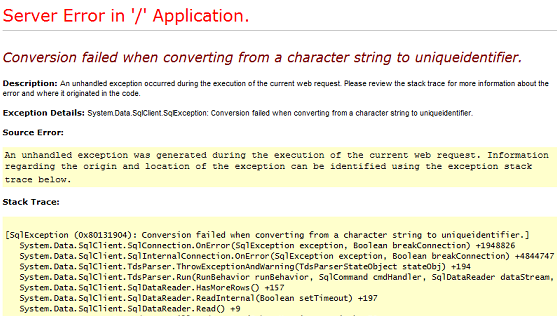
However, it's better to see the ASP.NET detailed error page, also known as Yellow Screen of Death (YSOD), for debugging purposes. The detailed error page helps you to get the full stack of server errors.

To enable YSOD, you need to disable custom errors on your website.
Note
- It is advisable to only disable custom errors when you are in the development phase and enable custom errors once you go live.
- Custom errors are consistently shown on the private site and can't be turned off.
More information on custom error: Displaying a Custom Error Page
Disable custom error
You can disable custom errors on Power Pages websites to display the detailed exception message if any server-side exception occurs in your website.
Open the Power Platform admin center.
Under the Resources section, select Power Pages sites.
Select your website.
From the Site Actions menu, select Disable custom errors.
Select Disable in the confirmation message. While custom errors are being disabled, the website restarts and is temporarily unavailable.
Enable custom error
You can enable custom errors on websites to display a professional-looking page instead of YSOD. This page provides meaningful information if any exception occurs in the application.
Open the Power Platform admin center.
Under the Resources section, select Power Pages sites.
Select your website.
From the Site Actions menu, select Enable custom errors.
Select Enable in the confirmation message. While custom errors are being enabled, the website restarts and is temporarily unavailable.
Note
- If you change the instance that your website is connected to, the custom errors setting is set to enabled. You must disable the custom errors again, if required.
- You must not enable or disable custom errors when the instance that your website is connected to is being changed; otherwise an error message appears.
Display a custom error message
You can configure your website to display a professional-looking custom error instead of a generic error.
To define a custom error, use the content snippet Portal Generic Error. The content defined in this snippet is shown on the error page. This content snippet isn't available out-of-the-box and you must create it. The content snippet Type can be Text or HTML. To create or edit the content snippet, see Customize content by using content snippets.
Note
If liquid code is written in the content snippet, it will be skipped and not rendered.
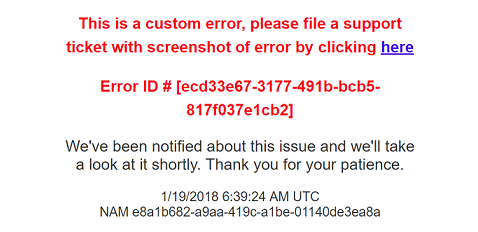
When you enable custom errors, the message appears in the following structure on the error page:
<Content Snippet>
<Error ID >
<Date and time>
<Portal ID>
The following message is an example of a custom error message, using a content snippet of type HTML:
This is a custom error, file a support ticket with screenshot of error by clicking here

Note
If the website cannot retrieve a content snippet because it can't connect to Microsoft Dataverse or if the snippet is not available in Dataverse, an error message appears.
Access website error logs
After developing and publishing the website, you still need to be able to access website logs to debug issues reported by your users. To access the logs, configure your website to send all application errors to an Azure Blob storage account that you own. By accessing website error logs, you can respond to user queries efficiently because you have details of the issue. To get the website error logs into your Azure Blob storage, you must enable diagnostic logging from the Power Platform admin center.
Note
If you change the Dataverse instance that your website is connected to, diagnostic logging is disabled. You must enable diagnostic logging again.
Enable diagnostic logging
Open the Power Platform admin center.
Under the Resources section, select Power Pages sites.
Select your website.
From the Site Actions menu, select Enable diagnostics logs.
A side panel appears titled Enable diagnostic logging, enter the following values:
Select retention period: Duration to keep the portal error logs in blob storage. The error logs are deleted after the selected duration. You can select one of the following values:
One day
Seven days
30 days
60 days
90 days
180 days
Always
By default, the retention period is 30 days.
Note
The UI currently displays only the default retention period of 30 days. Changes to the retention period are not reflected in the UI.
Connection String of Azure Blob Storage service: URL of the Azure Blob Storage service to store the website error logs. The maximum length of the URL is 2,048 characters. If the URL is longer than 2,048 characters, an error message appears. More information on connection string: Configure Azure Storage connection strings
Select Enable.
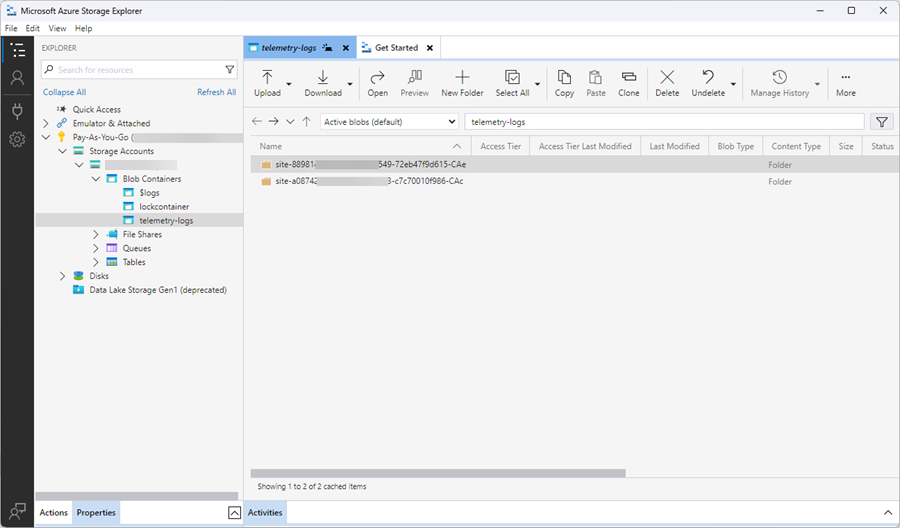
Once diagnostic logging is configured, a new telemetry-logs blob container is created in your Azure storage account, and the logs are written into the blob files stored in the container. The following screenshot shows the telemetry-logs blob container in Azure Storage Explorer:

When diagnostic logging is enabled successfully, the following actions become available from the Site Actions menu:
- Disable diagnostic logging: Allows you to disable diagnostic logging configuration for the portal.
- Update diagnostic logging configuration: Allows you to update or remove diagnostic logging configuration for the portal.
Update diagnostic logging
Open the Power Platform admin center.
Under the Resources section, select Power Pages sites.
Select your website.
From the Site Actions menu, select Update diagnostic logging configuration.
In the Update diagnostic logging configuration panel, enter the following values:
Do you want to update the Connection string of the Azure Blob Storage service?: Allows you to specify whether to update the connection string of the Azure Blob Storage service. This option isn't selected by default.
Select retention period: Duration to keep the website error logs in blob storage. The error logs are deleted after the selected duration. You can select one of the following values:
- One day
- Seven days
- 30 days
- 60 days
- 90 days
- 180 days
- Always
By default, the retention period is 30 days.
Connection String of Azure Blob Storage service: URL of the Azure Blob Storage service to store the website error logs. The maximum length of the URL can be 2,048 characters. If the URL is longer than 2,048 characters, an error message appears. This field is displayed only if the Do you want to update the Connection string of the Azure Blob Storage service? check box is selected. More information on connection string: Configure Azure Storage connection strings
Disable diagnostic logging
Open the Power Platform admin center.
Under the Resources section, select Power Pages sites.
Select your website.
From the Site Actions menu, select Disable diagnostic logging.
Select Disable in the confirmation message.
Display plugin error
Another scenario that often occurs while developing a website is an error generated by custom plug-ins and business logic written in your Dataverse environment. These errors can generally be accessed by disabling custom errors or enabling diagnostic logging. In some cases, it's faster to display these errors directly on the website to diagnose the issue faster. You can accomplish this task by configuring your website to display custom plugin errors from Dataverse on your webpage.
To display custom plugin errors, create the site setting Site/EnableCustomPluginError and set its value to True. The custom plugin errors are displayed on the screen instead of a generic error. The error displays only the message part of the plugin error and not the complete stack trace.
Following are the screens where custom plugin errors appear:
- List
- Retrieval of records
- Basic form
- Retrieve
- Create/Update, and so on
- Multistep forms
- Retrieve
- Create/Update, and so on
If the site setting isn't present, then it's treated as false by default and plugin errors don't render.
View server side errors in the DevTools extension
You can view server side error messages and potential solutions by using the Power Pages DevTools extension. Also you can debug the server side code by logging custom messages. Learn more in Power Pages DevTools extension: log custom messages with liquid.