Note
Access to this page requires authorization. You can try signing in or changing directories.
Access to this page requires authorization. You can try changing directories.
Just as Power Pages is the tool of choice to quickly extend your Microsoft Dataverse deployment to the public in the form of a website, Power BI is the tool of choice to render elegant data-driven visualizations. The beauty of the Power Platform lies in its ability to seamlessly blend the two. In the past, to render a Power BI report in a webpage, administrators had to publish the report to the web and embed it into an iFrame. Even if one did apply Pages permissions to lock down the page with the report, if an individual had the link used to embed the report, anyone would still be able to access the report outside of the website.
The purpose of publish to web is to allow any individual on the web to consume the data and even reshare the report.
Warning
When you use Publish to web, anyone on the Internet can view your published report or visual. Viewing requires no authentication. It includes viewing detail-level data that your reports aggregate. Before publishing a report, make sure it's okay for you to share the data and visualizations publicly. Don't publish confidential or proprietary information. If in doubt, check your organization's policies before publishing.
With Power BI embedded, one can contextually serve Power BI components to users, pass automatic filters by using a filter parameter, and enable row-level security capabilities to allow an organization to truly secure data visible to users and only display what they're meant to see.
Note
Row level security is only supported for Power BI embedded.
Prerequisites
- Tenant with a Microsoft Dataverse environment and a Power Pages website deployed.
- A webpage to embed a Power BI report or dashboard.
- Relevant business data stored in Dataverse.
- Power BI Desktop.
- Capacity for publishing Power BI embedded content.
- Tenant global admin rights.
- Tenant global admin with Admin role in the Power BI service workspace.
- Organization, not personal Power BI workspace.
- Registration/authentication turned on in the website.
Scenario
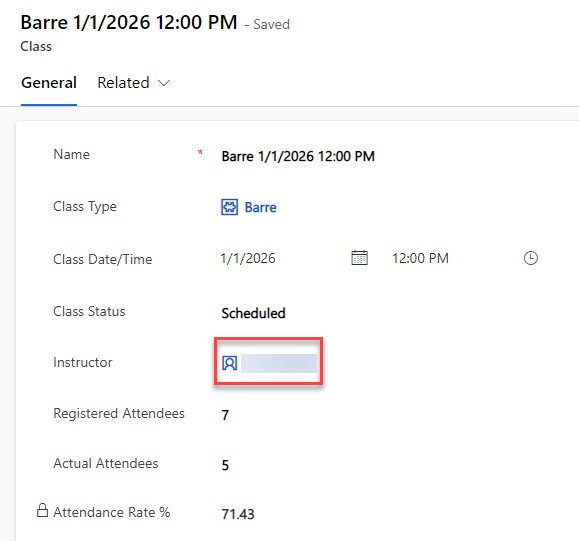
You work for a group fitness studio and use Dataverse to track group fitness classes and their attendance. The group fitness instructors don't reside on your tenant, as each is treated as a contractor. Your website is to be used by these group fitness instructors to sign in and see a history of their taught classes, their upcoming schedule, and attendee rates. They should only be able to see the classes that they themselves have taught though, and not everyone's.
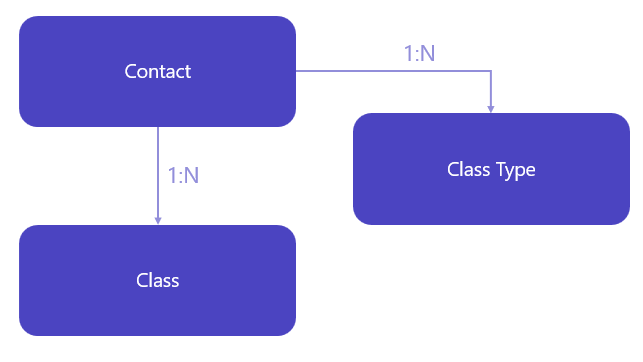
The instructors are represented by Contact records in Dataverse. When accessing the Power Pages website, they're doing so as their Contact record. The data that they need to see in the website comes from our custom Classes table. The Classes table has a N*:1 relationship to a contact, as the classes form has a lookup field named Instructor, which is for the contact table.
To get row level security to work for Power Pages users (Contacts), there needs to be that direct relationship between the Contact, and the table you're reporting against. Below is an example data model of this scenario:
Configure Power BI report or dashboard
Open your Power BI report or dashboard in Power BI Desktop.
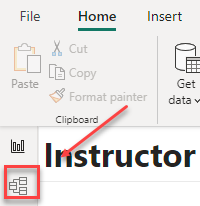
We must change the relationship between Contact and our table (Classes in this scenario) to use bidirectional filtering. To do so, select the Model tab on the far left.
Select the line that links your contact table to the table that contains your report's data – in the sample case, this is vbd_class since we're reporting on classes.
In the Edit relationship window, there are two picklists. In the top, choose the table you're reporting on (vbd_class) and select the column that has the record's unique identifier.
In the bottom picklist, select the contact table and select the Contact column.
Cardinality indicates Many to one (*:1). Change the Cross filter direction to Both.
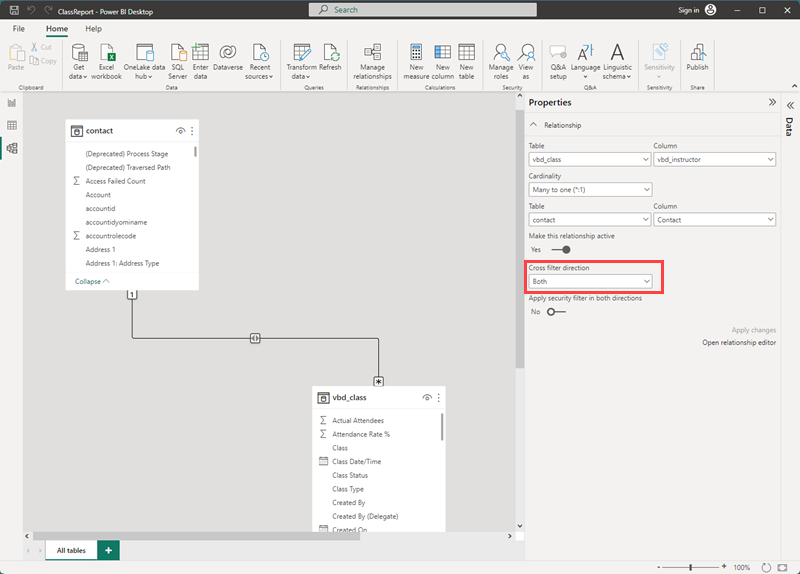
Select OK.
As we're implementing Row Level Security (RLS), we need to create our role. In the top Home ribbon, select on Manage roles.
Under Roles, select Create. Name the role. The sample scenario used pagesuser.
From the Tables column, select contact.
Populate the text box to the right with the DAX expression:
[User Name] = username()Note
The
[Username]field resides on the contact table and is not an actual username. This references the adx_externalidentity table used by Power Pages. This has the GUID that is sent to Power BI in the username() function.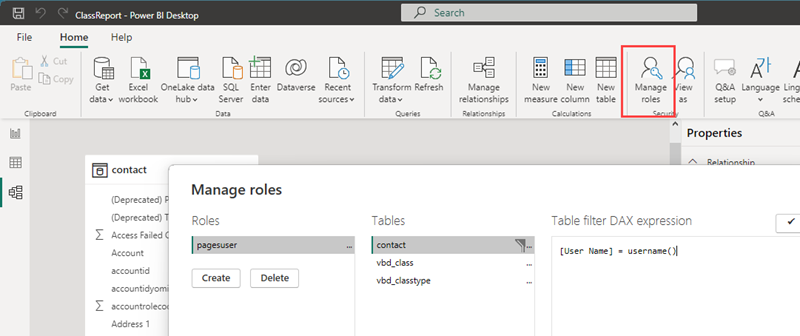
Select Save and then save your file.
From the Home ribbon, select Publish.
Select an organization workspace that you're an owner and that will be used by the Power Pages integration. Choose Select.
Configure Power BI integration
Refer to Set up Power BI integration to enable your website for Power BI integration.
Embed Power BI report
Navigate to Power Pages. Find the Power Pages website that you're going to embed the report into and then select Edit to open the Power Pages design studio.
From the Pages workspace, select the web page where you want to embed the report.
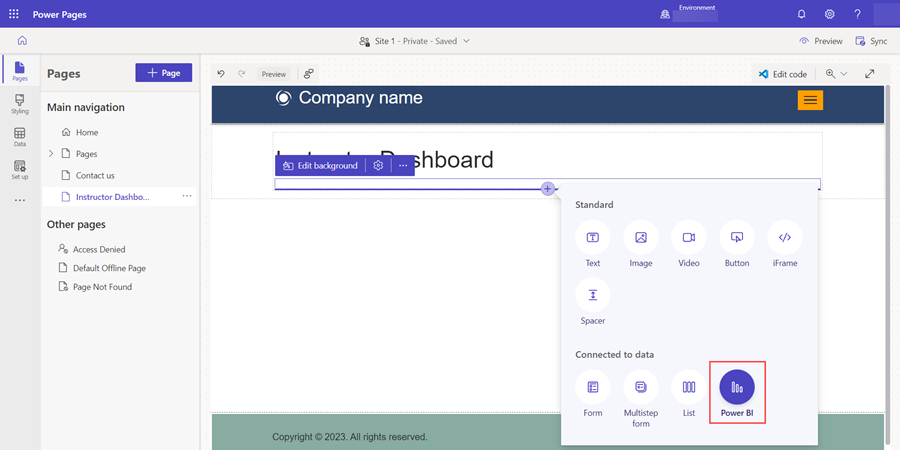
Add a section to the body of the webpage.
Choose the Power BI icon when prompted to choose which component you're adding within the section.
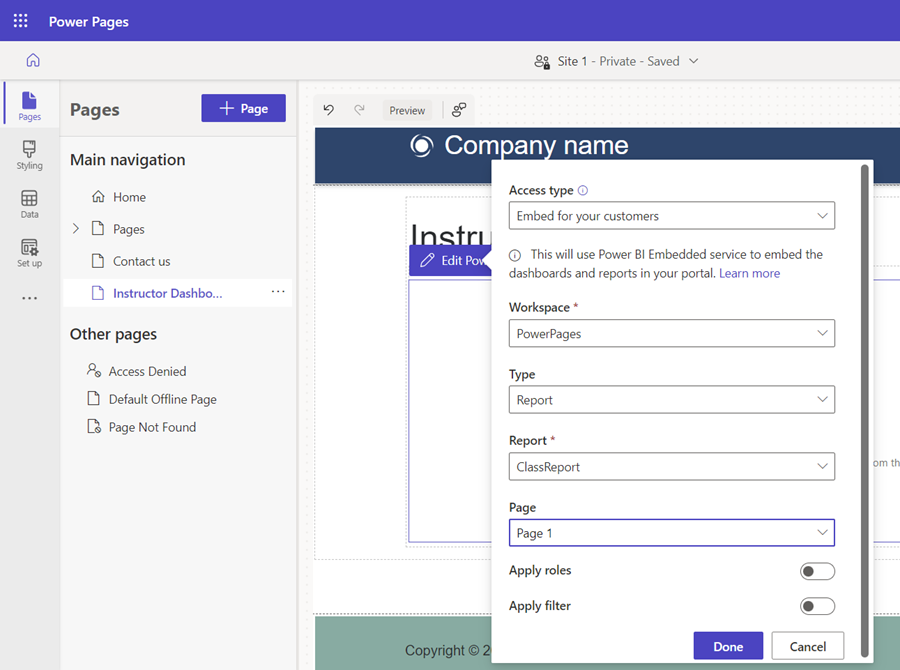
When the component populates the section, select on the top left corner; Edit Power BI.
Select Access type. The options are:
Embed for your customers: Allows you to share the Power BI with external users without a Power BI license or a Microsoft Entra identity.
Embed for your organization: This uses Microsoft Entra authentication to share the report from Power BI so internal users can see this.
Publish to web: This allows anyone on the internet to access the report and data.
Caution
Make sure that this is not confidential information!
Additional information: Publish to web
Choose Embed for your customers.
Select your workspace that contains the report or dashboard, specify the type as Report or Dashboard, and then choose the report or dashboard from the last dropdown. If this is a report, you need to specify which page you're embedding.
To see the code that embedded the report or dashboard, select Edit code from the top right corner of the studio.
When prompted, select Open Visual Studio Code. On the left, under PowerPages (Workspace) the name of the Power Pages website has a drop-down to the web page. Within that section you see a .css file, a .js file, and the HTML copy. Ensure that you are on the HTML copy file.
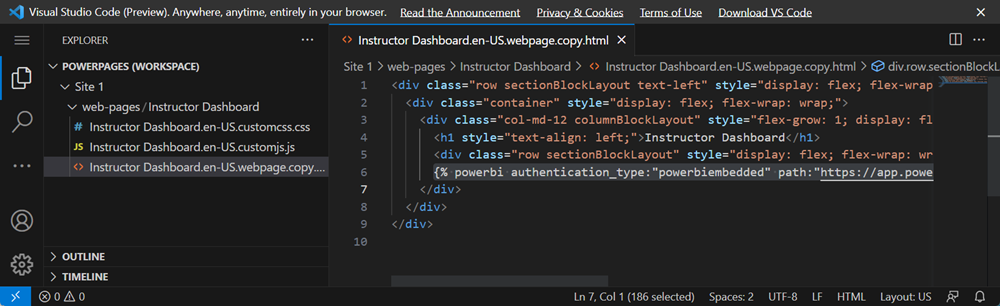
Select CTRL + F and search for
{%so we can quickly identify the code that contains the reference to our Power BI dashboard or report.{%indicates the opening of a tag, which creates logic for the language Liquid. Liquid is our bridge between Dataverse and what users interact with on the website. When we use the studio editor to embed components, a piece of liquid code is automatically created in the web page's source code. More information on the Power BI liquid tag can be found here: Dataverse Liquid tags and Add Power BI report.The full line of liquid code that you see will resemble:
{% powerbi authentication_type:"powerbiembedded" path:"https://app.powerbi.com/groups/00000000-0000-0000-0000-000000000000/reports/00000000-0000-0000-0000-000000000000/ReportSection" %}Close the Visual Studio Code for the Web tab.
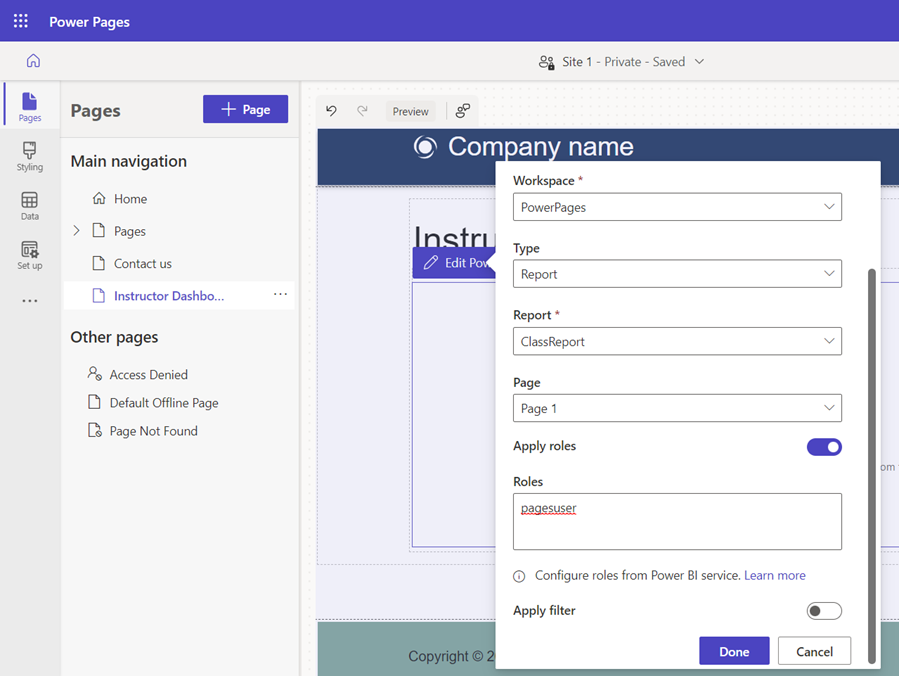
In Power Pages design studio, select the embedded Power BI component and choose Edit Power BI.
Scroll down to toggle Apply roles to true/yes.
In the Roles textbox, type the name of the role that you created in Power BI Desktop.
To see the changes this made to the code that embedded the report or dashboard, again select Edit code from the top right corner of the studio.
The full line of liquid code that you see will now resemble:
{% powerbi authentication_type:"powerbiembedded" path:"https://app.powerbi.com/groups/00000000-0000-0000-0000-000000000000/reports/00000000-0000-0000-0000-000000000001/ReportSection" roles:"pagesuser" %}Close the Visual Studio Code tab to return to the design studio.
Preview the resulting embedded report or dashboard in your browser by selecting Sync in the top right corner, then selecting Preview > Desktop.
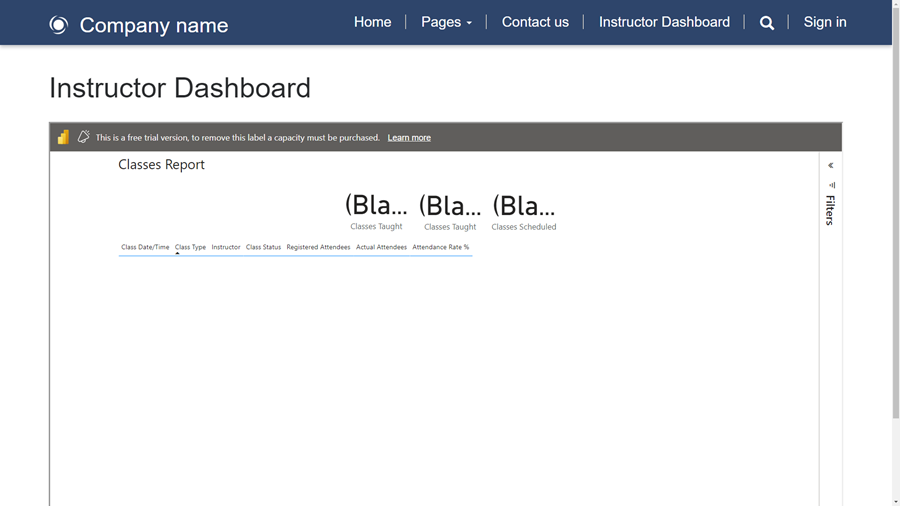
To test the report, with no user signed in you can see that the RLS has been applied, as there are no records returned navigating to the Power Pages website:
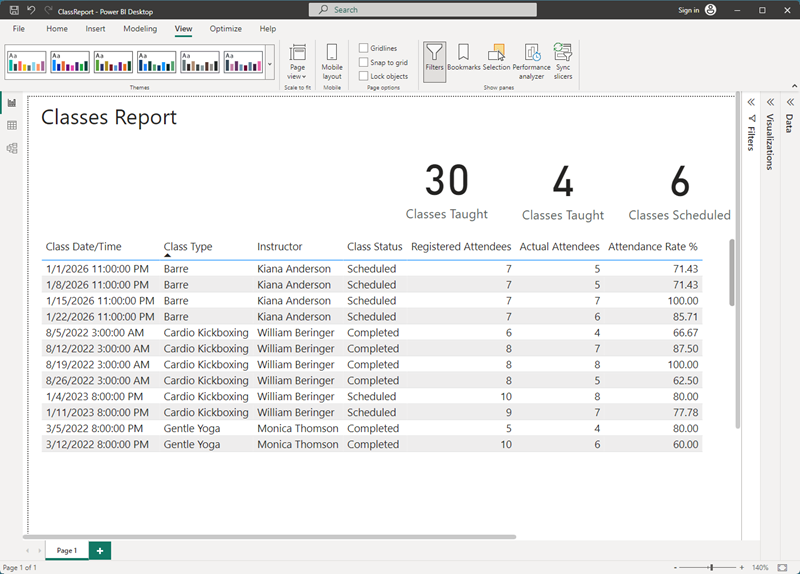
There's underlying data in this report, as when you view this from Power BI Desktop without the RLS applied, you can see that there are several records overall, but they're related to a contact record.
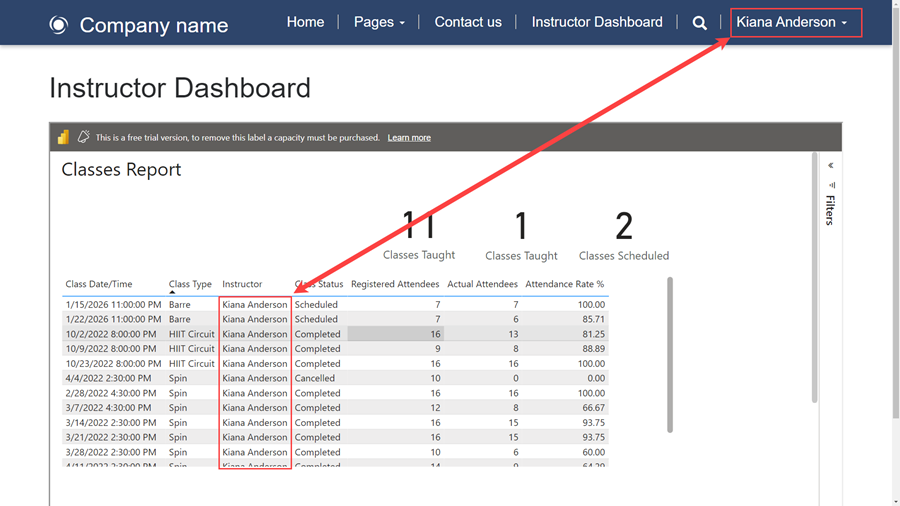
To test this further, if we sign into the website with a user that has a corresponding contact that has related data, you can only see the records related to the signed-user on the webpage:
Summary
You've embedded a Power BI report or dashboard that uses row-level security into your Power Pages website!
The filter pane appears by default. Hiding the filter pane requires JavaScript. Steps to do this are documented here: Add a Power BI report or dashboard to a webpage in a portal.