Note
Access to this page requires authorization. You can try signing in or changing directories.
Access to this page requires authorization. You can try changing directories.
Power Automate telemetry flows into two tables on Application Insights – Requests and Dependencies. All the downstream alerting and monitoring capabilities we could do on Power Automate data would be within these two tables within Application Insights.
| Table name | Description |
|---|---|
| Requests | Contains cloud flow runs |
| Dependencies | Contains cloud flow triggers and cloud flow actions |
Note
This feature is turned on and supported for Managed Environments only.
While Application Insights capabilities can be used for comprehensive monitoring of your applications, including custom diagnostics, and performance monitoring, this article focuses on how to use the existing features within Application Insights to create monitoring and alerting capabilities for your automation. To learn about how to open and work with Application Insights dashboard, see Application Insights Overview dashboard.
Note
- Export of Power Automate and Dynamics 365 Customer Service data isn't available in sovereign clouds, such as Government Community Cloud (GCC), Government Community Cloud - High (GCC High), and Department of Defense (DoD), currently.
- The logs powering the Power Automate telemetry in Application Insights aren't transactional data and hence are not 100% lossless. Small data losses on this telemetry data might happen due to temporary, non-repeating service issues. Flow execution history available within the flow details in the Power Automate portal is transactional, and therefore provides full view of events, in case of transient missing log data on Application Insights.
- Consider bookmarking the selected Application Insights dashboard for fast and easy access to the insights information.
Monitor cloud flow executions
Follow these steps to monitor cloud flow executions.
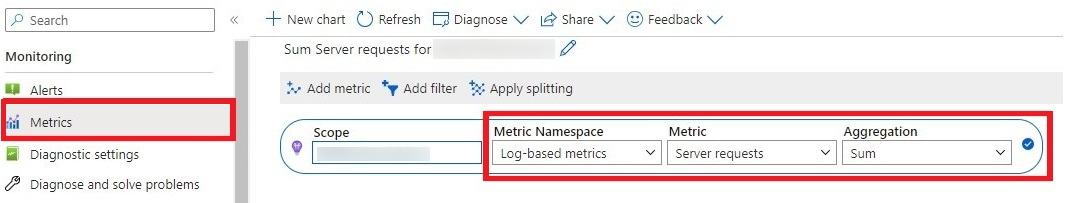
From the Application Insights dashboard for your instance, select Metrics from the left navigation menu and then select Server requests from the Metric filter. Adjust the time period filter from the top right as required.
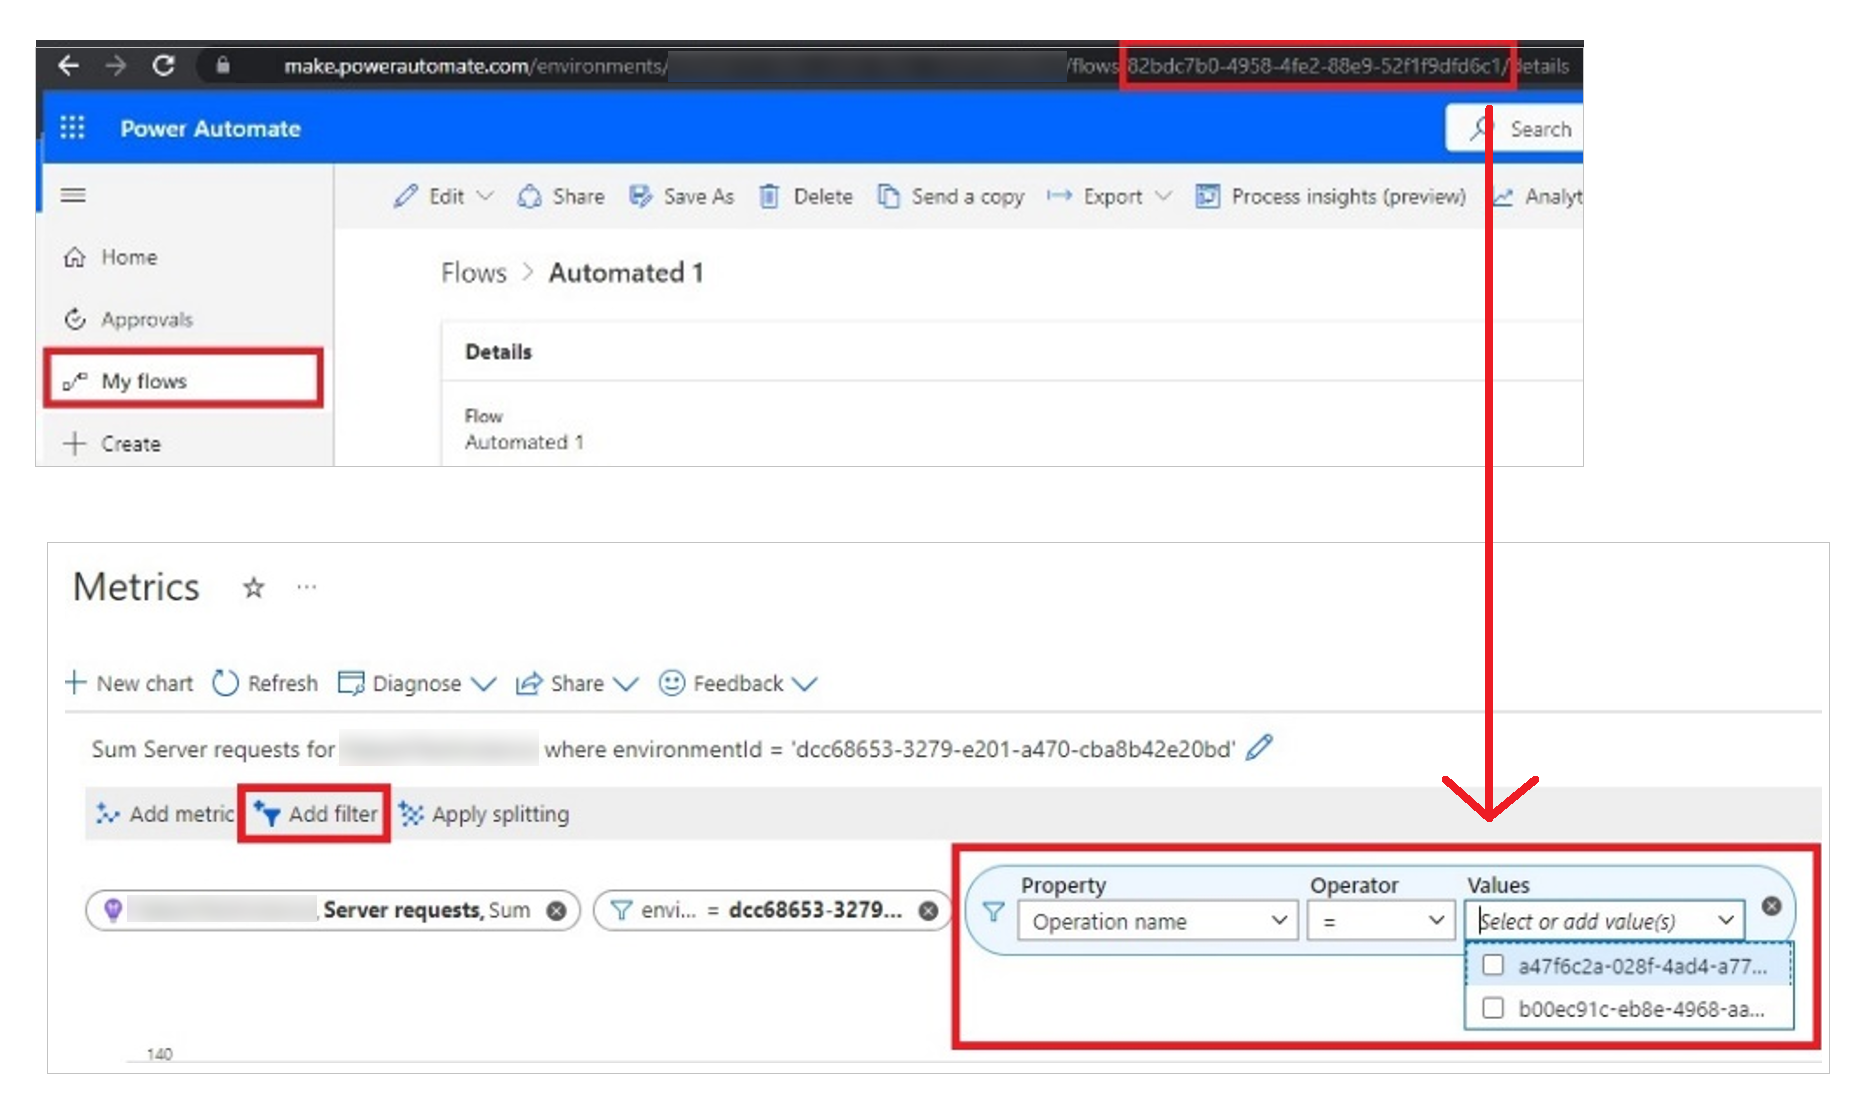
For filtering cloud flow executions to a specific environment, select Add filter, and then select environmentId from the Property field and select your environment.
For more filtering cloud flow executions to a specific flow or a set of flows, you add more filters. To do this, select Add filter, and then select Operation name from the property field and select the flow(s) you want to monitor.
The Operation Name field maps to the flow identifier you see from Power Automate. For example, to find the flow ID of any cloud flow, select the cloud flow from the Power Automate portal and the highlighted part- alphanumeric part that follows the word flows.
You can continue adding more filters as depending on the scenario, pin frequently reviewed scenarios, drill into specific error, or alert directly from the screen
Monitor cloud flow triggers and actions
Follow these steps to monitor cloud flow executions.
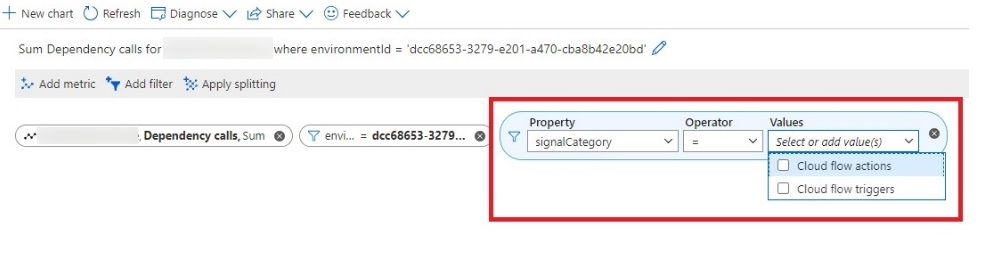
From the Application Insights dashboard for your instance, select Metrics from the left navigation and select Dependency calls from the Metric filter.
Filter for environment ID to filter for specific environments.
Select Add filter > Signal Category from the Property filter.
Select Cloud flow triggers or Cloud flow actions to filter for triggers and actions respectively.
Select Add filter and select ResourceId to select triggers and actions for specific flows. Within the dependencies table, the column ResourceId maps to the flowId.
Select Add filter and select Operation Name from the property filter to specify the names of specific actions or triggers if you want to further distill down. These filters are the same as the display names of triggers and actions of the cloud flow you would see in the Power Automate designer
You can also pin these dashboards as favorites for a quick reference.
Create alerts for cloud flow run failures
Application Insights provides a set of robust out-of-the-box alerting capabilities that can be used for getting on automation failures.
Cloud flow runs are mapped to Requests table, and fall into Server Requests signal name. Therefore, any alerts that refer to Failed requests directly map to cloud flow run error.
Cloud flow triggers and cloud flow actions are mapped to the Dependency calls signal name. Hence, any alerts that refer to Dependency call failures map to action or trigger errors.
Note
For step-by-step instructions to create and edit alert rules in Application Insights, go to Create or edit an alert rule.
To set up an alert for a cloud flow run failure:
From the Application Insights dashboard for your instance, select Alerts from the left navigation. And then, select Create an alert rule.
Select Dependency calls for alerting on triggers and actions. To alert on only failures, select Dependency call failures.
Select Server Requests for cloud flow runs. To alert only on run failures, select Failed requests
Select the threshold for monitoring errors and the frequency with which you want to check for errors.
You can combine multiple conditions into a single alert by selecting Add condition and repeating the previous step
If an action group isn't already created, create a specific action group. More information: Action groups
Enter the notification type you want to configure for this alert.
Enter the action you want to perform once this alert is fired. You can use a webhook to trigger a Power Automate flow to do more advanced notifications using Microsoft Teams or other communication channels enabled by the connector ecosystem.
Review and complete the creation of the action group.
Configure the severity of the alert and provide an appropriate name
Review and finish setting up the alert.
Create a custom alert
Out of the box alerts help you track errors at the Application Insights instance level.
When you want to restrict alerting for a specific environment, or a specific set of flows or actions, consider Custom log search. You can configure custom log search while creating an alert rule by adding a condition with the signal name of Custom log search.
And then, enter any custom query that you want to add. Here are some examples.
Here are some of the sample queries you can use.
Filtering for a specific cloud flow's failures.
let myEnvironmentId = **'Insert your environment ID here**;
let myFlowId = **Insert your flow ID here** ';
requests
| where timestamp > ago(**1d**)
| where customDimensions ['resourceProvider'] == 'Cloud Flow'
| where customDimensions ['signalCategory'] == 'Cloud flow runs'
| where customDimensions ['environmentId'] == myEnvironmentId
| where customDimensions ['resourceId'] == myFlowId
| where success == false
Filtering for a specific cloud trigger's failures. (replace the bolded values with your specific values)
let myEnvironmentId = **'Insert your environment ID here**;
let myFlowId = **Insert your flow ID here** ';
dependencies
| where timestamp > ago(**1d**)
| where customDimensions['resourceProvider'] == 'Cloud Flow'
| where customDimensions['signalCategory'] == 'Cloud flow triggers'
| where customDimensions['environmentId'] == myEnvironmentId
| where name == myTriggerName
| where success == false
Filtering for a specific cloud action's failures. (replace the bolded values with your specific values)
let myEnvironmentId = **'Insert your environment ID here**;
let myActionName = **'Delete a row'**;
dependencies
| where timestamp > ago(**1d**)
| where customDimensions['resourceProvider'] == 'Cloud Flow'
| where customDimensions['signalCategory'] == 'Cloud flow actions'
| where customDimensions['environmentId'] == myEnvironmentId
| where name == myActionName
| where success == false
You can combine multiple such custom queries into a single alert per your requirements.
Custom debugging of logs
Since all the raw telemetry is now flowing into Application Insights, you can use the Log Analytics in Application Insights to perform custom debugging or diagnostics per business needs.
- Cloud flow runs data is available on the Requests table
- Cloud flow triggers and actions data is available on the Dependencies table
Within these tables, Custom Dimensions column contains most of the metadata required for detailed debugging of cloud flows – such as environment ID, flow ID and action names.