Note
Access to this page requires authorization. You can try signing in or changing directories.
Access to this page requires authorization. You can try changing directories.
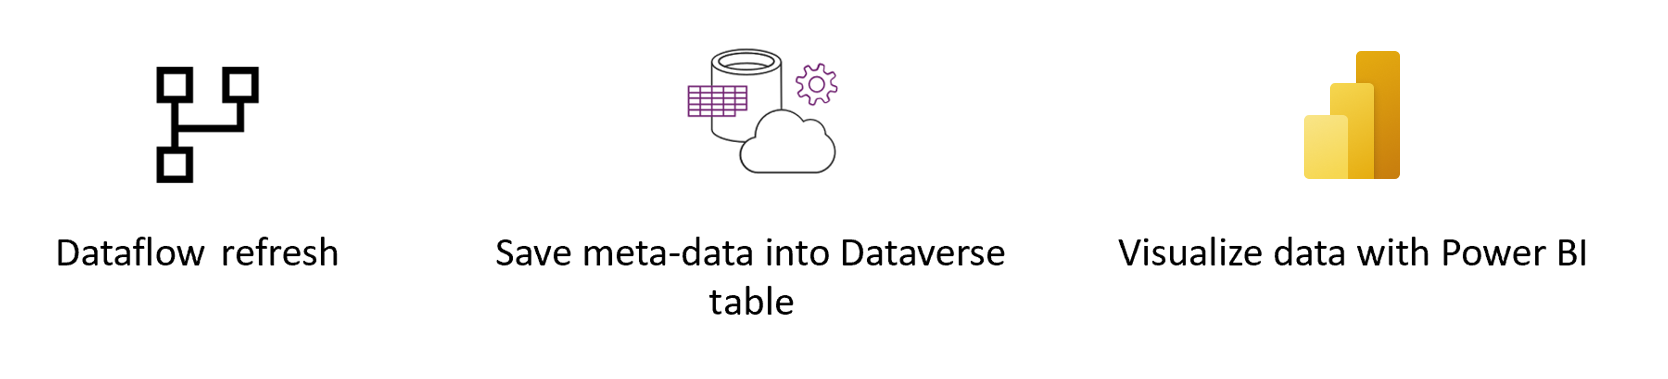
This tutorial demonstrates how to load data in a Dataverse table to create a dataflows monitoring report in Power BI.
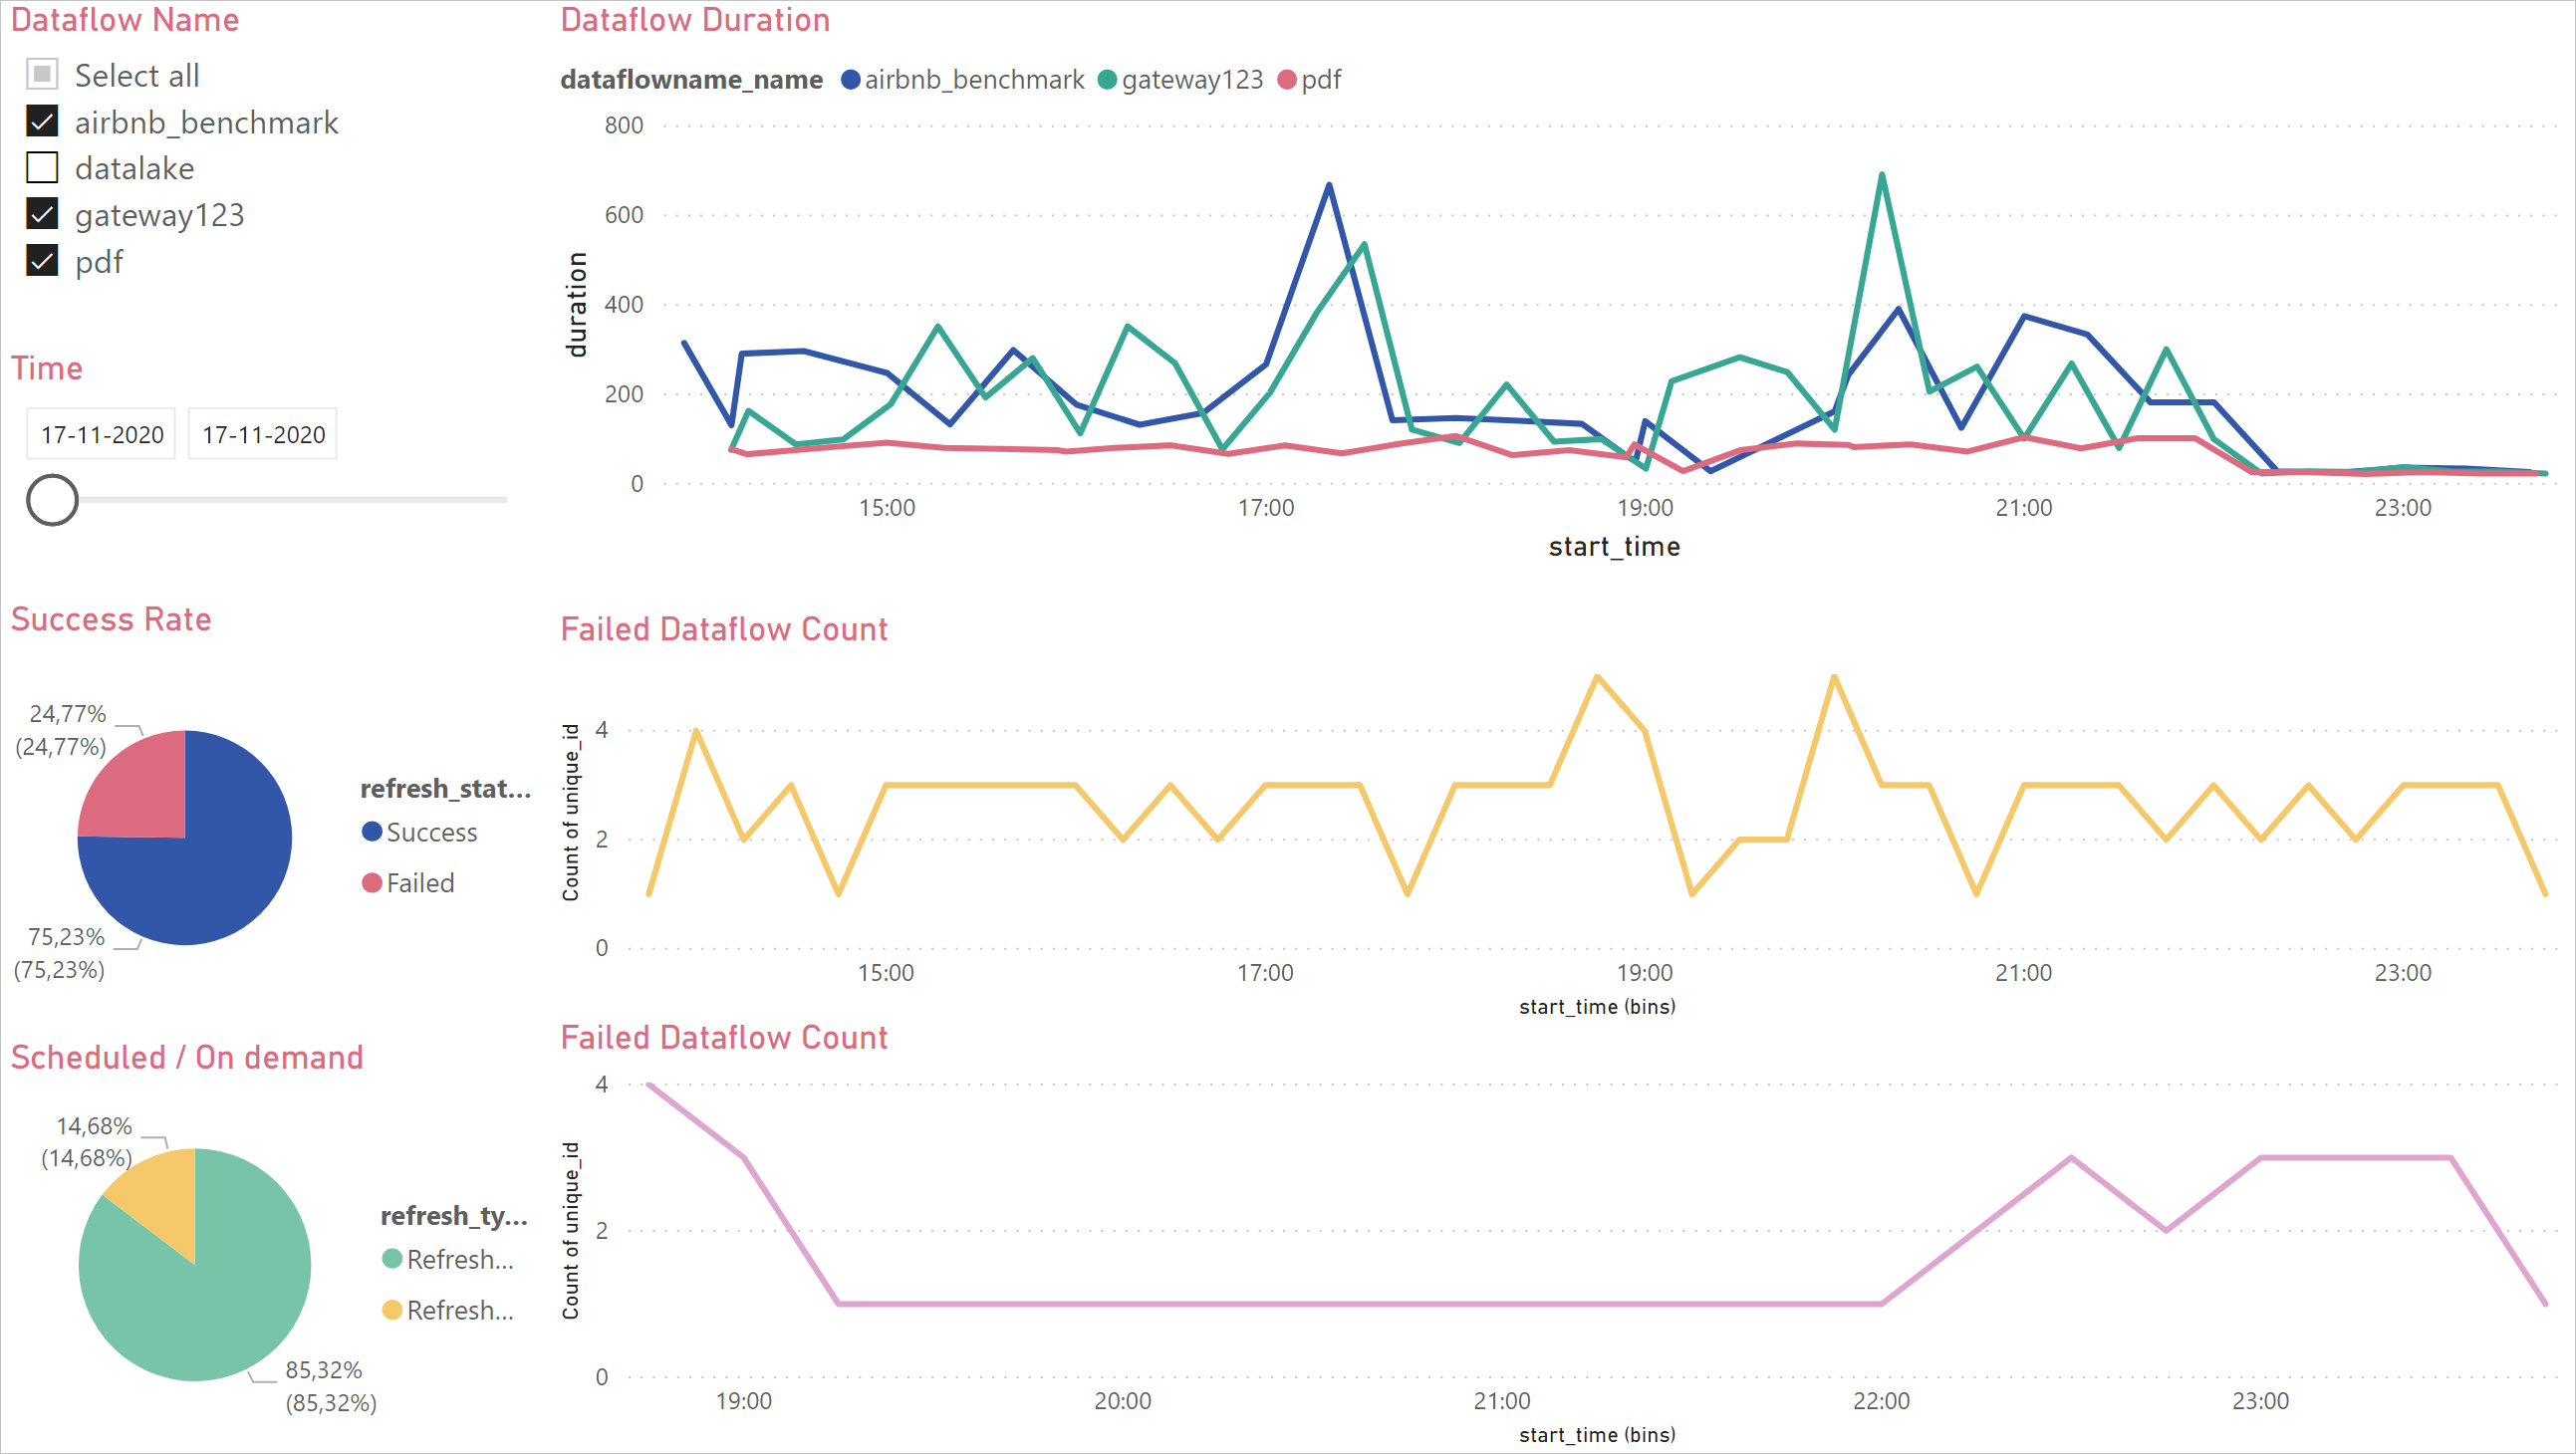
You can use this dashboard to monitor your dataflows' refresh duration and failure count. With this dashboard, you can track any issues with your dataflows performance and share the data with others.
First, you'll create a new Dataverse table that stores all the metadata from the dataflow run. For every refresh of a dataflow, a record is added to this table. You can also store metadata for multiple dataflow runs in the same table. After the table is created, you'll connect the Power BI file to the Dataverse table.
Prerequisites
A Dataverse environment with permissions to create new custom tables.
Download the .pbit file
First, download the Dataverse .pbit file.
Create a new table in Dataverse
Navigate to the Power Apps portal.
On the left navigation pane expand Data, select Tables, and then select New table.
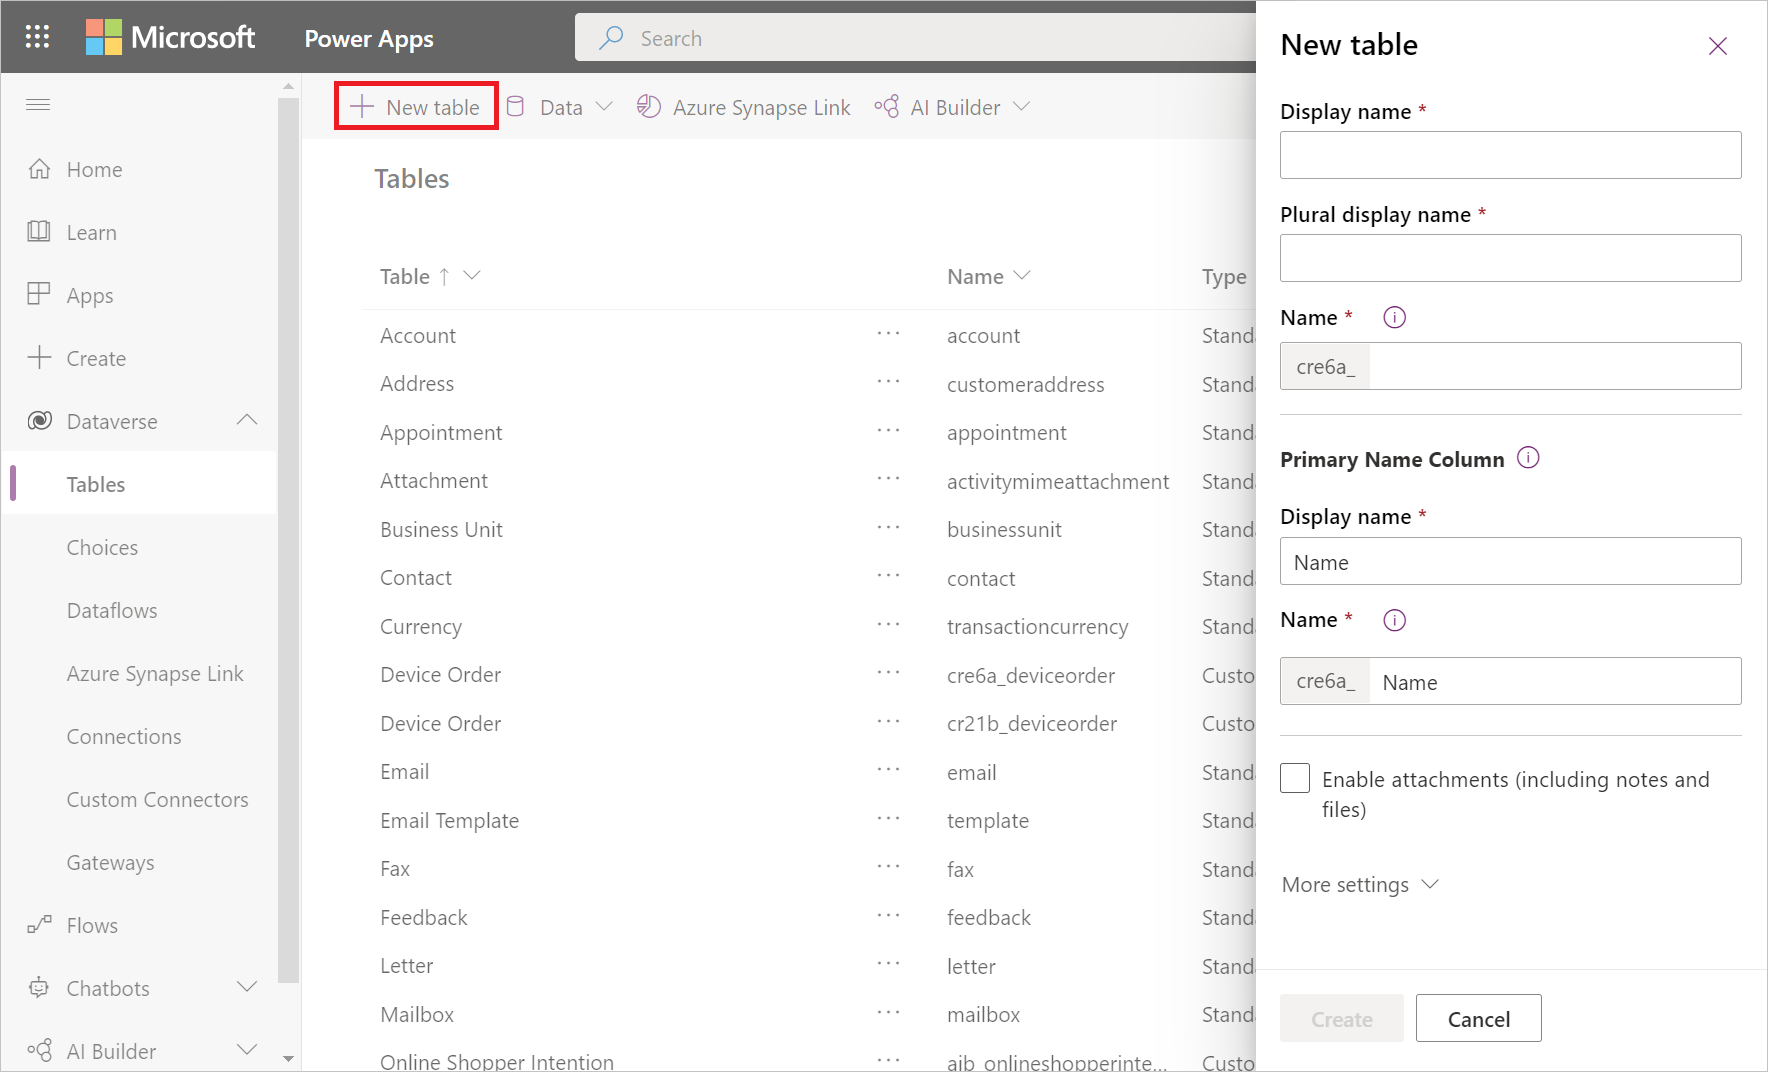
In the New table pane:
- Enter Dataflows Monitoring in Display name.
- Under Primary Name Column, enter Dataflow name in Display name.
- Select Create.
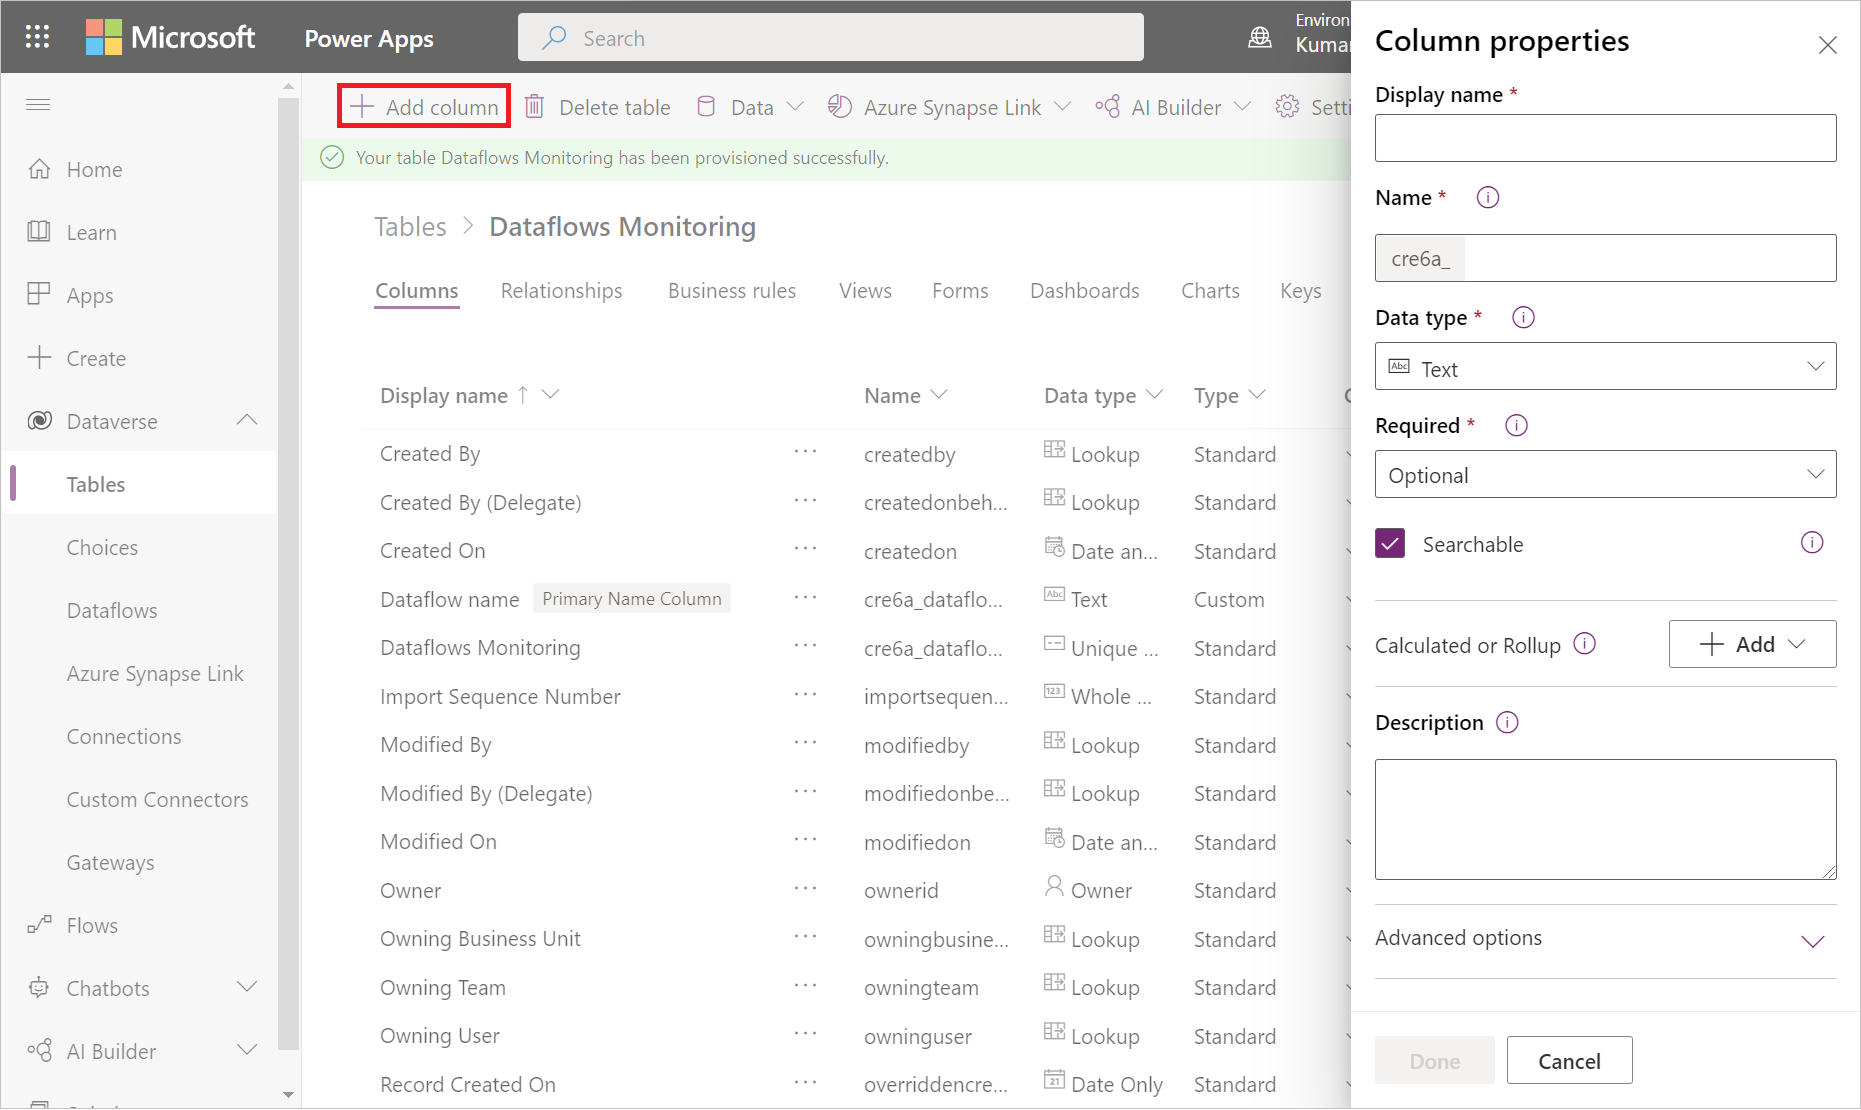
Select Add column to repeat adding columns for the following values:
- Display name: "Dataflow Id", Data type: Text, Required: Required.
- Display name: "Refresh Status", Data type: Text, Required: Required.
- Display name: "Refresh Type", Data type: Text, Required: Required.
- Display name: "Start Time", Data type: Date and Time, Required: Required.
- Display name: "End Time", Data type: Date and Time, Required: Required.


Create a dataflow
If you don't already have one, create a dataflow. You can create a dataflow in either Power BI dataflows or Power Apps dataflows.
Create a Power Automate flow
Navigate to Power Automate.
Select Create > Automated cloud flow.
Enter a flow name, and then search for the "When a dataflow refresh completes" connector. Select this connector from the list, and then select Create.
Customize the connector. Enter the following information on your dataflow:
- Group Type: Select Environment when connecting to Power Apps and Workspace when connecting to Power BI.
- Group: Select the Power Apps environment or the Power BI workspace your dataflow is in.
- Dataflow: Select your dataflow by name.
Select New step to add an action to your flow.
Search for the "Add a new row" connector from Dataverse, and then select it.
In Add a new row, select Choose a table and then choose Dataflows Monitoring from the list.
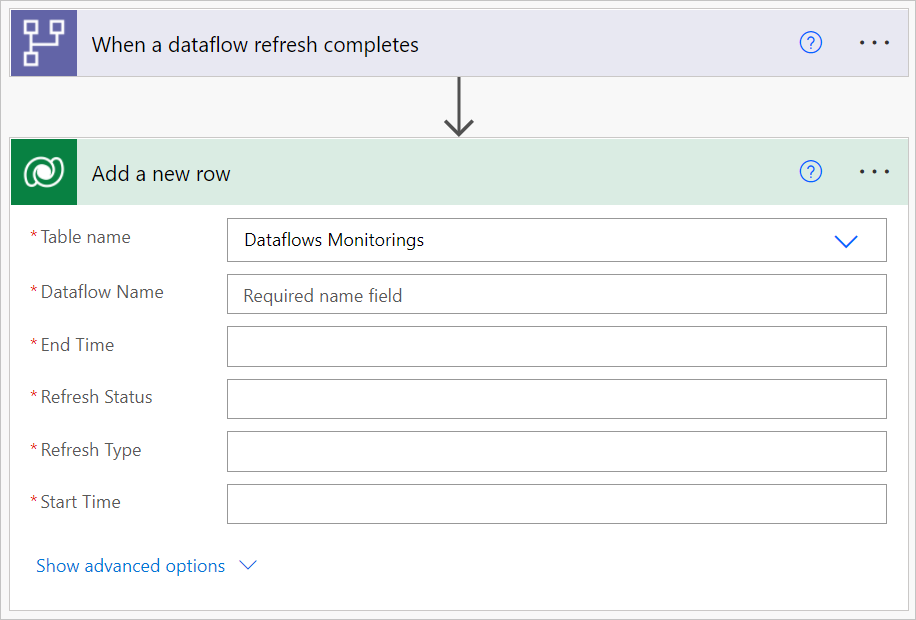
For every required field, you need to add a dynamic value. This value is the output of the metadata of the dataflow that's run.
Select the field next to Dataflow Name and then select Dataflow Name from the dynamic content.
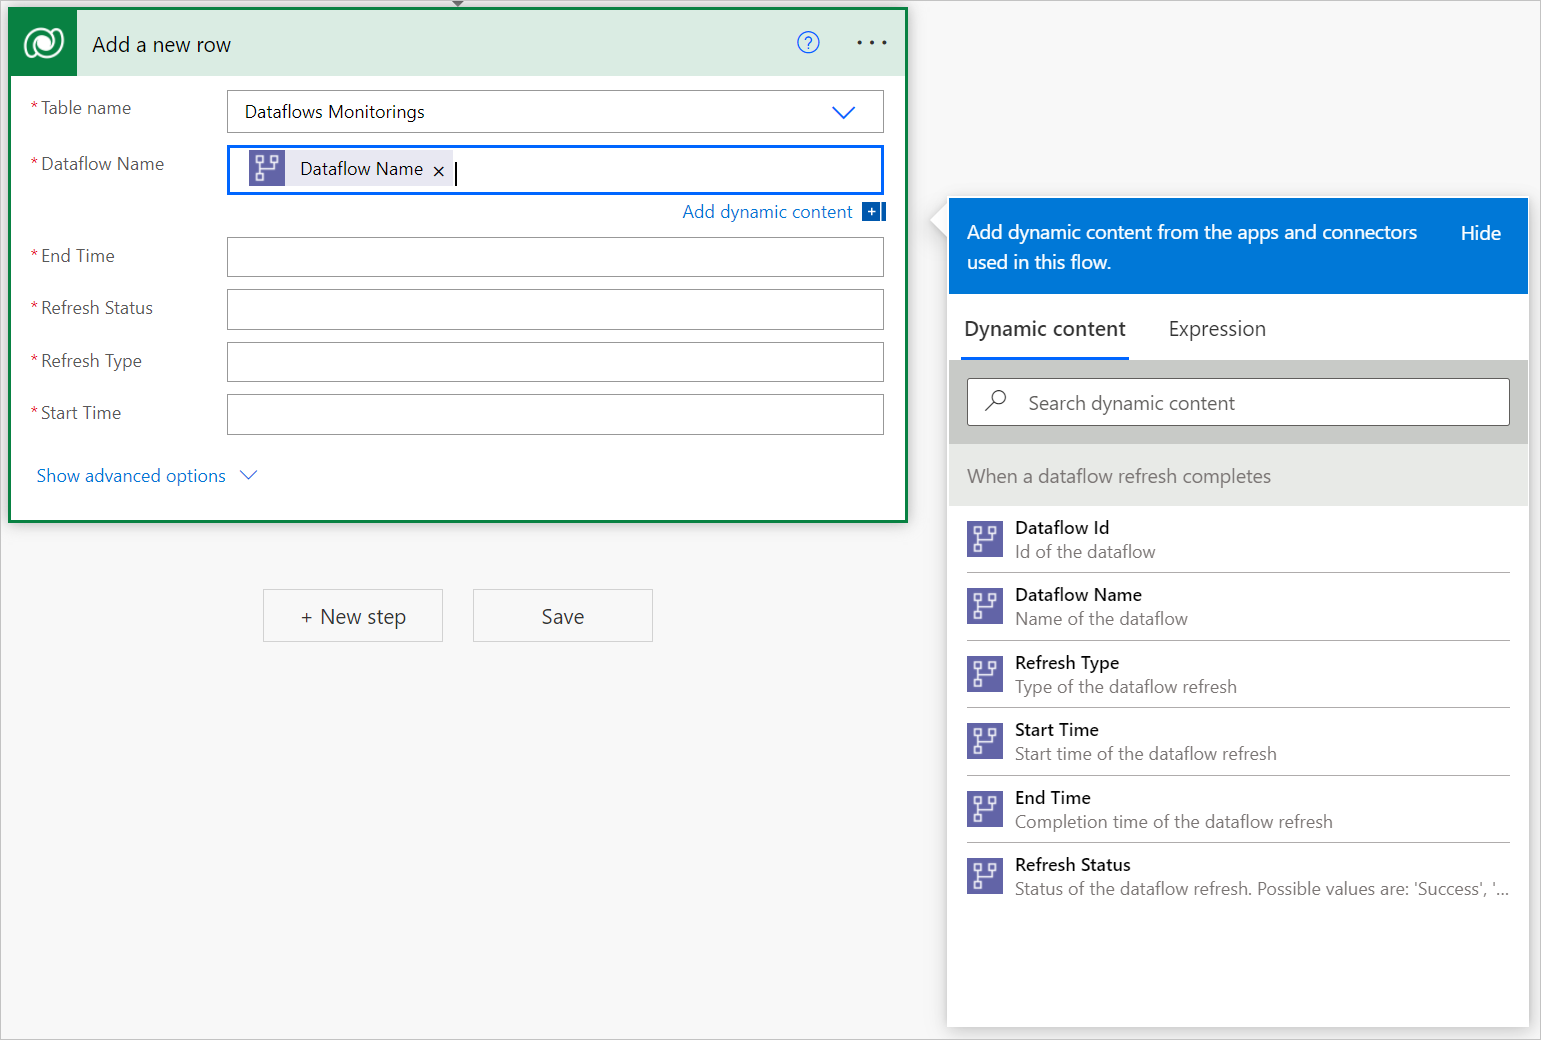
Repeat this process for all required fields.
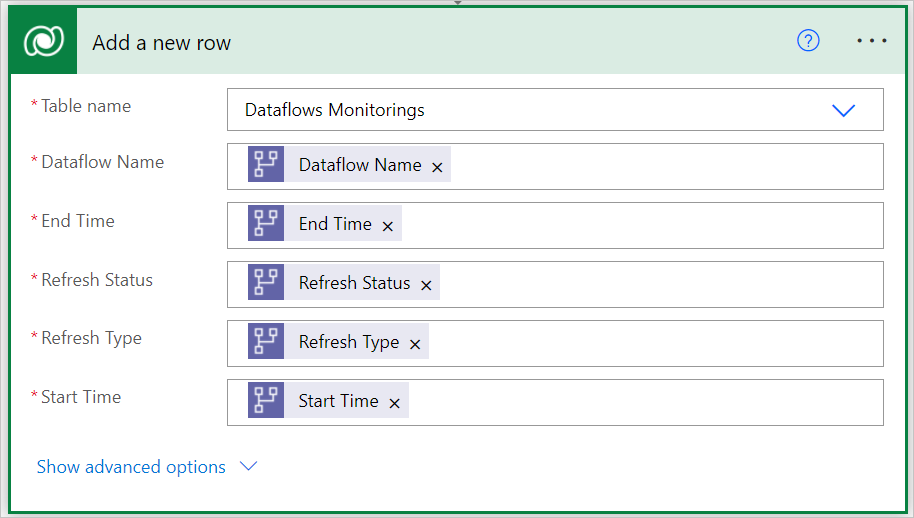
Save the flow.

Create a Power BI Report
Open the
.pbitfile.Connect to your Dataverse entity Dataflows Monitoring.
In this dashboard, for every dataflow in your specified time interval, you can monitor:
- The dataflow duration
- The dataflow count
- The dataflow failure count
The unique ID for every dataflow is generated by a merge between the dataflow name and the dataflow start time.