Note
Access to this page requires authorization. You can try signing in or changing directories.
Access to this page requires authorization. You can try changing directories.
Tip
Power BI Dataflow Gen1 is now in a legacy state and won't receive new feature investment. For Premium customers with Fabric access, Dataflow Gen2 is the recommended path, offering improvements in performance, scale, reliability, functionality, and built-in AI. Pro/PPU customers can continue to use Gen1 as Gen2 guidance for these scenarios is evolving. See Upgrade from Dataflow Gen1 to Dataflow Gen2 for upgrade guidance.
This tutorial demonstrates how to use an Excel file and the dataflows connector in Power Automate to create a dataflows monitoring report in Power BI.
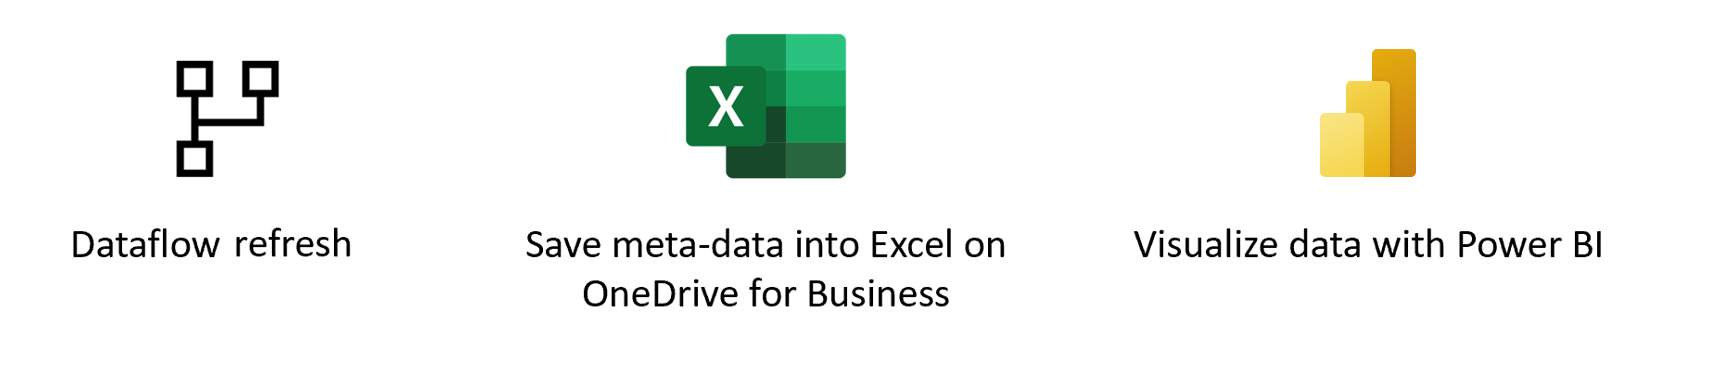
First, you download the Excel file and save it in OneDrive for work or school or SharePoint. Next, you create a Power Automate connector that loads metadata from your dataflow to the Excel file in OneDrive for work or school or SharePoint. Lastly, you connect a Power BI file to the Excel file to visualize the metadata and start monitoring the dataflows.
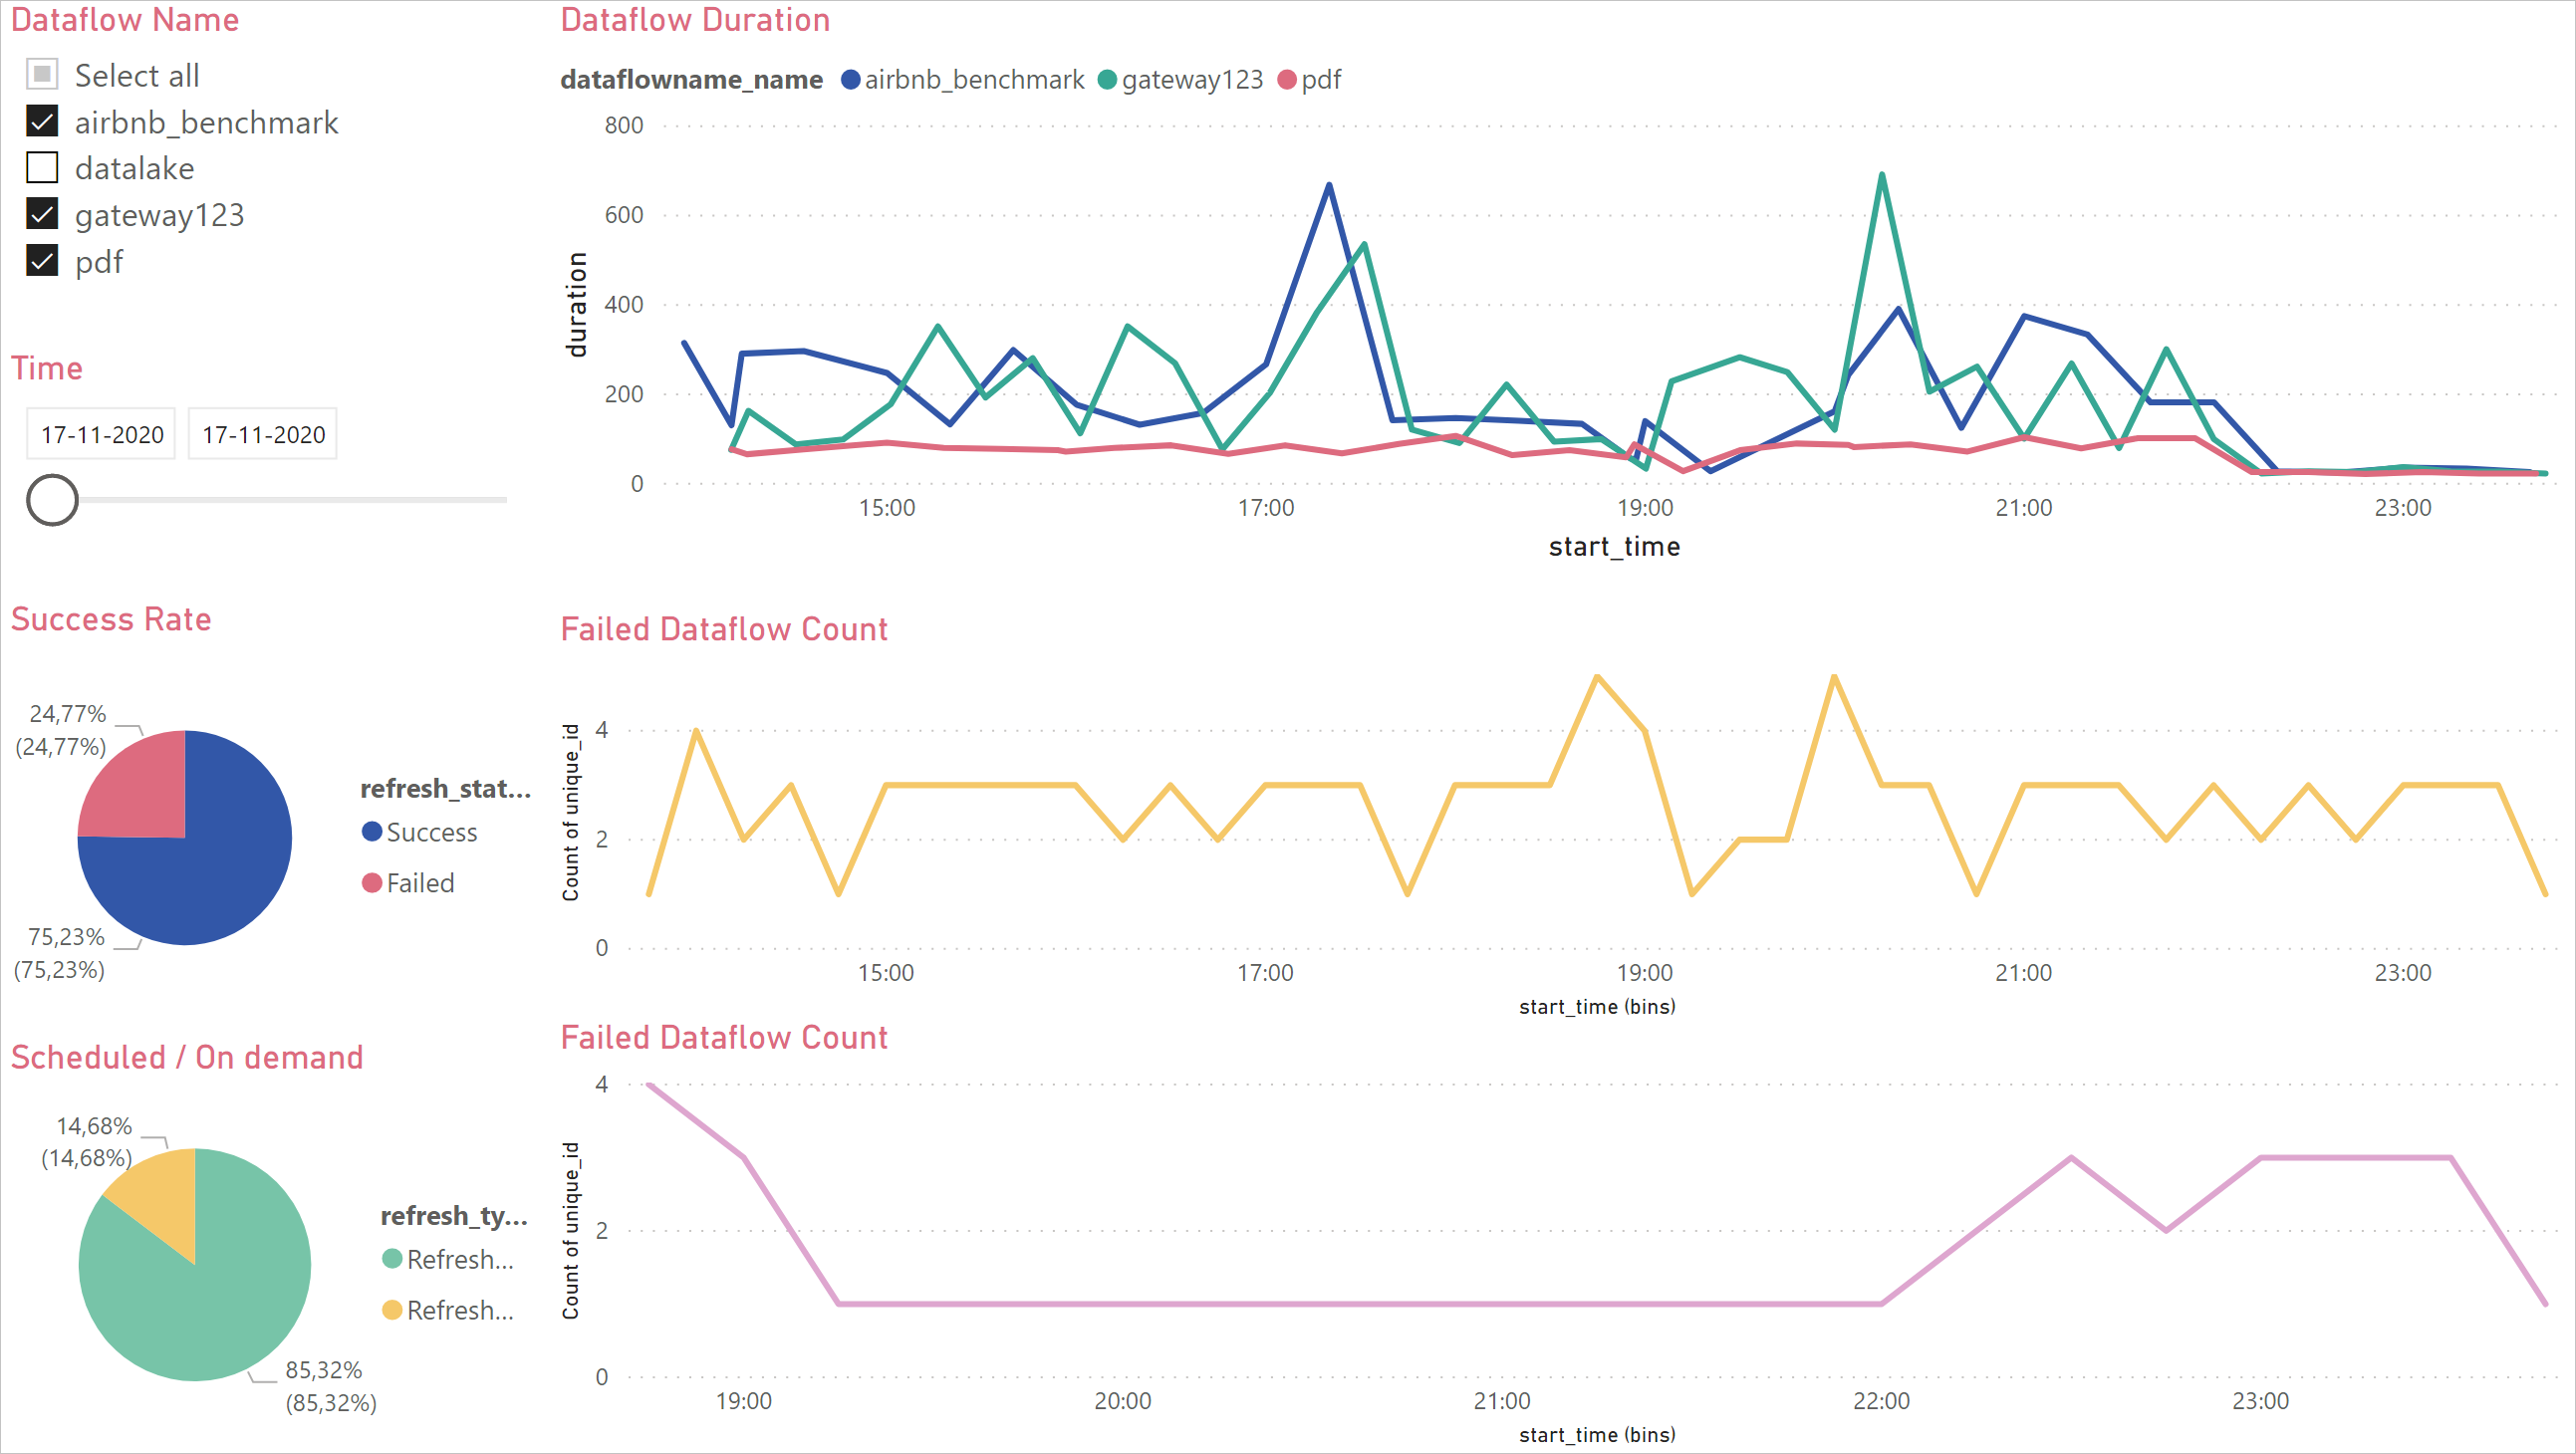
You can use this dashboard to monitor your dataflows' refresh duration and failure count. With this dashboard, you can track any issues with your dataflows performance and share the data with others.
Prerequisites
Download the .pbit file
First, download the .pbit file.
Download the Excel file and save to OneDrive
Next, download the .xlsx file and save the file to a location on OneDrive for work or school or SharePoint.
Create a dataflow
If you don't already have one, create a dataflow. You can create a dataflow in either Power BI dataflows or Power Apps dataflows.
Create a flow in Power Automate
Navigate to Power Automate.
Select Create > Automated cloud flow.
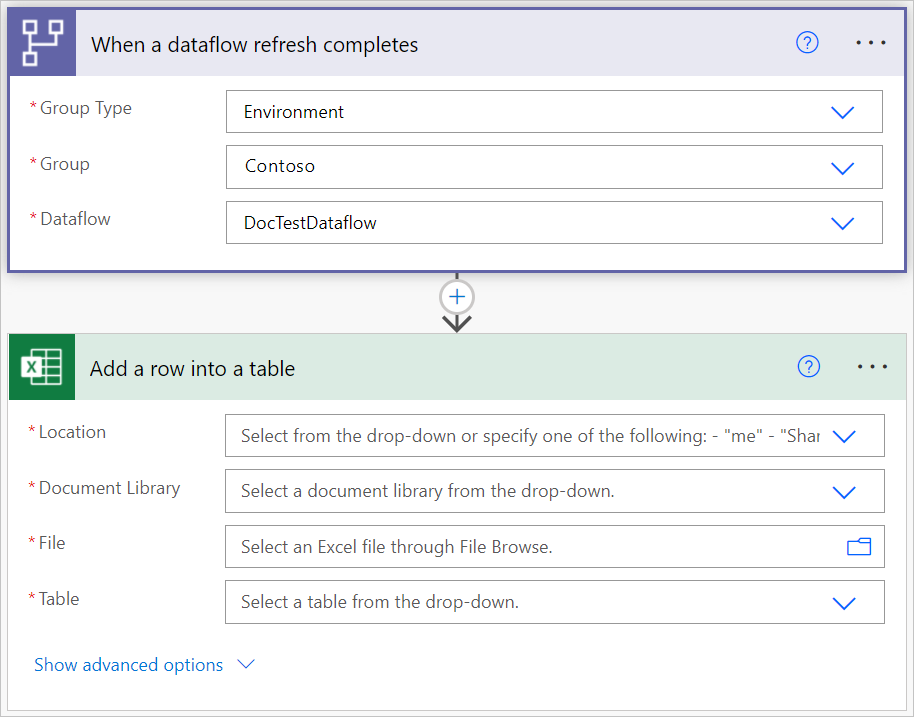
Enter a flow name, and then search for the "When a dataflow refresh completes" connector. Select this connector from the list, and then select Create.
Customize the connector. Enter the following information on your dataflow:
- Group Type: Select Environment when connecting to Power Apps and Workspace when connecting to Power BI.
- Group: Select the Power Apps environment or the Power BI workspace your dataflow is in.
- Dataflow: Select your dataflow by name.
Select New step to add an action to your flow.
Search for the "Add a row into a table" connector from Excel Online (Business), and then select it.
Customize the connector. Enter the Location of the Excel file and the specific Table the data loads to.
- Location: Select the location of the Excel file on OneDrive for work or school or SharePoint.
- Document Library: Select the library of the Excel file.
- File: Select the file path to the Excel file.
- Table: Select "Dataflow_monitoring."
Add dynamic values to the required fields.
For every required field, you need to add a dynamic value. This value is the output of the metadata of the dataflow run.
Select the field next to dataflowname_name.
Select Dataflow Name from the Dynamic content context box.
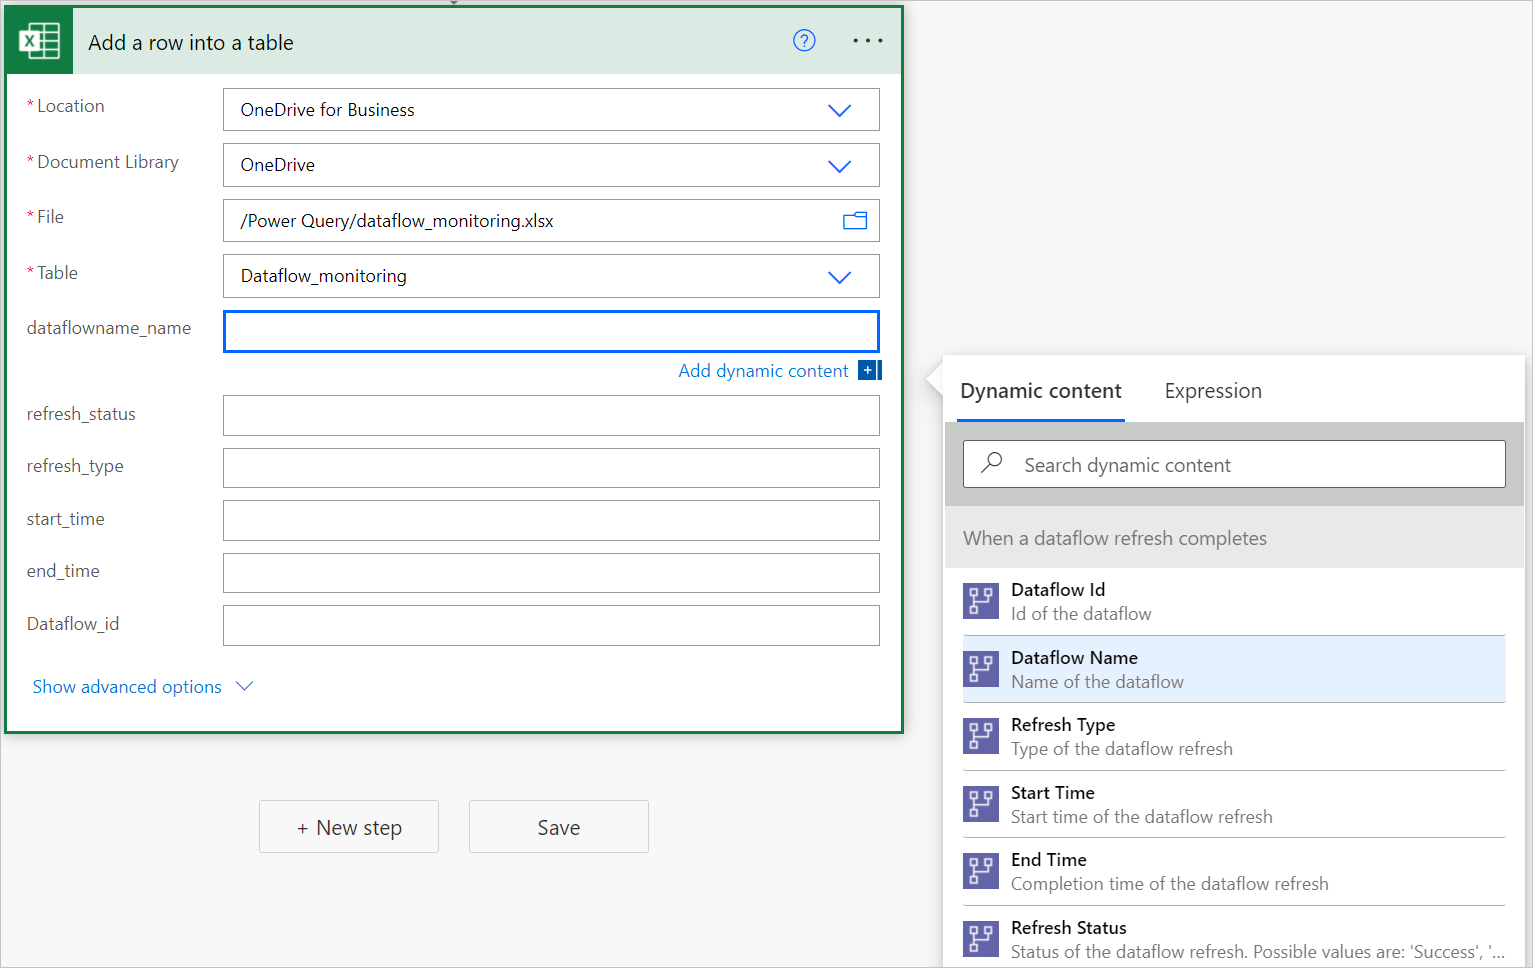
Repeat this process for all required fields.
Save the flow.

Create a Power BI Report
Open the
.pbitfile.Connect to your Excel file.
In this dashboard, for every dataflow in your specified time interval, you can monitor:
- The dataflow duration
- The dataflow count
- The dataflow failure count
A merge between the dataflow name and the dataflow start time generates the uniqueID for every dataflow.