Monitor and log
![]()
Alternatively, check out monitor and log on the edge.
Note
Azure Video Analyzer has been retired and is no longer available.
Azure Video Analyzer for Media is not affected by this retirement. It is now rebranded to Azure Video Indexer. Click here to read more.
In this article, you'll learn about events and logs generated by Azure Video Analyzer service. You'll also learn how to consume the logs that the service generates and how to monitor the service events.
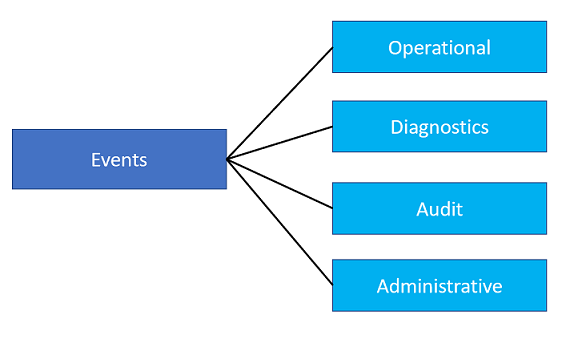
Taxonomy of events
Below diagram represents common taxonomy used for the events or telemetry data emitted by Video Analyzer service:
Event schema
Events generated by Video Analyzer service consist of system properties, application properties and a body.
Common properties
Every event has a set of common properties:
| Property | Property type | Data type | Description |
|---|---|---|---|
trace-id |
system | guid | Unique event ID. |
resourceId |
applicationProperty | string | ARM path for the Azure Video Analyzer account. |
subject |
applicationProperty | string | Subpath of the entity emitting the event. |
time |
applicationProperty | string | Time the event was generated. |
category |
system | string | Audit, Operational, Diagnostics. |
operationName |
applicationProperty | string | Event type identifier (See the following section). |
level |
system | string | Event level (Informational, Warning, Error, Critical). |
body |
body | object | Particular event data. |
operationVersion |
system | string | Event Data version {Major}.{Minor} |
Event types
Video Analyzer service emits following types of event data:
Operational: Events generated by the actions of a user or during the execution of a pipeline.
- Volume: Expected to be low (a few times a minute, or even less). Examples:
| Event | Level | Short Description |
|---|---|---|
| RecordingStarted | Informational | Media recording started |
| RecordingAvailable | Informational | Media recording available |
| RecordingStopped | Informational | Media recording stopped |
| PipelineStateChanged | Informational | State of pipeline changed |
Sample operational event
{
  "time": "2021-10-06T21:19:36.0988630Z",
  "resourceId": "/SUBSCRIPTIONS/{SUBID}/RESOURCEGROUPS/{RGNAME}/PROVIDERS/MICROSOFT.MEDIA/VIDEOANALYZERS/{NAME}",
  "region": "westcentralus",
  "category": "Operational",
  "operationName": "Microsoft.VideoAnalyzer.Operational.RecordingStarted",
  "operationVersion": "1.0",
  "level": "Informational",
  "correlationId": "c7887efd-0043-4ada-aa3d-9a411e612497",
  "traceContext": "{\n  \"traceId\": \"e74a9d4c-c4b9-4024-9acf-06be76d978ad\"\n}",
  "properties": {
    "subject": "/livePipelines/livepipeline/sinks/videoSink",
    "body": {
      "type": "video",
      "location": "/videos/livetest1",
      "startTime": "2021-10-06T21:19:32.520Z"
    }
  }
}
Diagnostics: Events that help to diagnose problems and/or performance.
- Volume: Can be high (several times a minute), it could also impact storage cost. Recommended to only enable these events when diagnosis is needed or for troubleshooting purposes. Examples:
| Event | Level | Short Description |
|---|---|---|
| AuthenticationError | Error | Server/client authentication error |
| AuthorizationError | Error | Server/client authorization error |
| FormatError | Error | Packaging, format, or encoding issues |
| MediaSessionEstablished | Informational | SDP or other session information |
| NetworkError | Error | DNS, network error |
| ProtocolError | Error | RTSP or any other protocol error |
| StorageError | Error | Storage read/write error |
| RtspPlaybackSessionEstablished | Informational | RTSP playback session is established |
| RtspPlaybackSessionClosed | Informational | RTSP playback session is closed |
Sample diagnostic event
{
  "time": "2021-10-06T21:19:34.1290000Z",
  "resourceId": "/SUBSCRIPTIONS/{SUBID}/RESOURCEGROUPS/{RGNAME}/PROVIDERS/MICROSOFT.MEDIA/VIDEOANALYZERS/{NAME}",
  "region": "westcentralus",
  "category": "Diagnostics",
  "operationName": "Microsoft.VideoAnalyzer.Diagnostics.MediaSessionEstablished",
  "operationVersion": "1.0",
  "level": "Informational",
  "traceContext": "{\n  \"traceId\": \"b03cabe2-b9d1-4be7-9770-4ac9e4fdc012\"\n}",
  "properties": {
    "subject": "/livePipelines/livepipesample/sources/rtspSource",
    "body": {
        "sdp": "SDP:\nv=0\r\no=- 0 0 IN IP4 127.0.0.1\r\ns=No Name\r\nt=0 0\r\na=tool:libavformat 58.76.100\r\nm=video 0 RTP/AVP 96\r\na=rtpmap:96 H264/90000\r\na=fmtp:96 packetization-mode=1; sprop-parameter-sets=XXXXXXXXXXXXXXXXXXXXXXXXXXXXXXXXXXX; profile-level-id=4D0029\r\na=control:streamid=0\r\n"
    }
  }
}
Audit: Event is used to log API access.
- Volume: Low, recommended to only enable these events when auditing is needed.
Sample audit event
{
  "time": "2021-10-07T23:53:31.6792370Z",
  "resourceId": "/SUBSCRIPTIONS/{SUBID}/RESOURCEGROUPS/{RGNAME}/PROVIDERS/MICROSOFT.MEDIA/VIDEOANALYZERS/{NAME}",
  "region": "westcentralus",
  "category": "Audit",
  "operationName": "Microsoft.VideoAnalyzer.Audit.ResourceGet",
  "level": "Warning",
  "uri": "https://{GUID}.api.{region}.videoanalyzer.azure.net/videos/batchjobsinknode",
  "resultType": "Failed",
  "resultSignature": "403",
  "identity": [
    {
      "alg": "RS256",
      "kid": "{KID}",
      "typ": "JWT"
    },
    {
      "sub": "livetest1",
      "aud": [ "https://{GUID}.streaming.{region}.videoanalyzer.azure.net/{GUID}", "wss://{GUID}.rtsp-tunnel.{region}.videoanalyzer.azure.net/{GUID}" ],
      "exp": 1633410145,
      "iss": "https://{region}.videoanalyzer.azure.net/"
    }
  ],
  "traceContext": "{\n  \"traceId\": \"4bb0dcf5-5c6d-4aa3-8c03-3f3d7e2c6210\"\n}",
  "properties": { "subject": "/videos/batchjobsinknodesample" }
}
Metrics
The Video Analyzer service generates metrics for pipelines. You can access the metrics using the Azure portal, by navigating to the Monitoring section from the management pane of your Video Analyzer account.
| Metric name | Type | Dimension | Description |
|---|---|---|---|
| Ingress Bytes | Counter | Pipeline Kind , State, Topology Name | The total number of bytes received by a pipeline. Only supported for RTSP sources. |
| Pipelines | Counter | Pipeline Kind , State, Topology Name | Provides the pipelines in different states. Emitted at a regular interval. |
Monitoring of events
You can save the events generated by the Video Analyzer service to your storage account and consume them using Azure monitor.
Azure Monitor events collection
Video Analyzer service currently supports writing of telemetry events to a storage account and the use of Azure Monitor to consume those events. Use Azure Monitor to consume events generated by service, customers have a built-in monitoring experience via Azure Monitor.
Follow the steps to enable monitoring and events collection with Azure Monitor:
On Azure portal navigate to Monitoring section of your Video Analyzer account then select Diagnostic settings.
Click on Add Diagnostic setting to enable the collection of the following logs:
- Operational
- Diagnostics
- Audit
Select the logs category that you would like to enable and corresponding retention period.
For destination details, select Archive to a storage account and specify the storage account where these event logs will be stored.
Important
Video Analyzer service currently does not support sending diagnostics to destinations other than Azure storage.
Click Save after configuring the diagnostic settings
To access the diagnostic logs, navigate to storage explorer then expand your storage account and you will see Blob containers. The 'insights-logs-category' container will have logs in a JSON file format.
Download the desired log file and content of the downloaded log file would look similar to sample below:
{
    "time": "2021-10-06T21:19:36.0988630Z",
    "resourceId": "/SUBSCRIPTIONS/{SUBID}/RESOURCEGROUPS/{RGNAME}/PROVIDERS/MICROSOFT.MEDIA/VIDEOANALYZERS/{NAME}",
    "region": "westcentralus",
    "category": "Operational",
    "operationName": "Microsoft.VideoAnalyzer.Operational.RecordingStarted",
    "operationVersion": "1.0",
    "level": "Informational",
    "correlationId": "c7887efd-0043-4ada-aa3d-9a411e612497",
    "traceContext": "{\n  \"traceId\": \"e74a9d4c-c4b9-4024-9acf-06be76d978ad\"\n}",
    "properties": {
        "subject": "/livePipelines/livepipesample/sinks/videoSink",
        "body": {
            "type": "video",
            "location": "/videos/livetest1",
            "startTime": "2021-10-06T21:19:32.520Z"
        }
    }
}
{
    "time": "2021-10-06T21:19:34.1290000Z",
    "resourceId": "/SUBSCRIPTIONS/{SUBID}/RESOURCEGROUPS/{RGNAME}/PROVIDERS/MICROSOFT.MEDIA/VIDEOANALYZERS/{NAME}",
    "region": "westcentralus",
    "category": "Diagnostics",
    "operationName": "Microsoft.VideoAnalyzer.Diagnostics.MediaSessionEstablished",
    "operationVersion": "1.0",
    "level": "Informational",
    "traceContext": "{\n  \"traceId\": \"b03cabe2-b9d1-4be7-9770-4ac9e4fdc012\"\n}",
    "properties": {
        "subject": "/livePipelines/livepipe/sources/rtspSource",
        "body": {
            "sdp": "SDP:\nv=0\r\no=- 0 0 IN IP4 127.0.0.1\r\ns=No Name\r\nt=0 0\r\na=tool:libavformat 58.76.100\r\nm=video 0 RTP/AVP 96\r\na=rtpmap:96 H264/90000\r\na=fmtp:96 packetization-mode=1; sprop-parameter-sets=XXXXXXXXXXXXXXXXXXXXXXXXXXXXXXXXXXX; profile-level-id=4D0029\r\na=control:streamid=0\r\n"
        }
    }
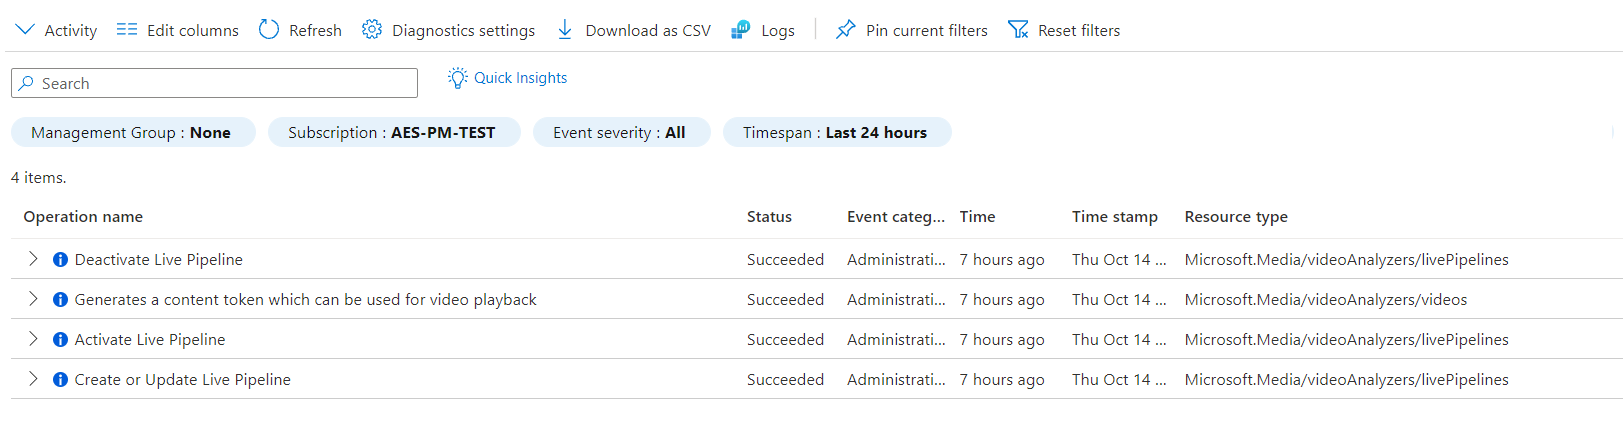
Activity log is also generated automatically for the pipeline operations and can be accessed by navigating to 'Activity log' section of Video Analyzer account on Azure portal. You can see the history of ARM API calls made to your account, and relevant details.