Monitor and log on IoT Edge
![]()
Alternatively, check out monitor and log in the service.
Note
Azure Video Analyzer has been retired and is no longer available.
Azure Video Analyzer for Media is not affected by this retirement. It is now rebranded to Azure Video Indexer. Click here to read more.
In this article, you'll learn how to receive events for remote monitoring from the Azure Video Analyzer IoT Edge module.
You'll also learn how to control the logs that the module generates.
Taxonomy of events
Video Analyzer built on top of IoT Edge emits events, or telemetry data, according to the following taxonomy:
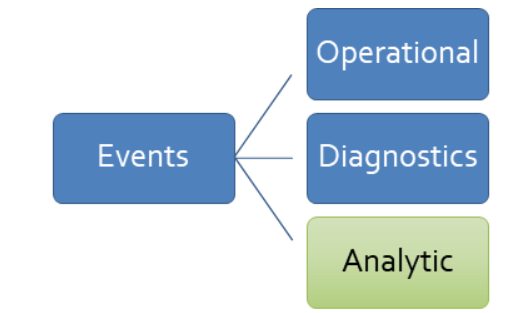
Operational: Events generated by the actions of a user or during the execution of a pipeline
Volume: Expected to be low (a few times a minute, or even less)
Examples:
Live pipeline activated
Live pipeline deactivated
Sample operational event
{
   "body": {
       "outputType": "filePath",
       "outputLocation": "/var/media/Sample-1-fileSink/sampleFilesFromEVR-motion-fileSinkOutput-20210426T181911Z.mp4"
     },
     "properties": {
       "topic": "/subscriptions/XXXXXXXX-XXXX-XXXX-XXXX-XXXXXXXXXXXX/resourceGroups/<my-resource-group>/providers/Microsoft.Media/videoAnalyzers/<account-name>",
       "subject": "/edgeModules/avaedge/livePipelines/Sample-Pipeline-1/sinks/fileSink",
       "eventType": "Microsoft.VideoAnalyzer.Operational.RecordingStarted",
       "eventTime": "2021-04-26T18:19:13.298Z",
       "dataVersion": "1.0"
    },
}
Diagnostics: Events that help to diagnose problems with performance
Volume: Can be high (several times a minute)
Examples:
- RTSP SDP information (shown in the following example)
- Errors for when a connection to something like a camera or AI extension fails
Sample diagnostic event
{
  "body": {
    "sdp": "SDP:\nv=0\r\no=- 1589326384077235 1 IN IP4 XXX.XX.XX.XXX\r\ns=Matroska video+audio+(optional)subtitles, streamed by the LIVE555 Media Server\r\ni=media/lots_015.mkv\r\nt=0 0\r\na=tool:LIVE555 Streaming Media v2020.04.12\r\na=type:broadcast\r\na=control:*\r\na=range:npt=0-73.000\r\na=x-qt-text-nam:Matroska video+audio+(optional)subtitles, streamed by the LIVE555 Media Server\r\na=x-qt-text-inf:media/lots_015.mkv\r\nm=video 0 RTP/AVP 96\r\nc=IN IP4 0.0.0.0\r\nb=AS:500\r\na=rtpmap:96 H264/90000\r\na=fmtp:96 packetization-mode=1;profile-level-id=640028;sprop-parameter-sets=XXXXXXXXXXXXXXXXXXXXXXXXXXXXXXXXXXX\r\na=control:track1\r\n"
  },
  "applicationProperties": {
    "topic": "/subscriptions/XXXXXXXX-XXXX-XXXX-XXXX-XXXXXXXXXXXX/resourceGroups/<my-resource-group>/providers/Microsoft.Media/videoAnalyzers/<account-name>",
    "subject": "/edgeModules/avaedge/livePipelines/Sample-Pipeline-1/sources/rtspSource",
    "eventType": "Microsoft.VideoAnalyzer.Diagnostics.MediaSessionEstablished",
    "eventTime": "2021-04-26T18:15:13.298Z",
    "dataVersion": "1.0"
  }
}
Analytic: Events generated as a result of video analysis
Volume: Can be high (several times a minute or more)
Examples:
Motion detected (shown in the following example)
Inference result
Sample analytic event
{
  "body": {
    "timestamp": 143039375044290,
    "inferences": [
      {
        "type": "motion",
        "motion": {
          "box": {
            "l": 0.48954,
            "t": 0.140741,
            "w": 0.075,
            "h": 0.058824
          }
        }
      }
    ]
  },
  "applicationProperties": {
    "topic": "/subscriptions/XXXXXXXX-XXXX-XXXX-XXXX-XXXXXXXXXXXX/resourceGroups/<my-resource-group>/providers/Microsoft.Media/videoAnalyzers/<account-name>",
    "subject": "/edgeModules/avaedge/livePipelines/Sample-Pipeline-1/processors/md",
    "eventType": "Microsoft.VideoAnalyzer.Analytics.Inference",
    "eventTime": "2021-04-26T18:15:13.298Z",
    "dataVersion": "1.0"
  }
}
The events emitted by the module are sent to the IoT Edge hub. From there, they can be routed to other destinations.
Events and video playback
As indicated above, events generated as part of video analysis have an eventTime associated with them. If you recorded the live video as part of your pipeline topology, these help you locate where in the recorded video the particular event occurred. You can load the video recording in the Video Analyzer player widget, and use its controls to seek to the date and time of interest. If your pipeline involved the use of an AI model to generate inference results, then you should be recording the inference data along with the video. This will enable you to play back the inference metadata along with the video as shown in this tutorial.
Routing events
You can use the following module twin properties to route the operational and diagnostic events published by the Video Analyzer module. These properties are documented in the module twin JSON schema.
diagnosticsEventsOutputName: To get diagnostic events from the module, include this property and provide any value for it. Omit it or leave it empty to stop the module from publishing diagnostic events.operationalEventsOutputName: To get operational events from the module, include this property and provide any value for it. Omit it or leave it empty to stop the module from publishing operational events.
Diagnostic and operational events are automatically emitted by nodes like the motion detection processor or an extension processor. Analytic events must be routed within a pipeline to an IoT hub message sink in order to be sent to the IoT Edge hub.
You can control the routing of all the preceding events by using the desired property of the $edgeHub module twin in the deployment manifest:
 "$edgeHub": {
   "properties.desired": {
     "schemaVersion": "1.1",
     "routes": {
       "moduleToHub": "FROM /messages/modules/avaedge/outputs/* INTO $upstream"
     },
     "storeAndForwardConfiguration": {
       "timeToLiveSecs": 7200
     }
   }
 }
In the preceding JSON, avaedge is the name of the Video Analyzer module. The routing rule follows the schema defined in Declare routes.
Note
To ensure that analytic events reach the IoT Edge hub, you must have an IoT hub message sink node downstream of any motion detection processor node and/or any extension processor node.
Event schema
Events that originate on the edge device can be consumed at the edge or in the cloud. Events generated by Video Analyzer conform to the streaming messaging pattern established by Azure IoT Hub. The pattern consists of system properties, application properties, and a body.
Summary
Every event, when observed via IoT Hub, has a set of common properties:
| Property | Property type | Data type | Description |
|---|---|---|---|
message-id |
system | guid | Unique event ID. |
topic |
applicationProperty | string | Azure Resource Manager path for the Azure Video Analyzer account. |
subject |
applicationProperty | string | Subpath of the entity emitting the event. |
eventTime |
applicationProperty | string | Time the event was generated. |
eventType |
applicationProperty | string | Event type identifier. (See the following section.) |
body |
body | object | Particular event data. |
dataVersion |
applicationProperty | string | {Major}.{Minor} |
Properties
message-id
A globally unique identifier (GUID) for the event.
topic
Represents the Video Analyzer edge module that generated the event. Example:
/subscriptions/{subId}/resourceGroups/{rgName}/providers/Microsoft.Media/videoAnalyzers/{accountName}
subject
The entity that's emitting the event. Examples:
/edgeModules/avaedge/livePipelines/{livePipelineName}
/edgeModules/avaedge/livePipelines/{livePipelineName}/sources/{nodeName}
/edgeModules/avaedge/livePipelines/{livePipelineName}/processors/{nodeName}
/edgeModules/avaedge/livePipelines/{livePipelineName}/sinks/{nodeName}
The subject property allows you to map generic events to the node in the live pipeline that emitted the event. For example, for an invalid RTSP user name or password, the generated event would be Microsoft.VideoAnalyzer.Diagnostics.ProtocolError from the /edgeModules/avaedge/livePipelines/Sample-Pipeline-1/sources/rtspSource node.
eventType
Event types are assigned to a namespace according to this schema:
Microsoft.VideoAnalyzer.{EventClass}.{EventType}
The event class may be one of the following:
| Class name | Description |
|---|---|
| Analytics | Events generated as part of content analysis. |
| Diagnostics | Events that help with the diagnostics of problems and performance. |
| Operational | Events generated as part of resource operation. |
Examples:
Microsoft.VideoAnalyzer.Analytics.InferenceMicrosoft.VideoAnalyzer.Diagnostics.AuthorizationErrorMicrosoft.VideoAnalyzer.Operational.RecordingStarted
eventTime
Event time is formatted in an ISO 8601 string. It represents the time when the event occurred.
Example:
2021-04-26T18:15:13.298Z
Metrics
These metrics will be reported from the Video Analyzer module through a Prometheus endpoint running on port 9600 of the module.
| Metric name | Type | Labels | Description |
|---|---|---|---|
| va_active_live_pipelines | Gauge | iothub, edge_device, module_name, pipeline_topology | Total number of active live pipelines per topology. |
| va_cumulative_latency_seconds_average | Gauge | iothub, edge_device, module_name, pipeline_topology, live_pipeline, node | The average latency from when a video frame has been received by a source to when it leaves the node over the last minute. This is not reported if there were no frames. |
| va_cumulative_latency_seconds_max | Gauge | iothub, edge_device, module_name, pipeline_topology, live_pipeline, node | The maximum latency from when a video frame has been received by a source to when it leaves the node over the last minute. This is not reported if there were no frames. |
| va_data_dropped_total | Counter | iothub, edge_device, module_name, pipeline_topology, live_pipeline, node, data_kind | Counter of any dropped data (events, media, and so on). |
| va_received_bytes_total | Counter | iothub, edge_device, module_name, pipeline_topology, live_pipeline, node | Total number of bytes received by a node. Supported only for RTSP sources. |
Note
If you name your Video Analyzer module avaedge, the metrics can be accessed by sending a GET request to http://avaedge:9600/metrics. Depending on your deployment, you may need to map this port to the device for it to be reachable.
Azure Monitor collection via Telegraf
Follow these steps to enable the collection of metrics from the Video Analyzer module. The metrics will be collected by Telegraf, then uploaded to Azure Monitor as a custom metric. In Telegraf, the logs are scraped by the Prometheus plugin, and uploaded by the azure_monitor plugin.
The agent can be used to collect metrics from any module which exposes a Prometheus endpoint.
Create a folder on your development computer, and go to that folder.
In the folder, create a
telegraf.tomlfile that contains the following configurations:[agent] interval = "30s" omit_hostname = true [[inputs.prometheus]] metric_version = 2 urls = ["http://edgeHub:9600/metrics", "http://edgeAgent:9600/metrics", "http://{AVA_EDGE_MODULE_NAME}:9600/metrics"] [[outputs.azure_monitor]] namespace_prefix = "{AVA_EDGE_MODULE_NAME}" region = "westus2" resource_id = "/subscriptions/{SUBSCRIPTON_ID}/resourceGroups/{RESOURCE_GROUP}/providers/Microsoft.Devices/IotHubs/{IOT_HUB_NAME}"Important
Be sure to replace the variables in the .toml file. The variables are denoted by braces (
{}). In addition, update the value ofregion.In the same folder, create a Dockerfile that contains the following commands:
FROM telegraf:1.15.3-alpine
COPY telegraf.toml /etc/telegraf/telegraf.conf
Use Docker CLI commands to build the Docker file and publish the image to your Azure container registry.
For more information about using the Docker CLI to push to a container registry, see Push and pull Docker images. For information about Azure Container Registry, see the documentation.
# Insert your own container image URL
docker build . -t myregistry.azurecr.io/telegraf_agent
docker push myregistry.azurecr.io/telegraf_agent
After the push to Azure Container Registry is complete, add the following node to your deployment manifest file:
"telegraf":
{
  "settings":
    {
        "image": "{AZURE_CONTAINER_REGISTRY_URL_OF_YOUR_TELEGRAF_IMAGE}"
    },
    "type": "docker",
    "version": "1.0",
    "status": "running",
    "restartPolicy": "always",
    "env":
    {
        "AZURE_TENANT_ID": { "value": "{YOUR_TENANT_ID}" },
        "AZURE_CLIENT_ID": { "value": "{YOUR CLIENT_ID}" },
        "AZURE_CLIENT_SECRET": { "value": "{YOUR_CLIENT_SECRET}" }
    }
}
Important
Be sure to replace the variables in the manifest file. The variables are denoted by braces (
{}).Azure Monitor can be authenticated via service principal.
The Azure Monitor Telegraf plug-in exposes several methods of authentication.
To use service principal authentication, set these environment variables:
AZURE_TENANT_ID: Specifies the tenant to authenticate to.
AZURE_CLIENT_ID: Specifies the app client ID to use.
AZURE_CLIENT_SECRET: Specifies the app secret to use.Tip
You can give the service principal the Monitoring Metrics Publisher role. Follow the steps in Create service principal to create the service principal and assign the role .
After the modules are deployed, metrics will appear in Azure Monitor under a single namespace. Metric names will match the ones emitted by Prometheus.
In this case, in the Azure portal, go to the IoT hub and select Metrics in the left pane. You should see the metrics there.
Log Analytics metrics collection
Using Prometheus endpoint along with Log Analytics, you can generate and monitor metrics such as used CPUPercent, MemoryUsedPercent, etc.
Note
The configuration below does not collect logs, only metrics. It is feasible to extend the collector module to also collect and upload logs.

Learn how to collect metrics
Use Docker CLI commands to build the Docker file and publish the image to your Azure container registry.
For more information about using the Docker CLI to push to a container registry, see Push and pull Docker images. For other information about Azure Container Registry, see the documentation.
After the push to Azure Container Registry is complete, the following is inserted into the deployment manifest:
"azmAgent": {
  "settings": {
    "image": "{AZURE_CONTAINER_REGISTRY_URL_OF_YOUR_METRICS_COLLECTOR}"
  },
  "type": "docker",
  "version": "1.0",
  "status": "running",
  "restartPolicy": "always",
  "env": {
    "LogAnalyticsWorkspaceId": { "value": "{YOUR_LOG_ANALYTICS_WORKSPACE_ID}" },
    "LogAnalyticsSharedKey": { "value": "{YOUR_LOG_ANALYTICS_WORKSPACE_SECRET}" },
    "LogAnalyticsLogType": { "value": "IoTEdgeMetrics" },
    "MetricsEndpointsCSV": { "value": "http://edgeHub:9600/metrics,http://edgeAgent:9600/metrics,http://avaedge:9600/metrics" },
    "ScrapeFrequencyInSecs": { "value": "30 " },
    "UploadTarget": { "value": "AzureLogAnalytics" }
  }
}
Note
The modules
edgeHub,edgeAgentandavaedgeare the names of the modules defined in the deployment manifest file. Please make sure that the names of the modules match.You can get your
LogAnalyticsWorkspaceIdandLogAnalyticsSharedKeyvalues by following these steps:- Go to the Azure portal
- Look for your Log Analytics workspaces
- Once you find your Log Analytics workspace, navigate to the
Agents managementoption in the left navigation pane. - You will find the Workspace ID and the Secret Keys that you can use.
Next, create a workbook by clicking on the
Workbookstab in the left navigation pane.Using Kusto query language, you can write queries as below and get CPU percentage used by the IoT Edge modules.
let cpu_metrics = IoTEdgeMetrics_CL
| where Name_s == "edgeAgent_used_cpu_percent"
| extend dimensions = parse_json(Tags_s)
| extend module_name = tostring(dimensions.module_name)
| where module_name in ("avaedge","yolov3","tinyyolov3")
| summarize cpu_percent = avg(Value_d) by bin(TimeGenerated, 5s), module_name;
cpu_metrics
| summarize cpu_percent = sum(cpu_percent) by TimeGenerated
| extend module_name = "Total"
| union cpu_metrics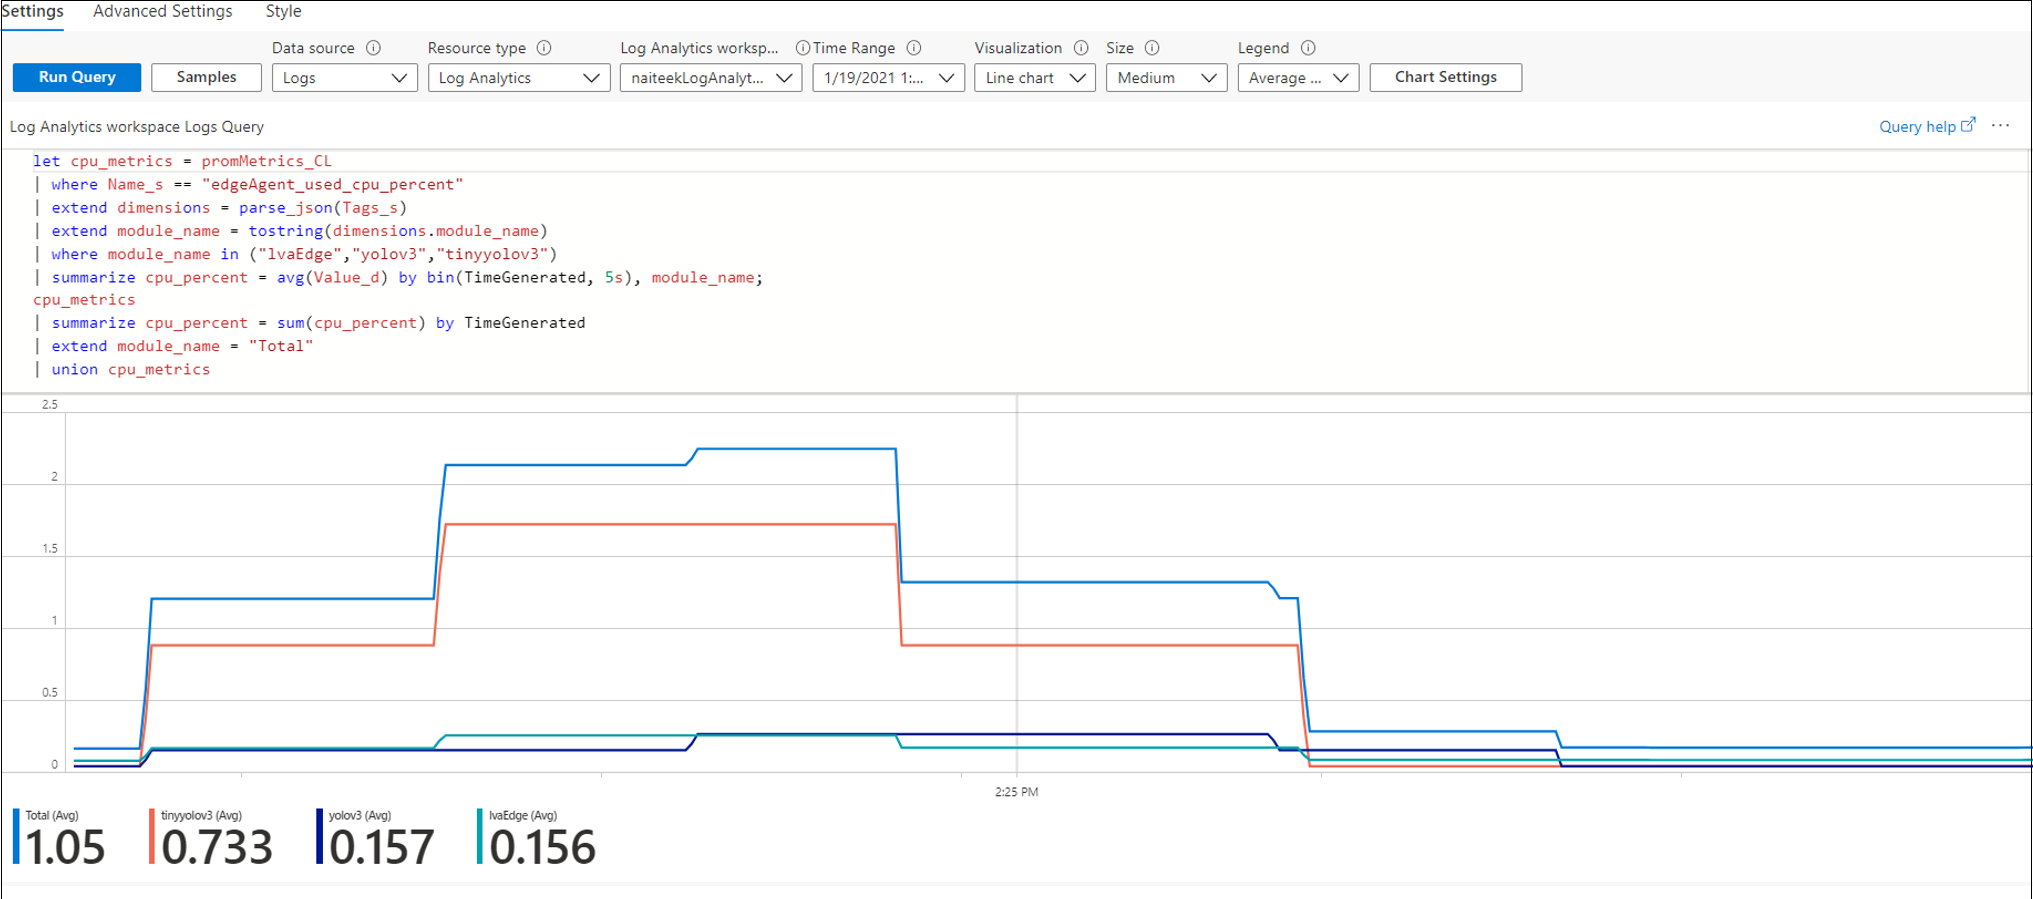

Logging
As with other IoT Edge modules, you can also examine the container logs on the edge device. You can configure the information that's written to the logs by using the following module twin properties:
logLevel- Allowed values are
Verbose,Information,Warning,Error, andNone. - The default value is
Information. The logs will contain error, warning, and information messages. - If you set the value to
Warning, the logs will contain error and warning messages. - If you set the value to
Error, the logs will contain only error messages. - If you set the value to
None, no logs will be generated. This is not recommended. - Use
Verboseonly if you need to share logs with Azure support to diagnose a problem.
- Allowed values are
logCategories- A comma-separated list of one or more of these values:
Application,Events,MediaPipeline. - The default value is
Application, Events. Application: High-level information from the module, like module startup messages, environment errors, and direct method calls.Events: All the events that were described earlier in this article.MediaPipeline: Low-level logs that might offer insight when you're troubleshooting problems, like difficulties establishing a connection with an RTSP-capable camera.
- A comma-separated list of one or more of these values:
Generating debug logs
In certain cases, to help Azure support resolve a problem, you might need to generate more detailed logs than the ones described previously. To generate these logs:
Sign in to the Azure portal, and go to your IoT hub.
On the left pane, select IoT Edge.
In the list of devices, select the ID of the target device.
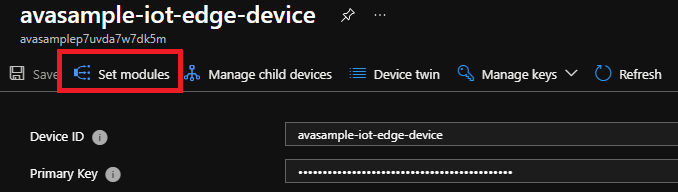
At the top of the pane, select Set Modules.
In the IoT Edge Modules section, look for and select avaedge.
Select Module Identity Twin. An editable pane opens.
Under desired key, add the following key/value pair:
"DebugLogsDirectory": "/var/lib/videoanalyzer/logs"Note
This command binds the logs folders between the Edge device and the container. If you want to collect the logs in a different location on the device:
- Create a binding for the Debug Log location in the Binds section, replacing the $DEBUG_LOG_LOCATION_ON_EDGE_DEVICE and $DEBUG_LOG_LOCATION with the location you want:
/var/$DEBUG_LOG_LOCATION_ON_EDGE_DEVICE:/var/$DEBUG_LOG_LOCATION - Use the following command, replacing $DEBUG_LOG_LOCATION with the location used in the previous step:
"DebugLogsDirectory": "/var/$DEBUG_LOG_LOCATION"
- Create a binding for the Debug Log location in the Binds section, replacing the $DEBUG_LOG_LOCATION_ON_EDGE_DEVICE and $DEBUG_LOG_LOCATION with the location you want:
Select Save
The module will now write debug logs in a binary format to the device storage path /var/local/videoAnalyzer/debuglogs/. You can share these logs with Azure support.
You can stop log collection by setting the value in Module Identity Twin to null. Go back to the Module Identity Twin page and update the following parameter as:
"DebugLogsDirectory": ""
FAQ
If you have questions, see the monitoring and metrics FAQ.