Tutorial: Detect when objects cross a virtual line in a live video
![]()
Alternatively, check out topics under Create video applications in the service.
Note
Azure Video Analyzer has been retired and is no longer available.
Azure Video Analyzer for Media is not affected by this retirement. It is now rebranded to Azure Video Indexer. Click here to read more.
This tutorial shows you how to use Azure Video Analyzer detect when objects cross a virtual line in a live video feed from a (simulated) IP camera. You will see how to apply a computer vision model to detect objects in a subset of the frames in the live video feed. You can then use an object tracker node to track those objects in the other frames and send the results to a line crossing node.
The line crossing node enables you to detect when objects cross the virtual line. The events contain the direction (clockwise, counterclockwise) and a total counter per direction.
This tutorial uses an Azure VM as an IoT Edge device, and it uses a simulated live video stream.
Prerequisites
An Azure account that includes an active subscription. Create an account for free if you don't already have one.
Note
You will need an Azure subscription where you have access to both Contributor role, and User Access Administrator role. If you do not have the right permissions, please reach out to your account administrator to grant you those permissions.
Visual Studio Code, with the following extensions:
Tip
When you're installing the Azure IoT Tools extension, you might be prompted to install Docker. Feel free to ignore the prompt.
Set up Azure resources
The deployment process will take about 20 minutes. Upon completion, you will have certain Azure resources deployed in the Azure subscription, including:
- Video Analyzer account - This cloud service is used to register the Video Analyzer edge module, and for playing back recorded video and video analytics.
- Storage account - For storing recorded video and video analytics.
- Managed Identity - This is the user assigned managed identity used to manage access to the above storage account.
- Virtual machine - This is a virtual machine that will serve as your simulated edge device.
- IoT Hub - This acts as a central message hub for bi-directional communication between your IoT application, IoT Edge modules and the devices it manages.
In addition to the resources mentioned above, following items are also created in the 'deployment-output' file share in your storage account, for use in quickstarts and tutorials:
- appsettings.json - This file contains the device connection string and other properties needed to run the sample application in Visual Studio Code.
- env.txt - This file contains the environment variables that you will need to generate deployment manifests using Visual Studio Code.
- deployment.json - This is the deployment manifest used by the template to deploy edge modules to the simulated edge device.
Tip
If you run into issues creating all of the required Azure resources, please use the manual steps in this quickstart.
Overview
![]()
This diagram shows how the signals flow in this tutorial. An edge module simulates an IP camera hosting a Real-Time Streaming Protocol (RTSP) server. An RTSP source node pulls the video feed from this server and sends video frames to the HTTP extension processor node.
The HTTP extension node plays the role of a proxy. It converts every 10th video frame to the specified image type. Then it relays the image over HTTP to another edge module that runs an AI model behind an HTTP endpoint. In this example, that edge module is built by using the YOLOv3 model, which can detect many types of objects. The HTTP extension processor node gathers the detection results and sends these results and all the video frames (not just the 10th frame) to the object tracker node. The object tracker node uses optical flow techniques to track the object in the 9 frames that did not have the AI model applied to them. The tracker node publishes its results to the IoT Hub message sink node. This IoT Hub message sink node then sends those events to IoT Edge Hub.
The line crossing node will receive the results from the upstream object tracker node. The output of the object tracker node contains the coordinates of the detected objects. These coordinates are evaluated by the line crossing node against the line coordinates. When objects cross the line, the line crossing node will emit an event. The events are sent to the IoT Edge Hub message sink.
In this tutorial, you will:
- Setup your development environment.
- Deploy the required edge modules.
- Create and deploy the live pipeline.
- Interpret the results.
- Understand how to calculate coordinates.
- Clean up resources.
Set up your development environment
Get the sample code
Clone the AVA C# samples repository.
Start Visual Studio Code, and open the folder where the repo has been downloaded.
In Visual Studio Code, browse to the src/cloud-to-device-console-app folder and create a file named appsettings.json. This file contains the settings needed to run the program.
Browse to the file share in the storage account created in the setup step above, and locate the appsettings.json file under the "deployment-output" file share. Click on the file, and then hit the "Download" button. The contents should open in a new browser tab, which should look like:
{
    "IoThubConnectionString" : "HostName=xxx.azure-devices.net;SharedAccessKeyName=iothubowner;SharedAccessKey=XXX",
    "deviceId" : "avasample-iot-edge-device",
    "moduleId" : "avaedge"
}
The IoT Hub connection string lets you use Visual Studio Code to send commands to the edge modules via Azure IoT Hub. Copy the above JSON into the src/cloud-to-device-console-app/appsettings.json file.
Next, browse to the src/edge folder and create a file named .env. This file contains properties that Visual Studio Code uses to deploy modules to an edge device.
Browse to the file share in the storage account created in the setup step above, and locate the env.txt file under the "deployment-output" file share. Click on the file, and then hit the "Download" button. The contents should open in a new browser tab, which should look like:
     SUBSCRIPTION_ID="<Subscription ID>"
     RESOURCE_GROUP="<Resource Group>"
     AVA_PROVISIONING_TOKEN="<Provisioning token>"
     VIDEO_INPUT_FOLDER_ON_DEVICE="/home/localedgeuser/samples/input"
     VIDEO_OUTPUT_FOLDER_ON_DEVICE="/var/media"
     APPDATA_FOLDER_ON_DEVICE="/var/lib/videoanalyzer"
     CONTAINER_REGISTRY_USERNAME_myacr="<your container registry username>"
     CONTAINER_REGISTRY_PASSWORD_myacr="<your container registry password>"
Copy the JSON from your env.txt into the src/edge/.env file.
Connect to the IoT Hub
In Visual Studio Code, set the IoT Hub connection string by selecting the More actions icon next to the AZURE IOT HUB pane in the lower-left corner. Copy the string from the src/cloud-to-device-console-app/appsettings.json file.
Note
You might be asked to provide Built-in endpoint information for the IoT Hub. To get that information, in Azure portal, navigate to your IoT Hub and look for Built-in endpoints option in the left navigation pane. Click there and look for the Event Hub-compatible endpoint under Event Hub compatible endpoint section. Copy and use the text in the box. The endpoint will look something like this:
Endpoint=sb://iothub-ns-xxx.servicebus.windows.net/;SharedAccessKeyName=iothubowner;SharedAccessKey=XXX;EntityPath=<IoT Hub name>In about 30 seconds, refresh Azure IoT Hub in the lower-left section. You should see the edge device
avasample-iot-edge-device, which should have the following modules deployed:- Edge Hub (module name edgeHub)
- Edge Agent (module name edgeAgent)
- Video Analyzer (module name avaedge)
- RTSP simulator (module name rtspsim)
Prepare to monitor the modules
When you use run this quickstart or tutorial, events will be sent to the IoT Hub. To see these events, follow these steps:
Open the Explorer pane in Visual Studio Code, and look for Azure IoT Hub in the lower-left corner.
Expand the Devices node.
Right-click on
avasample-iot-edge-device, and select Start Monitoring Built-in Event Endpoint.Note
You might be asked to provide Built-in endpoint information for the IoT Hub. To get that information, in Azure portal, navigate to your IoT Hub and look for Built-in endpoints option in the left navigation pane. Click there and look for the Event Hub-compatible endpoint under Event Hub compatible endpoint section. Copy and use the text in the box. The endpoint will look something like this:
Endpoint=sb://iothub-ns-xxx.servicebus.windows.net/;SharedAccessKeyName=iothubowner;SharedAccessKey=XXX;EntityPath=<IoT Hub name>
Deploy the required modules
In Visual Studio Code, right-click the src/edge/deployment.yolov3.template.json file and then select Generate IoT Edge Deployment Manifest.
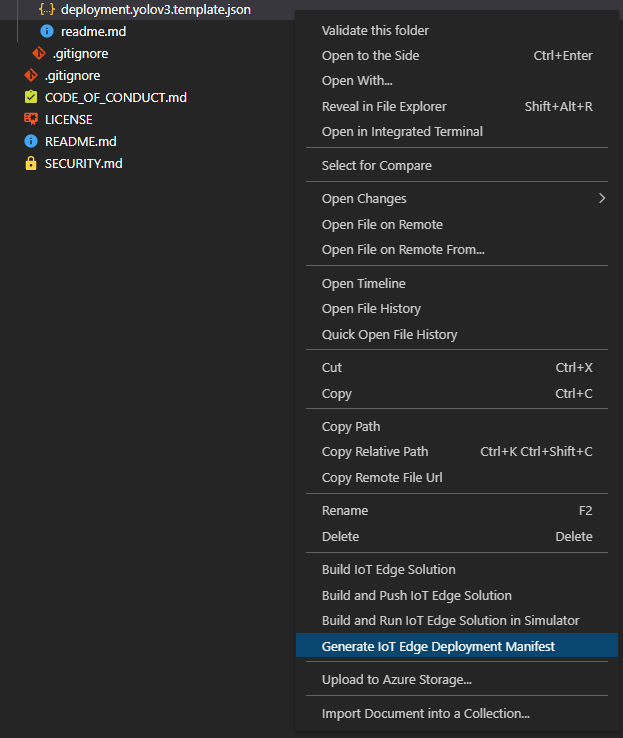
The deployment.yolov3.amd64.json manifest file is created in the src/edge/config folder.
Right-click src/edge/config/deployment.yolov3.amd64.json and select Create Deployment for Single Device.
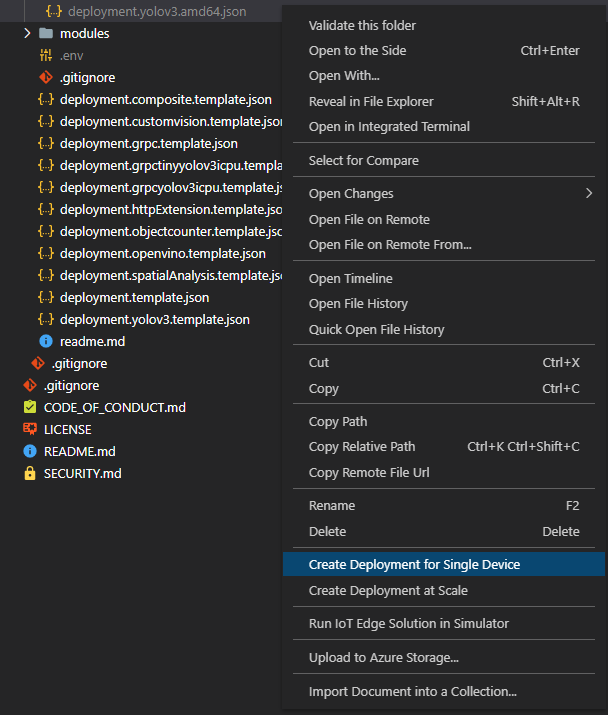
When you're prompted to select an IoT Hub device, select avasample-iot-edge-device.
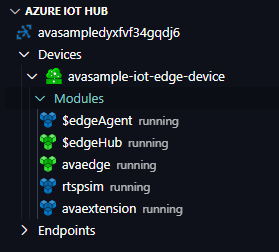
After about 30 seconds, in the lower-left corner of the window, refresh Azure IoT Hub. The edge device now shows the following deployed modules:
The Video Analyzer edge module, named avaedge.
The rtspsim module, which simulates an RTSP server and acts as the source of a live video feed.
The avaextension module, which is the YOLOv3 object detection model that applies computer vision to images and returns multiple classes of object types
Create and deploy the live pipeline
Review sample video
When you set up the Azure resources, a short video of highway traffic is copied to the Linux VM in Azure that you're using as the IoT Edge device. This tutorial uses the video file to simulate a live stream.
Open an application such as VLC media player. Select Ctrl+N and then paste a link to the highway intersection sample video to start playback. You see the footage of many vehicles moving in highway traffic.
Examine and edit the sample files
In Visual Studio Code, browse to the src/cloud-to-device-console-app folder. Here you'll see the appsettings.json file that you created along with a few other files:
- c2d-console-app.csproj: The project file for Visual Studio Code.
- operations.json: This file lists the different operations that you would run.
- Program.cs: The sample program code, which:
- Loads the app settings.
- Invokes direct methods exposed by Video Analyzer edge module. You can use the module to analyze live video streams by invoking its direct methods.
- Pauses for you to examine the output from the program in the TERMINAL window and the events generated by the module in the OUTPUT window.
- Invokes direct methods to clean up resources.
Edit the operations.json file:
- Change the link to the pipeline topology:
"pipelineTopologyUrl" : "https://raw.githubusercontent.com/Azure/video-analyzer/main/pipelines/live/topologies/line-crossing/topology.json"- Under
livePipelineSet, edit the name of the topology to match the value in the preceding link: "topologyName" : "LineCrossingWithHttpExtension"- Under
pipelineTopologyDelete, edit the name: "name" : "LineCrossingWithHttpExtension"
Open the URL for the pipeline topology in a browser, and examine the settings for the HTTP extension node.
   "samplingOptions":{
       "skipSamplesWithoutAnnotation":"false",
       "maximumSamplesPerSecond":"2"
   }
Here, skipSamplesWithoutAnnotation is set to false because the extension node needs to pass through all frames, whether or not they have inference results, to the downstream object tracker node. The object tracker is capable of tracking objects over 15 frames, approximately. Your AI model has a maximum FPS for processing, which is the highest value that maximumSamplesPerSecond should be set to.
Also look at the line crossing node parameter placeholders linecrossingName and lineCoordinates. We have provided default values for these parameters but you overwrite them using the operations.json file. Look at how we pass other parameters from the operations.json file to a topology (i.e. rtsp url).
Run the sample program
To start a debugging session, select the F5 key. You see messages printed in the TERMINAL window.
The operations.json code starts off with calls to the direct methods
pipelineTopologyListandlivePipelineList. If you cleaned up resources after you completed previous quickstarts/tutorials, then this process will return empty lists and then pause. To continue, select the Enter key.-------------------------------Executing operation pipelineTopologyList----------------------- Request: pipelineTopologyList -------------------------------------------------- { "@apiVersion": "1.1" } --------------- Response: pipelineTopologyList - Status: 200 --------------- { "value": [] } -------------------------------------------------------------------------- Executing operation WaitForInput Press Enter to continueThe TERMINAL window shows the next set of direct method calls:
- A call to
pipelineTopologySetthat uses the contents ofpipelineTopologyUrl - A call to
livePipelineSetthat uses the following body:
{ "@apiVersion": "1.1", "name": "Sample-Pipeline-1", "properties": { "topologyName": "LineCrossingWithHttpExtension", "description": "Sample pipeline description", "parameters": [ { "name": "rtspUrl", "value": "rtsp://rtspsim:554/media/camera-300s.mkv" }, { "name": "rtspUserName", "value": "testuser" }, { "name": "rtspPassword", "value": "testpassword" } ] } }- A call to
livePipelineActivatethat starts the live pipeline and the flow of video. - A second call to
livePipelineListthat shows that the live pipeline is in the running state.
- A call to
The output in the TERMINAL window pauses at a Press Enter to continue prompt. Don't select Enter yet. Scroll up to see the JSON response payloads for the direct methods you invoked.
Switch to the OUTPUT window in Visual Studio Code. You see messages that the Video Analyzer module is sending to the IoT hub. The following section of this tutorial discusses these messages.
The live pipeline continues to run and print results. The RTSP simulator keeps looping the source video. To stop the live pipeline, return to the TERMINAL window and select Enter.
The next series of calls cleans up resources:
- A call to
livePipelineDeactivatedeactivates the live pipeline. - A call to
livePipelineDeletedeletes the live pipeline. - A call to
pipelineTopologyDeletedeletes the pipeline topology. - A final call to
pipelineTopologyListshows that the list is empty.
- A call to
Interpret results
When you run the live pipeline, the results from the HTTP extension processor node pass through the IoT Hub message sink node to the IoT hub. The messages you see in the OUTPUT window contain a body section and an applicationProperties section. For more information, see Create and read IoT Hub messages.
In the following messages, the Video Analyzer module defines the application properties and the content of the body.
MediaSessionEstablished event
When a live pipeline is activated, the RTSP source node attempts to connect to the RTSP server that runs on the rtspsim-live555 container. If the connection succeeds, then the following event is printed. The event type is MediaSessionEstablished.
[IoTHubMonitor] [9:42:18 AM] Message received from [avasample-iot-edge-device/avaedge]:
{  "body": {
    "sdp": "SDP:\nv=0\r\no=- 1586450538111534 1 IN IP4 nnn.nn.0.6\r\ns=Matroska video+audio+(optional)subtitles, streamed by the LIVE555 Media Server\r\ni=media/cafetaria-01.mkv\r\nt=0 0\r\na=tool:LIVE555 Streaming Media v2020.03.06\r\na=type:broadcast\r\na=control:*\r\na=range:npt=0-300.000\r\na=x-qt-text-nam:Matroska video+audio+(optional)subtitles, streamed by the LIVE555 Media Server\r\na=x-qt-text-inf:media/camera-300s.mkv\r\nm=video 0 RTP/AVP 96\r\nc=IN IP4 0.0.0.0\r\nb=AS:500\r\na=rtpmap:96 H264/90000\r\na=fmtp:96 packetization-mode=1;profile-level-id=4D0029;sprop-parameter-sets=Z00AKeKQCgC3YC3AQEBpB4kRUA==,aO48gA==\r\na=control:track1\r\n"
  },
  "applicationProperties": {
    "dataVersion": "1.0",
    "topic": "/subscriptions/{subscriptionID}/resourceGroups/{name}/providers/microsoft.media/videoAnalyzers/{ava-account-name}",
    "subject": "/edgeModules/avaedge/livePipelines/Sample-Pipeline-1/sources/rtspSource",
    "eventType": "Microsoft.VideoAnalyzer.Diagnostics.MediaSessionEstablished",
    "eventTime": "2021-05-06T17:33:09.554Z",
    "dataVersion": "1.0"
  },
  }
}
In this message, notice these details:
- The message is a diagnostics event. MediaSessionEstablished indicates that the RTSP source node (the subject) connected with the RTSP simulator and has begun to receive a (simulated) live feed.
- In
applicationProperties, "subject" indicates that the message was generated from the RTSP source node in the live pipeline. - In
applicationProperties, "eventType" indicates that this event is a diagnostics event. - The "eventTime" indicates the time when the event occurred.
- The body contains data about the diagnostics event. In this case, the data comprises the Session Description Protocol (SDP) details.
Line crossing events
The HTTP extension processor node sends the 0th, 15th, 30th, … etc. frames to the avaextension module, and receives the inference results. It then sends these results and all video frames to the object tracker node. The object tracker generates inference results for all frames (0, 1, 2,...) which are then examined by the line crossing node against the line coordinates as specified in the topology. When objects cross these coordinates an events is triggered. The event looks like this:
{
  "body": {
    "timestamp": 145865319410261,
    "inferences": [
      {
        "type": "event",
        "subtype": "lineCrossing",
        "inferenceId": "8f4f7b25d6654536908bcfe34374a15e",
        "relatedInferences": [
          "c9ea5decdd6a487089ded249c748cf5b"
        ],
        "event": {
          "name": "LineCrossing1",
          "properties": {
            "counterclockwiseTotal": "35",
            "direction": "counterclockwise",
            "total": "38",
            "clockwiseTotal": "3"
          }
        }
      }
    ]
  },
In this message, notice these details:
- the type is
eventwith a subtype oflineCrossing. - The event contains the
nameas specified in the topology of the line that was crossed. - The
totalnumber of line crossings in any direction. - The number of
clockwiseTotalcrossings. - The number of
counterclockwiseTotalcrossings. - The
directioncontains the direction for this event.
Note
If you deployed Azure resources using the one-click deployment for this tutorial, a Standard DS1 Virtual Machine is created. However, to get accurate results from resource-intensive AI models like YOLO, you may have to increase the VM size. Resize the VM to increase number of vcpus and memory based on your requirement. Then, reactivate the live pipeline to view inferences.
Customize for your own environment
This tutorial will work with the provided sample video for which we have calculated the correct line coordinates of the line. When you examine the topology file you will see that the lineCoordinates parameter contains the following value:
[[0.5,0.1], [0.5,0.9]]
What does this value mean? When you want to draw a line on a 2D image you need two points, A and B, and between those points you will have an imaginary line. Each point will have its own x and y coordinates to determine where it is with respect to the full image resolution. In this case point A is [0.5,0.1] and point B is [0.5,0.9]. A visual representation of the that line looks like this:
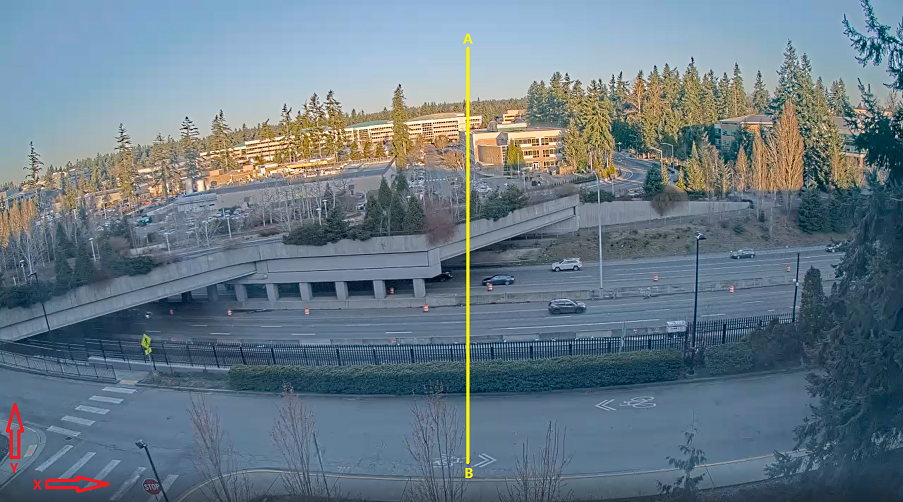
In this image you see the line between point A and point B. Any object that moves across the line will create an event with its properties like direction as discussed earlier in this tutorial. Also notice the x and y axis in the bottom left corner. This is just for illustration to explain how we normalize the coordinates to the values we expect for the line crossing node.
Here is an example calculation: Lets say that the video resolution is 1920 x 1080. 1920 and 1080 being the number of pixels along the x and y axis respectively. Create an image from a frame of the video you plan to use. Now open that image in an image editor program (i.e. MSPaint). Move you cursor to the location where you want to specify point A. In the bottom left corner you will see the x and y coordinates for that cursor position.
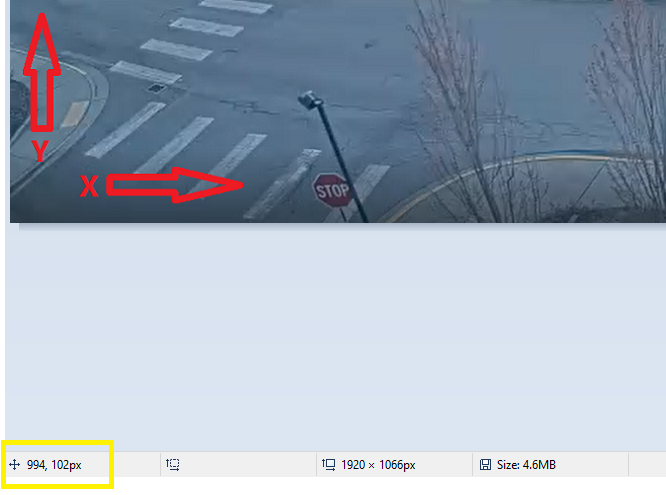
Note down these values and repeat the same for point B and note down the same values. By now you should have the x and y values for point A and the x and y values for point B. For example: point A: x=1024, y=96 Point B: x=1024, y=960 These values do not look like values that would go into the line crossing node since we need numbers between 0 and 1. To calculate this you apply the following formula:
x coordinate / image resolution along x axis, which, in our example is 1024/1920 = 0.5. Now do the same for y:96/1080=0.1. These are the normalized coordinates for point A. Repeat this for point B. You will end up with an array of values between 0 and 1 [[0.5,0.1], [0.5,0.9]] as shown earlier in this tutorial.
Clean up resources
If you want to try other quickstarts or tutorials, keep the resources that you created. Otherwise, go to the Azure portal, go to your resource groups, select the resource group where you ran this quickstart, and delete all the resources.
Next steps
- Try running different videos through the live pipeline.