Quickstart: Get started with Video Analyzer in the portal
![]()
Alternatively, check out get started with Video Analyzer live pipelines using portal.
Note
Azure Video Analyzer has been retired and is no longer available.
Azure Video Analyzer for Media is not affected by this retirement. It is now rebranded to Azure Video Indexer. Click here to read more.
This quickstart walks you through the steps to get started with Azure Video Analyzer. You'll create an Azure Video Analyzer account and its accompanying resources by using the Azure portal. You'll then deploy the Video Analyzer edge module and a Real Time Streaming Protocol (RTSP) camera simulator module to your Azure IoT Edge device.
After you complete the setup steps, you'll be able to run the simulated live video stream through a pipeline that detects and reports any motion in that stream. The following diagram graphically represents that pipeline.

Prerequisites
An active Azure subscription. If you don't have one, create a free account.
Note
You'll need an Azure subscription where you have access to both the Contributor role and the User Access Administrator role to the resource group under which you'll create new resources (user-assigned managed identity, storage account, Video Analyzer account). If you don't have the right permissions, ask your account administrator to grant you those permissions. The associated storage account must be in the same region as the Video Analyzer account. We recommend that you use a standard general-purpose v2 storage account.
An IoT Edge device on which you have admin privileges:
Visual Studio Code, with the Azure IoT Tools extension.
Tip
When you're installing the Azure IoT Tools extension, you might be prompted to install Docker. Feel free to ignore the prompt.
Prepare your IoT Edge device
The Azure Video Analyzer module should be configured to run on the IoT Edge device with a non-privileged local user account. The module needs certain local folders for storing application configuration data. The RTSP camera simulator module needs video files with which it can synthesize a live video feed.
Run the following command on your IoT Edge device:
bash -c "$(curl -sL https://aka.ms/ava-edge/prep_device)"
The prep-device script in that command automates the tasks of creating input and configuration folders, downloading video input files, and creating user accounts with correct privileges. After the command finishes successfully, you should see the following folders created on your edge device:
- /home/localedgeuser/samples
- /home/localedgeuser/samples/input
- /var/lib/videoanalyzer
- /var/media
The video (_.mkv) files in the _/home/localedgeuser/samples/input* folder are used to simulate live video.
Create Azure resources
The next step is to create the required Azure resources (Video Analyzer account, storage account, and user-assigned managed identity). Then you can create an optional container registry and register a Video Analyzer edge module with the Video Analyzer account.
When you create a Video Analyzer account, you have to associate an Azure storage account with it. If you use Video Analyzer to record the live video from a camera, that data is stored as blobs in a container in the storage account. You must use a managed identity to grant the Video Analyzer account the appropriate access to the storage account as follows.
Note
You'll need an Azure subscription where you have access to both the Contributor role and the User Access Administrator role to the resource group under which you'll create new resources (user-assigned managed identity, storage account, Video Analyzer account). If you don't have the right permissions, ask your account administrator to grant you those permissions. The associated storage account must be in the same region as the Video Analyzer account. We recommend that you use a standard general-purpose v2 storage account.
Create a Video Analyzer account in the Azure portal
Sign in at the Azure portal.
On the search bar at the top, enter Video Analyzer.
Select Video Analyzers under Services.
Select Add.
In the Create Video Analyzer account section, enter these required values:
- Subscription: Choose the subscription that you're using to create the Video Analyzer account.
- Resource group: Choose a resource group where you're creating the Video Analyzer account, or select Create new to create a resource group.
- Video Analyzer account name: Enter a name for your Video Analyzer account. The name must be all lowercase letters or numbers with no spaces, and 3 to 24 characters in length.
- Location: Choose a location to deploy your Video Analyzer account (for example, West US 2).
- Storage account: Create a storage account. We recommend that you select a standard general-purpose v2 storage account.
- User identity: Create and name a new user-assigned managed identity.
Select Review + create at the bottom of the form.
Create a container registry
- Select Create a resource > Containers > Container Registry.
- On the Basics tab, enter values for Resource group and Registry name. Use the same resource group from the previous sections. The registry name must be unique within Azure and contain 5 to 50 alphanumeric characters.
- Accept default values for the remaining settings. Then select Review + create. After you review the settings, select Create.
Deploy edge modules
Deploy the Video Analyzer edge module
- Go to your Video Analyzer account.
- Select Edge Modules in the Edge pane.
- Select Add edge modules, enter avaedge as the name for the new edge module, and select Add.
- The Copy the provisioning token page appears on the right side of your screen. Copy the following snippet under Recommended desired properties for IoT module deployment. You'll need it in a later step.
{ "applicationDataDirectory": "/var/lib/videoanalyzer", "ProvisioningToken": "XXXXXXX", "diagnosticsEventsOutputName": "diagnostics", "operationalEventsOutputName": "operational", "logLevel": "information", "LogCategories": "Application,Events", "allowUnsecuredEndpoints": true, "telemetryOptOut": false } - Go to your Azure IoT Hub account.
- Select IoT Edge under Automatic Device Management.
- Select the Device ID value for your IoT Edge device.
- Select Set modules.
- Select Add, and then select IoT Edge Module from the dropdown menu.
- Enter avaedge for IoT Edge Module Name.
- Copy and paste the following line into the Image URI field:
mcr.microsoft.com/media/video-analyzer:1. - Select Environment Variables.
- Under NAME, enter LOCAL_USER_ID. Under VALUE, enter 1010.
- On the second row under NAME, enter LOCAL_GROUP_ID. Under VALUE, enter 1010.
- Select Container Create Options and copy and paste the following lines:
{ "HostConfig": { "LogConfig": { "Type": "", "Config": { "max-size": "10m", "max-file": "10" } }, "Binds": [ "/var/media/:/var/media/", "/var/lib/videoanalyzer/:/var/lib/videoanalyzer" ], "IpcMode": "host", "ShmSize": 1536870912 } } - Select Module Twin Settings and paste the snippet that you copied earlier from the Copy the provisioning token page in the Video Analyzer account.
{ "applicationDataDirectory": "/var/lib/videoanalyzer", "ProvisioningToken": "XXXXXXX", "diagnosticsEventsOutputName": "diagnostics", "operationalEventsOutputName": "operational", "logLevel": "information", "LogCategories": "Application,Events", "allowUnsecuredEndpoints": true, "telemetryOptOut": false } - Select Add at the bottom of your screen.
- Select Routes.
- Under NAME, enter AVAToHub. Under VALUE, enter
FROM /messages/modules/avaedge/outputs/* INTO $upstream. - Select Review + create, and then select Create to deploy your avaedge edge module.
Deploy the edge module for the RTSP camera simulator
- Go to your IoT Hub account.
- Select IoT Edge under Automatic Device Management.
- Select the Device ID value for your IoT Edge device.
- Select Set modules.
- Select Add, and then select IoT Edge Module from the dropdown menu.
- Enter rtspsim for IoT Edge Module Name.
- Copy and paste the following line into the Image URI field:
mcr.microsoft.com/ava-utilities/rtspsim-live555:1.2. - Select Container Create Options and copy and paste the following lines:
{ "HostConfig": { "Binds": ["/home/localedgeuser/samples/input:/live/mediaServer/media"] } } - Select Add at the bottom of your screen.
- Select Review + create, and then select Create to deploy your rtspsim edge module.
Verify your deployment
On the device details page, verify that the avaedge and rtspsim modules are listed as both Specified in Deployment and Reported by Device.
It might take a few moments for the modules to be started on the device and then reported back to IoT Hub. Refresh the page to see an updated status. Status code 200 -- OK means that the IoT Edge runtime is healthy and is operating fine.

Set up your development environment
Obtain your IoT Hub connection string
- In the Azure portal, go to your IoT Hub account.
- Look for Shared access policies in the left pane and select it.
- Select the policy named iothubowner.
- Copy the Primary connection string value. It will look like
HostName=xxx.azure-devices.net;SharedAccessKeyName=iothubowner;SharedAccessKey=XXX.
Connect to IoT Hub
Open Visual Studio Code and select View > Explorer. Or, select Ctrl+Shift+E.
In the lower-left corner of the Explorer tab, select Azure IoT Hub.
Select the More Options icon to see the context menu. Then select Set IoT Hub Connection String.
When an input box appears, enter your IoT Hub connection string.
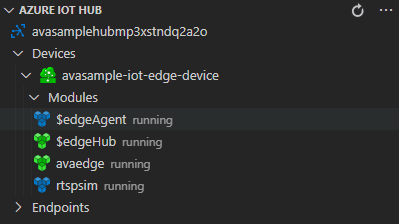
In about 30 seconds, refresh Azure IoT Hub in the lower-left section. You should see your device ID, which should have the following modules deployed:
- Video Analyzer edge module (module name avaedge)
- RTSP simulator (module name rtspsim)
Tip
If you have manually deployed Video Analyzer on an edge device (such as an ARM64 device), the module will appear under that device, under Azure IoT Hub. You can select that module and continue with the following steps.
Prepare to monitor the modules
When you use this quickstart, events will be sent to IoT Hub. To see these events, follow these steps:
In Visual Studio Code, open the Extensions tab (or select Ctrl+Shift+X) and search for Azure IoT Hub.
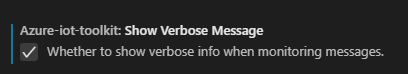
Right-click the IoT Hub extension and select Extension Settings.
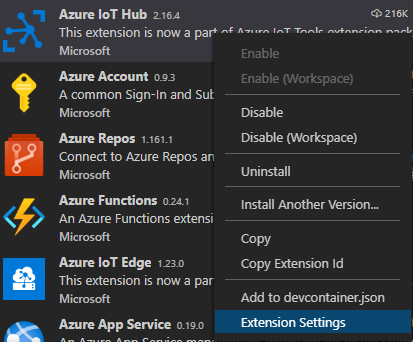
Search for and enable Show Verbose Message.
Open the Explorer pane in Visual Studio Code, and look for Azure IoT Hub in the lower-left corner.
Expand the Devices node.
Right-click your device ID, and select Start Monitoring Built-in Event Endpoint.
Note
You might be asked to provide built-in endpoint information for IoT Hub. To get that information, in the Azure portal, go to your IoT Hub account and look for Built-in endpoints in the left pane. Select it and look for the Event Hub-compatible endpoint section. Copy and use the text in the box. The endpoint will look something like this:
Endpoint=sb://iothub-ns-xxx.servicebus.windows.net/;SharedAccessKeyName=iothubowner;SharedAccessKey=XXX;EntityPath=<IoT Hub name>
Use direct method calls
You can now analyze live video streams by invoking direct methods that the Video Analyzer edge module exposes. Read Video Analyzer direct methods to examine all the direct methods that the module provides. The schema for the direct methods can be found here.
Enumerate pipeline topologies
This step enumerates all the pipeline topologies in the module.
Right-click the avaedge module and select Invoke Module Direct Method from the shortcut menu.
Type pipelineTopologyList in the edit box and select the Enter key.
Copy the following JSON payload and paste it in the edit box, and then select the Enter key.
{
  "@apiVersion": "1.1"
}
Within a few seconds, the following response appears in the OUTPUT window:
[DirectMethod] Invoking Direct Method [pipelineTopologyList] to [deviceId/avaedge] ...
[DirectMethod] Response from [deviceId/avaedge]:
{
  "status": 200,
  "payload": {
    "value": []
  }
}
That response is expected, because no pipeline topologies have been created.
Set a pipeline topology
By using the same steps described earlier, you can invoke pipelineTopologySet to set a pipeline topology by using the following JSON as the payload. You'll create a pipeline topology named MotionDetection.
{
  "@apiVersion": "1.1",
  "name": "MotionDetection",
  "properties": {
    "description": "Analyzing live video to detect motion and emit events",
    "parameters": [
      {
        "name": "rtspUrl",
        "type": "string",
        "description": "rtspUrl"
      },
      {
        "name": "rtspUserName",
        "type": "string",
        "description": "rtspUserName",
        "default": "dummyUserName"
      },
      {
        "name": "rtspPassword",
        "type": "string",
        "description": "rtspPassword",
        "default": "dummypw"
      }
    ],
    "sources": [
      {
        "@type": "#Microsoft.VideoAnalyzer.RtspSource",
        "name": "rtspSource",
        "transport": "tcp",
        "endpoint": {
          "@type": "#Microsoft.VideoAnalyzer.UnsecuredEndpoint",
          "credentials": {
            "@type": "#Microsoft.VideoAnalyzer.UsernamePasswordCredentials",
            "username": "${rtspUserName}",
            "password": "${rtspPassword}"
          },
          "url": "${rtspUrl}"
        }
      }
    ],
    "processors": [
      {
        "@type": "#Microsoft.VideoAnalyzer.MotionDetectionProcessor",
        "sensitivity": "medium",
        "name": "motionDetection",
        "inputs": [
          {
            "nodeName": "rtspSource",
            "outputSelectors": []
          }
        ]
      }
    ],
    "sinks": [
      {
        "hubOutputName": "inferenceOutput",
        "@type": "#Microsoft.VideoAnalyzer.IotHubMessageSink",
        "name": "iotHubSink",
        "inputs": [
          {
            "nodeName": "motionDetection"
          }
        ]
      }
    ]
  }
}
This JSON payload creates a topology that defines three parameters, two of which have default values. The topology has one source node (RTSP source), one processor node (motion detection processor, and one sink node (IoT Hub message sink). The payload shows the visual representation of the topology.
Within a few seconds, the following response appears in the OUTPUT window:
{
  "status": 201,
  "payload": {
    "systemData": {
      "createdAt": "2021-03-21T18:16:46.491Z",
      "lastModifiedAt": "2021-03-21T18:16:46.491Z"
    },
    "name": "MotionDetection",
    "properties": {
      "description": "Analyzing live video to detect motion and emit events",
      "parameters": [
        {
          "name": "rtspPassword",
          "type": "string",
          "description": "rtspPassword",
          "default": "dummypw"
        },
        {
          "name": "rtspUrl",
          "type": "string",
          "description": "rtspUrl"
        },
        {
          "name": "rtspUserName",
          "type": "string",
          "description": "rtspUserName",
          "default": "dummyUserName"
        }
      ],
      "sources": [
        {
          "@type": "#Microsoft.VideoAnalyzer.RtspSource",
          "name": "rtspSource",
          "transport": "tcp",
          "endpoint": {
            "@type": "#Microsoft.VideoAnalyzer.UnsecuredEndpoint",
            "url": "${rtspUrl}",
            "credentials": {
              "@type": "#Microsoft.VideoAnalyzer.UsernamePasswordCredentials",
              "username": "${rtspUserName}",
              "password": "${rtspPassword}"
            }
          }
        }
      ],
      "processors": [
        {
          "@type": "#Microsoft.VideoAnalyzer.MotionDetectionProcessor",
          "sensitivity": "medium",
          "eventAggregationWindow": "PT1S",
          "name": "motionDetection",
          "inputs": [
            {
              "nodeName": "rtspSource",
              "outputSelectors": []
            }
          ]
        }
      ],
      "sinks": [
        {
          "@type": "#Microsoft.VideoAnalyzer.IotHubMessageSink",
          "hubOutputName": "inferenceOutput",
          "name": "iotHubSink",
          "inputs": [
            {
              "nodeName": "motionDetection",
              "outputSelectors": []
            }
          ]
        }
      ]
    }
  }
}
The returned status is 201. This status indicates that a new topology was created.
Try the following next steps:
- Invoke
pipelineTopologySetagain. The returned status code is 200. This code indicates that an existing topology was successfully updated. - Invoke
pipelineTopologySetagain, but change the description string. The returned status code is 200, and the description is updated to the new value. - Invoke
pipelineTopologyListas outlined in the previous section. Now you can see the MotionDetection topology in the returned payload.
Read the pipeline topology
Invoke pipelineTopologyGet by using the following payload:
{
  "@apiVersion": "1.1",
  "name": "MotionDetection"
}
Within a few seconds, the following response appears in the OUTPUT window:
{
  "status": 200,
  "payload": {
    "systemData": {
      "createdAt": "2021-03-21T18:16:46.491Z",
      "lastModifiedAt": "2021-03-21T18:16:46.491Z"
    },
    "name": "MotionDetection",
    "properties": {
      "description": "Analyzing live video to detect motion and emit events",
      "parameters": [
        {
          "name": "rtspPassword",
          "type": "string",
          "description": "rtspPassword",
          "default": "dummypw"
        },
        {
          "name": "rtspUrl",
          "type": "string",
          "description": "rtspUrl"
        },
        {
          "name": "rtspUserName",
          "type": "string",
          "description": "rtspUserName",
          "default": "dummyUserName"
        }
      ],
      "sources": [
        {
          "@type": "#Microsoft.VideoAnalyzer.RtspSource",
          "name": "rtspSource",
          "transport": "tcp",
          "endpoint": {
            "@type": "#Microsoft.VideoAnalyzer.UnsecuredEndpoint",
            "url": "${rtspUrl}",
            "credentials": {
              "@type": "#Microsoft.VideoAnalyzer.UsernamePasswordCredentials",
              "username": "${rtspUserName}",
              "password": "${rtspPassword}"
            }
          }
        }
      ],
      "processors": [
        {
          "@type": "#Microsoft.VideoAnalyzer.MotionDetectionProcessor",
          "sensitivity": "medium",
          "eventAggregationWindow": "PT1S",
          "name": "motionDetection",
          "inputs": [
            {
              "nodeName": "rtspSource",
              "outputSelectors": []
            }
          ]
        }
      ],
      "sinks": [
        {
          "@type": "#Microsoft.VideoAnalyzer.IotHubMessageSink",
          "hubOutputName": "inferenceOutput",
          "name": "iotHubSink",
          "inputs": [
            {
              "nodeName": "motionDetection",
              "outputSelectors": []
            }
          ]
        }
      ]
    }
  }
}
In the response payload, notice these details:
- The status code is 200, indicating success.
- The payload includes the
createdAttime stamp and thelastModifiedAttime stamp.
Create a live pipeline by using the topology
Next, create a live pipeline that references the preceding pipeline topology. Invoke the livePipelineSet direct method with the following payload:
{
  "@apiVersion": "1.1",
  "name": "mdpipeline1",
  "properties": {
    "topologyName": "MotionDetection",
    "description": "Sample pipeline description",
    "parameters": [
      {
        "name": "rtspUrl",
        "value": "rtsp://rtspsim:554/media/camera-300s.mkv"
      },
      {
        "name": "rtspUserName",
        "value": "testuser"
      },
      {
        "name": "rtspPassword",
        "value": "testpassword"
      }
    ]
  }
}
Notice that this payload:
- Specifies the topology (MotionDetection) that the live pipeline will use.
- Contains a parameter value for
rtspUrl, which did not have a default value in the topology payload. This value is a link to the following sample video:
Within few seconds, the following response appears in the OUTPUT window:
{
  "status": 201,
  "payload": {
    "systemData": {
      "createdAt": "2021-03-21T18:27:41.639Z",
      "lastModifiedAt": "2021-03-21T18:27:41.639Z"
    },
    "name": "mdpipeline1",
    "properties": {
      "state": "Inactive",
      "description": "Sample pipeline description",
      "topologyName": "MotionDetection",
      "parameters": [
        {
          "name": "rtspPassword",
          "value": "testpassword"
        },
        {
          "name": "rtspUrl",
          "value": "rtsp://rtspsim:554/media/camera-300s.mkv"
        },
        {
          "name": "rtspUserName",
          "value": "testuser"
        }
      ]
    }
  }
}
In the response payload, notice that:
- The status code is 201, indicating a new live pipeline was created.
- The state is
Inactive, indicating that the live pipeline was created but not activated. For more information, see Pipeline states.
Try the following direct methods as next steps:
Invoke
livePipelineSetagain with the same payload. Note that the returned status code is now 200.Invoke
livePipelineSetagain but with a different description. Note the updated description in the response payload, indicating that the live pipeline was successfully updated.Invoke
livePipelineSet, but change the name tomdpipeline2and changertspUrltortsp://rtspsim:554/media/lots_015.mkv. In the response payload, note the newly created live pipeline (that is, status code 201).Note
As explained in Pipeline topologies, you can create multiple live pipelines, to analyze live video streams from many cameras by using the same pipeline topology. If you create more live pipelines, take care to delete them during the cleanup step.
Activate the live pipeline
You can activate the live pipeline to start the flow of (simulated) live video through the pipeline. Invoke the direct method livePipelineActivate with the following payload:
{
  "@apiVersion": "1.1",
  "name": "mdpipeline1"
}
Within a few seconds, the following response appears in the OUTPUT window:
{
  "status": 200,
  "payload": null
}
The status code of 200 indicates that the live pipeline was successfully activated.
Check the state of the live pipeline
Invoke the livePipelineGet direct method with the following payload:
{
  "@apiVersion": "1.1",
  "name": "mdpipeline1"
}
Within a few seconds, the following response appears in the OUTPUT window:
{
  "status": 200,
  "payload": {
    "systemData": {
      "createdAt": "2021-03-21T18:27:41.639Z",
      "lastModifiedAt": "2021-03-21T18:27:41.639Z"
    },
    "name": "mdpipeline1",
    "properties": {
      "state": "Active",
      "description": "Sample pipeline description",
      "topologyName": "MotionDetection",
      "parameters": [
        {
          "name": "rtspPassword",
          "value": "testpassword"
        },
        {
          "name": "rtspUrl",
          "value": "rtsp://rtspsim:554/media/camera-300s.mkv"
        },
        {
          "name": "rtspUserName",
          "value": "testuser"
        }
      ]
    }
  }
}
In the response payload, notice the following details:
- The status code is 200, indicating success.
- The state is
Active, indicating that the live pipeline is now active.
Observe results
The live pipeline that you created and activated uses the motion detection processor node to detect motion in the incoming live video stream and sends events to the IoT Hub sink. These events are then relayed to IoT Hub as messages, which can now be observed. Messages in the OUTPUT window will have the following "body":
{
  "timestamp": 145471641211899,
  "inferences": [
    {
      "type": "motion",
      "motion": {
        "box": {
          "l": 0.514644,
          "t": 0.574627,
          "w": 0.3375,
          "h": 0.096296
        }
      }
    }
  ]
}
The inferences section indicates that the type is motion. It provides more data about the motion event. It also provides a bounding box for the region of the video frame (at the given time stamp) where motion was detected.
Invoke more direct method calls to clean up
Next, you can invoke direct methods to deactivate and delete the live pipeline (in that order).
Deactivate the live pipeline
Invoke thelivePipelineDeactivate direct method with the following payload:
{
  "@apiVersion": "1.1",
  "name": "mdpipeline1"
}
Within a few seconds, the following response appears in the OUTPUT window:
{
  "status": 200,
  "payload": null
}
The status code of 200 indicates that the live pipeline was successfully deactivated.
Next, try to invoke livePipelineGet as indicated previously in this article. Observe the state value.
Delete the live pipeline
Invoke the direct method livePipelineDelete with the following payload:
{
  "@apiVersion": "1.1",
  "name": "mdpipeline1"
}
Within a few seconds, the following response appears in the OUTPUT window:
{
  "status": 200,
  "payload": null
}
A status code of 200 indicates that the live pipeline was successfully deleted.
If you also created the pipeline called mdpipeline2, then you can't delete the pipeline topology without also deleting this additional pipeline. Invoke the direct method livePipelineDelete again by using the following payload:
{
    "@apiVersion" : "1.1",
    "name" : "mdpipeline2"
}
Within a few seconds, the following response appears in the OUTPUT window:
{
  "status": 200,
  "payload": null
}
A status code of 200 indicates that the live pipeline was successfully deleted.
You can invoke livePipelineList by using the same payload as pipelineTopologyList. Observe that no live pipelines are enumerated.
Delete the pipeline topology
After all live pipelines have been deleted, you can invoke the pipelineTopologyDelete direct method with the following payload:
{
  "@apiVersion": "1.1",
  "name": "MotionDetection"
}
Within a few seconds, the following response appears in the OUTPUT window:
{
  "status": 200,
  "payload": null
}
A status code of 200 indicates that the topology was successfully deleted.
You can try to invoke pipelineTopologyList and observe that the module contains no topologies.
Clean up resources
If you want to try other quickstarts or tutorials, keep the resources that you created. Otherwise, go to the Azure portal, go to your resource groups, select the resource group where you ran this quickstart, and delete all the resources.