Note
Access to this page requires authorization. You can try signing in or changing directories.
Access to this page requires authorization. You can try changing directories.
Dynamic telemetry enables you to visualize any telemetry sent to the remote monitoring preconfigured solution. The simulated devices that deploy with the preconfigured solution send temperature and humidity telemetry, which you can visualize on the dashboard. If you customize existing simulated devices, create new simulated devices, or connect physical devices to the preconfigured solution you can send other telemetry values such as the external temperature, RPM, or windspeed. You can then visualize this additional telemetry on the dashboard.
This tutorial uses a simple Node.js simulated device that you can easily modify to experiment with dynamic telemetry.
To complete this tutorial, you’ll need:
- An active Azure subscription. If you don’t have an account, you can create a free trial account in just a couple of minutes. For details, see Azure Free Trial.
- Node.js version 0.12.x or later.
You can complete this tutorial on any operating system, such as Windows or Linux, where you can install Node.js.
Provision the solution
If you haven't already provisioned the remote monitoring preconfigured solution in your account:
- Sign in to azureiotsuite.com using your Azure account credentials, and click + to create a solution.
- Click Select on the Remote monitoring tile.
- Enter a Solution name for your remote monitoring preconfigured solution.
- Select the Region and Subscription you want to use to provision the solution.
- Click Create Solution to begin the provisioning process. This process typically takes several minutes to run.
Wait for the provisioning process to complete
- Click the tile for your solution with Provisioning status.
- Notice the Provisioning states as Azure services are deployed in your Azure subscription.
- Once provisioning completes, the status changes to Ready.
- Click the tile to see the details of your solution in the right-hand pane.
Note
If you are encountering issues deploying the pre-configured solution, review Permissions on the azureiotsuite.com site and the FAQ. If the issues persist, create a service ticket on the portal.
Are there details you'd expect to see that aren't listed for your solution? Give us feature suggestions on User Voice.
Configure the Node.js simulated device
On the remote monitoring dashboard, click + Add a device and then add a custom device. Make a note of the IoT Hub hostname, device id, and device key. You need them later in this tutorial when you prepare the remote_monitoring.js device client application.
Ensure that Node.js version 0.12.x or later is installed on your development machine. Run
node --versionat a command prompt or in a shell to check the version. For information about using a package manager to install Node.js on Linux, see Installing Node.js via package manager.When you have installed Node.js, clone the latest version of the azure-iot-sdk-node repository to your development machine. Always use the master branch for the latest version of the libraries and samples.
From your local copy of the azure-iot-sdk-node repository, copy the following two files from the node/device/samples folder to an empty folder on your development machine:
- packages.json
- remote_monitoring.js
Open the remote_monitoring.js file and look for the following variable definition:
var connectionString = "[IoT Hub device connection string]";Replace [IoT Hub device connection string] with your device connection string. Use the values for your IoT Hub hostname, device id, and device key that you made a note of in step 1. A device connection string has the following format:
HostName={your IoT Hub hostname};DeviceId={your device id};SharedAccessKey={your device key}If your IoT Hub hostname is contoso and your device id is mydevice, your connection string looks like the following snippet:
var connectionString = "HostName=contoso.azure-devices.net;DeviceId=mydevice;SharedAccessKey=2s ... =="Save the file. Run the following commands in a shell or command prompt in the folder that contains these files to install the necessary packages and then run the sample application:
npm install
node remote_monitoring.js
Observe dynamic telemetry in action
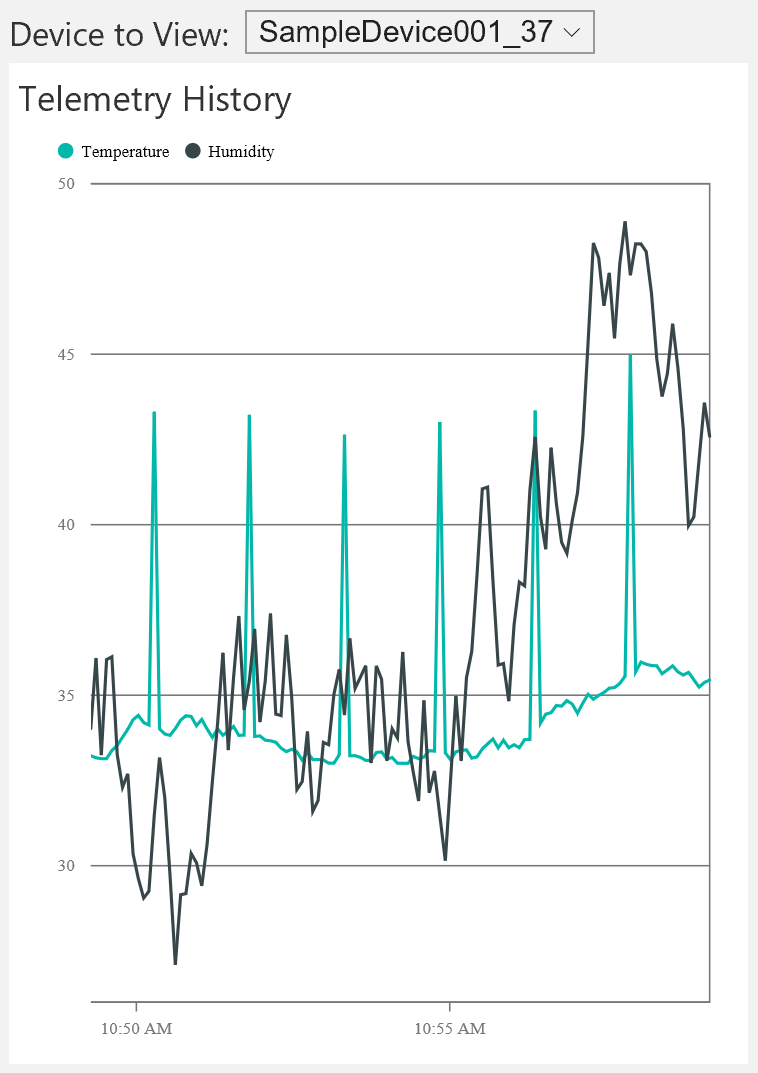
The dashboard shows the temperature and humidity telemetry from the existing simulated devices:

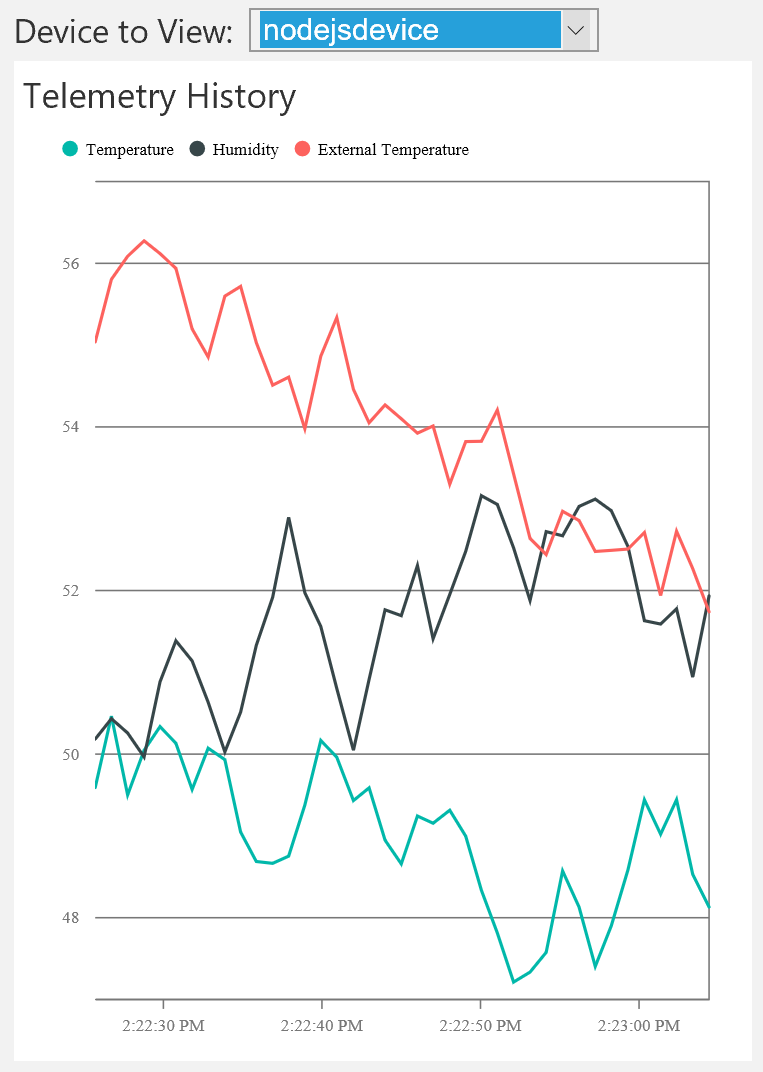
If you select the Node.js simulated device you ran in the previous section, you see temperature, humidity, and external temperature telemetry:

The remote monitoring solution automatically detects the additional external temperature telemetry type and adds it to the chart on the dashboard.
Add a telemetry type
The next step is to replace the telemetry generated by the Node.js simulated device with a new set of values:
Stop the Node.js simulated device by typing Ctrl+C in your command prompt or shell.
In the remote_monitoring.js file, you can see the base data values for the existing temperature, humidity, and external temperature telemetry. Add a base data value for rpm as follows:
// Sensors data
var temperature = 50;
var humidity = 50;
var externalTemperature = 55;
var rpm = 200;
The Node.js simulated device uses the generateRandomIncrement function in the remote_monitoring.js file to add a random increment to the base data values. Randomize the rpm value by adding a line of code after the existing randomizations as follows:
temperature += generateRandomIncrement();
externalTemperature += generateRandomIncrement();
humidity += generateRandomIncrement();
rpm += generateRandomIncrement();
Add the new rpm value to the JSON payload the device sends to IoT Hub:
var data = JSON.stringify({
  'DeviceID': deviceId,
  'Temperature': temperature,
  'Humidity': humidity,
  'ExternalTemperature': externalTemperature,
  'RPM': rpm
});
Run the Node.js simulated device using the following command:
node remote_monitoring.jsObserve the new RPM telemetry type that displays on the chart in the dashboard:

Note
You may need to disable and then enable the Node.js device on the Devices page in the dashboard to see the change immediately.
Customize the dashboard display
The Device-Info message can include metadata about the telemetry the device can send to IoT Hub. This metadata can specify the telemetry types the device sends. Modify the deviceMetaData value in the remote_monitoring.js file to include a Telemetry definition following the Commands definition. The following code snippet shows the Commands definition (be sure to add a , after the Commands definition):
'Commands': [{
  'Name': 'SetTemperature',
  'Parameters': [{
    'Name': 'Temperature',
    'Type': 'double'
  }]
},
{
  'Name': 'SetHumidity',
  'Parameters': [{
    'Name': 'Humidity',
    'Type': 'double'
  }]
}],
'Telemetry': [{
  'Name': 'Temperature',
  'Type': 'double'
},
{
  'Name': 'Humidity',
  'Type': 'double'
},
{
  'Name': 'ExternalTemperature',
  'Type': 'double'
}]
Note
The remote monitoring solution uses a case-insensitive match to compare the metadata definition with data in the telemetry stream.
Adding a Telemetry definition as shown in the preceding code snippet does not change the behavior of the dashboard. However, the metadata can also include a DisplayName attribute to customize the display in the dashboard. Update the Telemetry metadata definition as shown in the following snippet:
'Telemetry': [
{
  'Name': 'Temperature',
  'Type': 'double',
  'DisplayName': 'Temperature (C*)'
},
{
  'Name': 'Humidity',
  'Type': 'double',
  'DisplayName': 'Humidity (relative)'
},
{
  'Name': 'ExternalTemperature',
  'Type': 'double',
  'DisplayName': 'Outdoor Temperature (C*)'
}
]
The following screenshot shows how this change modifies the chart legend on the dashboard:

Note
You may need to disable and then enable the Node.js device on the Devices page in the dashboard to see the change immediately.
Filter the telemetry types
By default, the chart on the dashboard shows every data series in the telemetry stream. You can use the Device-Info metadata to suppress the display of specific telemetry types on the chart.
To make the chart show only Temperature and Humidity telemetry, omit ExternalTemperature from the Device-Info Telemetry metadata as follows:
'Telemetry': [
{
  'Name': 'Temperature',
  'Type': 'double',
  'DisplayName': 'Temperature (C*)'
},
{
  'Name': 'Humidity',
  'Type': 'double',
  'DisplayName': 'Humidity (relative)'
},
//{
//  'Name': 'ExternalTemperature',
//  'Type': 'double',
//  'DisplayName': 'Outdoor Temperature (C*)'
//}
]
The Outdoor Temperature no longer displays on the chart:

This change only affects the chart display. The ExternalTemperature data values are still stored and made available for any backend processing.
Note
You may need to disable and then enable the Node.js device on the Devices page in the dashboard to see the change immediately.
Handle errors
For a data stream to display on the chart, its Type in the Device-Info metadata must match the data type of the telemetry values. For example, if the metadata specifies that the Type of humidity data is int and a double is found in the telemetry stream then the humidity telemetry does not display on the chart. However, the Humidity values are still stored and made available for any back-end processing.
Next steps
Now that you've seen how to use dynamic telemetry, you can learn more about how the preconfigured solutions use device information: Device information metadata in the remote monitoring preconfigured solution.