Note
Access to this page requires authorization. You can try signing in or changing directories.
Access to this page requires authorization. You can try changing directories.
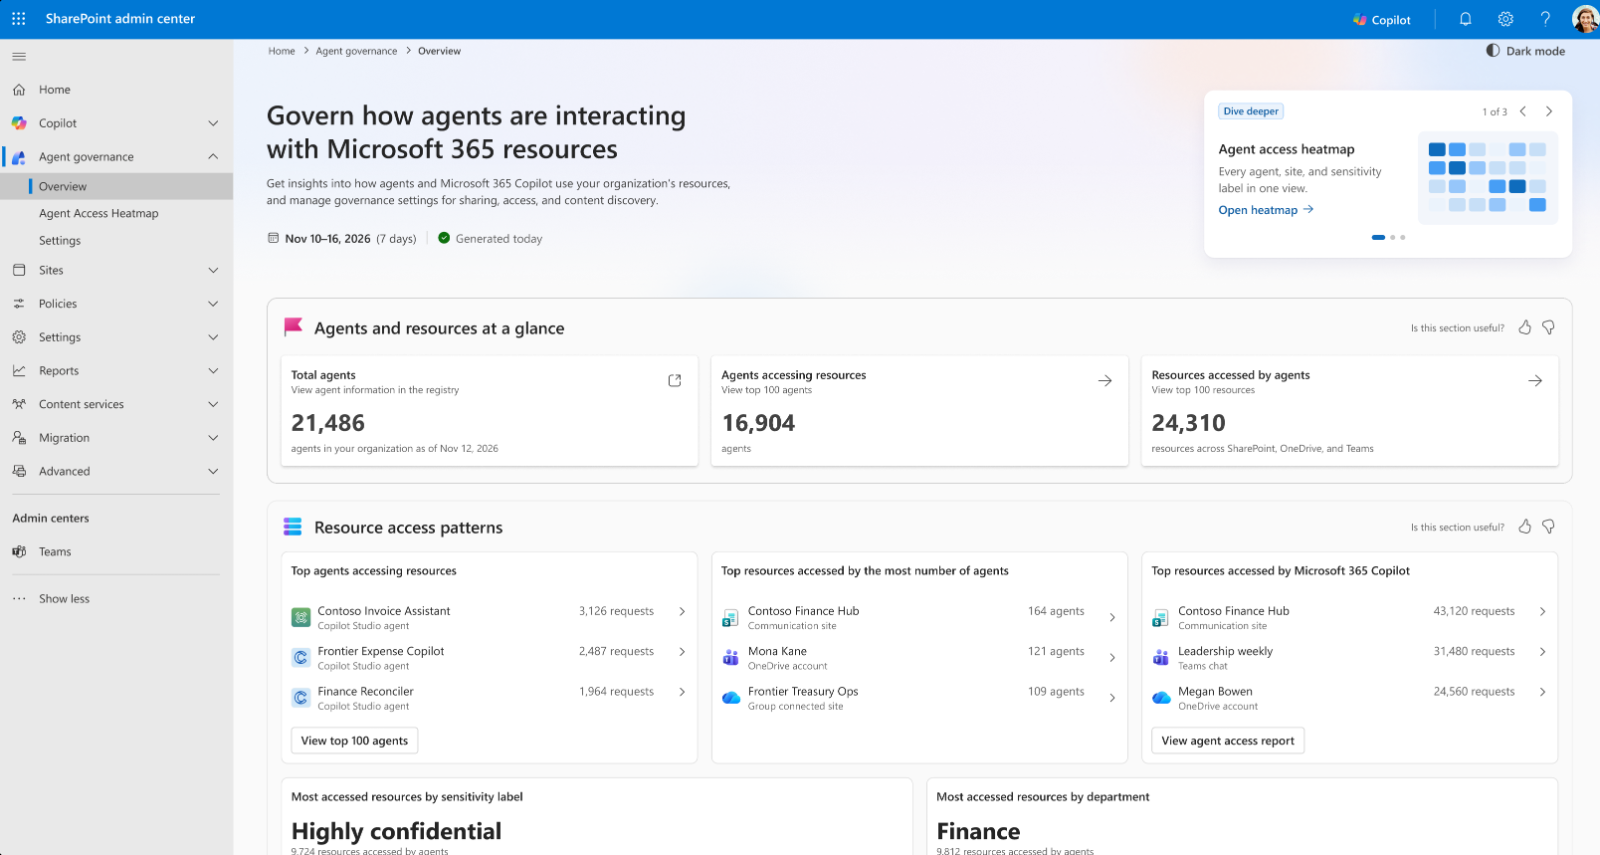
The Agent governance Overview page in the SharePoint admin center gives you one place to see how agents and Microsoft 365 Copilot use your organization's content. It shows which agents are most active, which sites and content they access most, and how that access breaks down by sensitivity label and department. From the same page, you can go straight to the governance controls that help you reduce oversharing and protect sensitive content.
Note
The agent governance overview is in preview. Features and terminology described in this article might change before general availability.
Use the overview page to:
Measure agent interaction with content: how many agents in your organization are accessing resources, and how many resources they access.
Spot access patterns across the agents, sites, OneDrive accounts, and Teams sites and identify the content with the most agent or Copilot activity.
Assess agent actions by evaluating the frequency and amount of sensitive content (by sensitivity label) and which departments own that content.
Act on what you find with controls such as restricted access control, restricted content discovery, or open deeper tools such as the agent access heatmap.
Prerequisites
To access the agent governance overview, make sure you have:
Microsoft Agent 365 or Microsoft 365 E7 license. For licensing questions, see Microsoft Product Terms or contact your Microsoft account representative.
Open the Agent governance overview page
Sign in to the SharePoint admin center with an account that has the required admin role.
In the left navigation, select Agent governance > Overview.
Generate insights
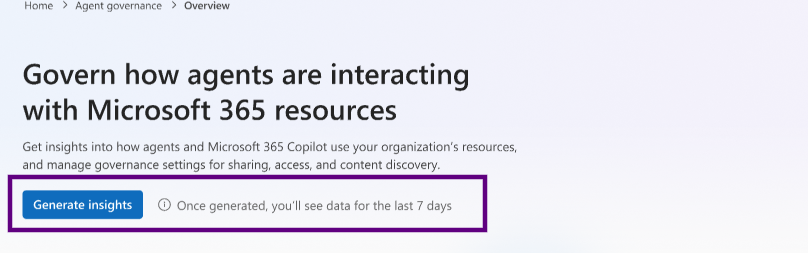
Most of the overview page is empty until you generate insights. Before that, only Total agents shows a value, and the other cards say Available when insights are ready.
To generate insights:
On the Overview page, select Generate insights.
After generating the report, the page shows the reporting period (for example, Nov 10–16, 2026 (7 days)) and a Generated today status.
Note
Insights cover agent and Copilot activity from the last 7 days.
What the overview page shows
Agents and resources at a glance
This section summarizes agent activity across your organization.
| Card | What it shows | Where it takes you |
|---|---|---|
| Total agents | The number of agents in your organization, as of the date shown. You see this value before you generate insights. | View agent information in the registry: opens the agent registry, where you can see details about each agent. |
| Agents accessing resources | The number of agents that accessed SharePoint, OneDrive, or Teams resources during the reporting period. | View top 100 agents: a list of the most active agents. |
| Resources accessed by agents | The number of resources across SharePoint, OneDrive, and Teams those agents accessed during the reporting period. | View top 100 resources: a list of the most-accessed resources. |
Tip: Compare Agents accessing resources with Total agents to see what share of your agents actively use organizational content.
Resource access patterns
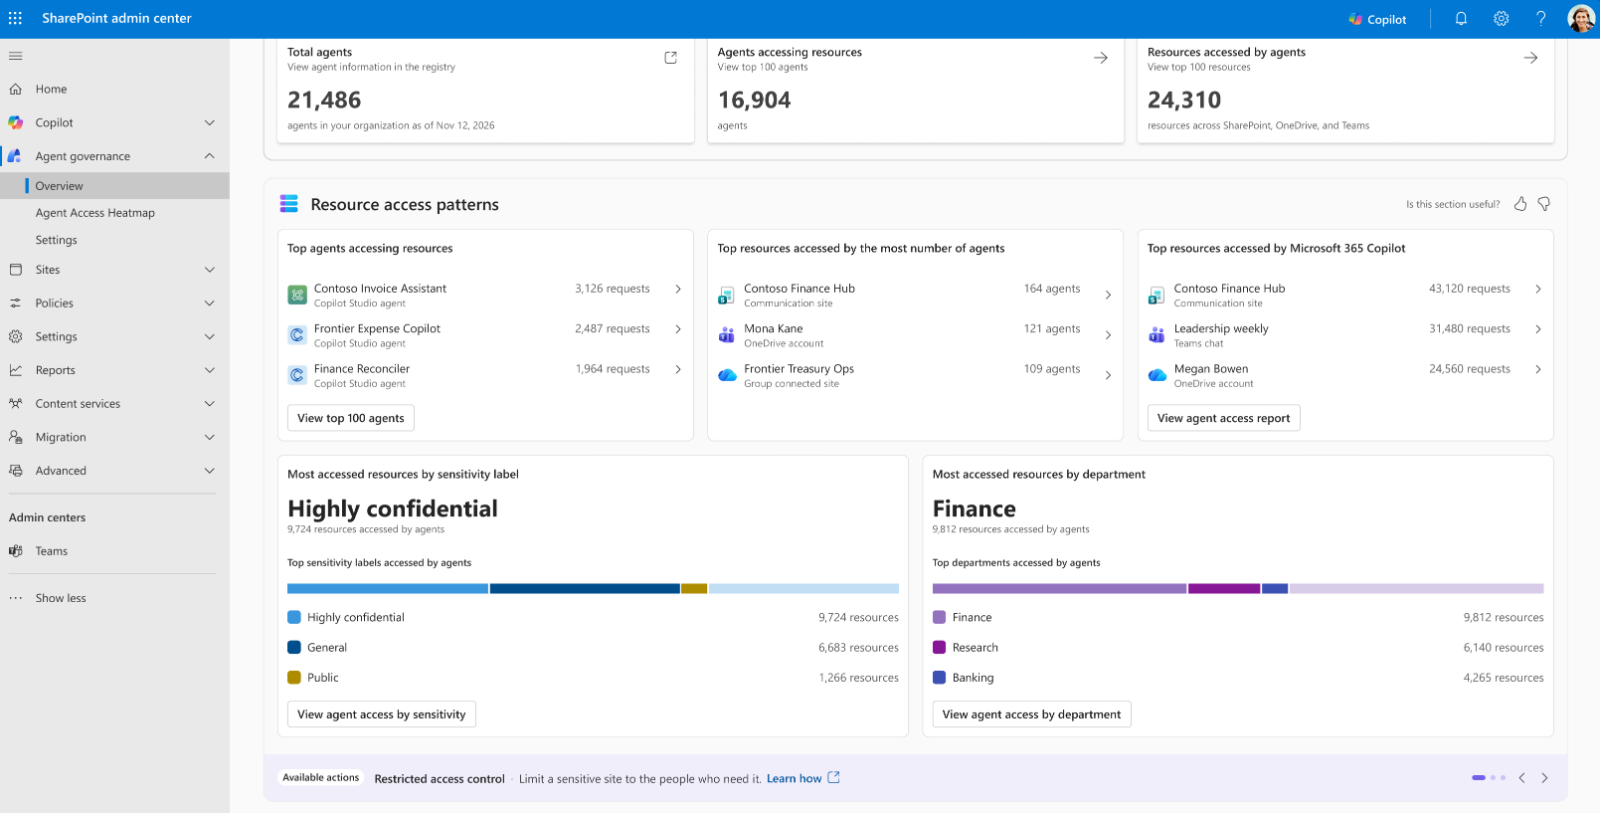
This section shows where agent and Copilot activity is concentrated, so you can focus on your governance work where it matters most.
| Card | What it shows | Next step |
|---|---|---|
| Top agents accessing resources | The agents that made the most resource access requests, with the agent type (for example, Copilot Studio agent) and the number of requests. | Select an agent for details, or select View top 100 agents. |
| Top resources accessed by the most number of agents | The sites and accounts accessed by the largest number of different agents, with the resource type (for example, Communication site, OneDrive account, or Group connected site) and the agent count. | Select a resource for details. |
| Top resources accessed by Microsoft 365 Copilot | The resources that Microsoft 365 Copilot used most, including sites, OneDrive accounts, and Teams chats, with the number of requests. | Select a resource for details, or select View agent access report. |
| Most accessed resources by sensitivity label | The sensitivity label most common on the resources agents access (for example, Highly confidential), and how agent-accessed resources are distributed across labels. | Select View agent access by sensitivity. |
| Most accessed resources by department | The department that owns the most agent-accessed resources (for example, Finance), and how agent-accessed resources are distributed across departments. | Select View agent access by department. |
Dive deeper and take action
The card at the top right of the page highlights related tools. Use the arrows to move between them.
| Tool | What it does | Get started |
|---|---|---|
| Agent access heatmap | Shows every agent, site, and sensitivity label in one view, so you can spot high-activity combinations at a glance. | Select Open heatmap, or select Agent governance > Agent access heatmap. |
| Permission insights report | Shows which sites an agent user has permission to access. | Select Generate report. |
Available actions
The Available actions bar at the bottom of the page suggests governance controls you can apply based on what you see. Use the arrows to move between them, and select Learn how to read more about each one.
| Action | Use it to |
|---|---|
| Restricted access control | Limit a site to only the people who need it. Agents acting on behalf of users can't reach content on the site for users outside the allowed group. |
| Restricted content discovery | Control whether content from specific SharePoint sites can be discovered by Copilot and organization-wide search. |
| Site access review | Ask site owners to confirm who should still have access to their sites. |
Give feedback
Each section on the overview page includes Is this section useful?. Select thumbs up or thumbs down to tell us whether the insights help you.
FAQ for agent governance
Why are most cards empty?
Insights aren't generated automatically. Select Generate insights to fill the page with data from the last seven days.
What time period do the insights cover?
Insights cover the last seven days before you generated the insights. The date range appears under the page title. If you created an agent access heatmap previously, the most recent report data appears on the overview page.
Which resources are included?
SharePoint sites, OneDrive accounts, and Teams resources (such as Teams chats).