Note
Access to this page requires authorization. You can try signing in or changing directories.
Access to this page requires authorization. You can try changing directories.
Important
The agent access heatmap is in preview. Features and terminology described in this article might change before general availability.
This article walks you through preparing your tenant, generating your first report, and using the agent access heatmap to investigate agent activity and act on a specific site. Learn more about what the heatmap shows and the concepts behind it in Agent access heatmap overview (preview).
Before you begin
The heatmap organizes agent activity by business group and by sensitivity. Organizations that use both business groups in catalog management and sensitivity labels on sites get the full heatmap experience. If your organization uses only one, the heatmap shows the view for that one. The following steps help you check your configuration.
Licensing and permissions
| Requirement | Details |
|---|---|
| License | Microsoft Agent 365 or Microsoft 365 E7 license. For licensing questions, see Microsoft Product Terms or contact your Microsoft account representative. |
| Admin role | SharePoint Administrator or AI Administrator. |
| Sensitivity labels or business groups | Recommended. Use both for the full heatmap experience. See the steps that follow. |
Step 1: Confirm that sensitivity labels are applied to sites
The sensitivity view uses Microsoft Purview sensitivity labels that are applied to sites (container labels). Labels applied only to individual files or emails aren't used. If your organization labels files but not sites, the sensitivity view won't have data to show.
To check your configuration:
- In the Microsoft Purview portal, confirm that sensitivity labels are enabled for Microsoft Teams, Microsoft 365 groups, and SharePoint sites, and that at least one published label includes the Groups & sites scope.
- In the SharePoint admin center, go to Sites > Active sites and review the Sensitivity column. Confirm that your most important sites carry a label.
The more sites that carry a label, the more complete the sensitivity view is. Learn more about setting up container labels in Use sensitivity labels to protect content in Microsoft Teams, Microsoft 365 groups, and SharePoint sites.
Step 2: Confirm that business groups are available in catalog management
The business group view uses the Department category from catalog management in SharePoint Advanced Management. Catalog management assigns each site to a department based on the Microsoft Entra ID department attribute of the site's owner.
To check your configuration:
- In the SharePoint admin center, go to Reports > Catalog management.
- Open the Department category. Confirm that it lists the groups you expect, such as Finance, Sales, or HR, and that those groups contain sites.
- If groups are missing or many sites aren't assigned, update the department attribute for site owners in Microsoft Entra ID. Built-in categories refresh every hour.
Sites whose owners don't have a department value can't be attributed to a business group. Learn more in Catalog management in SharePoint Advanced Management.
What to expect based on your configuration
| Sensitivity labels on sites | Departments in catalog management | What the heatmap shows |
|---|---|---|
| Yes | Yes | Business group and sensitivity views. Switch between them at any time. |
| Yes | No | Sensitivity view only. |
| No | Yes | Business group view only. |
| No | No | Neither view. Activity is grouped by site template instead. |
If neither sensitivity labels nor business groups are configured, configure at least one, and then generate a new report.
Tip
Configure sensitivity labels or business groups before you generate a report. Each report reflects the configuration in place when it was generated, so changes you make later appear in the next report you generate.
Turn on data collection
Reports are built from audit data that's collected after you turn on data collection.
- Sign in to the SharePoint admin center.
- In the navigation pane, expand Agent governance, and then select Agent access heatmap.
- If you're prompted to turn on data collection, turn it on.
Data collection starts when you turn it on, so activity from before that point isn't included. You can generate your first report after 24 hours. For large tenants, it can take up to 48 hours for data to become available. If no report is generated for three months, data collection turns off automatically. You can turn it back on at any time.
Generate a report
The heatmap is built from a report of agent activity over a period you choose. Report data comes from the Microsoft 365 unified audit log.
- In the SharePoint admin center, in the navigation pane, expand Agent governance, and then select Agent access heatmap.
- Select Generate report.
- Select a reporting period: the last 1, 7, 14, or 28 days.
- Select Generate.
- Check the Status column to see whether the report is ready. Generation time depends on how much agent activity your tenant has.
- When the report is ready, select it to open it.
Keep these points in mind:
- You can have one report for each reporting period at a time, so up to four reports in total. Generating a new report for a period replaces the existing report for that period. To keep the earlier report, download it first.
- You can generate a new report once every 24 hours.
Review the dashboard
A report opens on the Dashboard tab, which contains the summary cards and the heatmap. The Report tab contains the same data in table form.
Review the summary cards
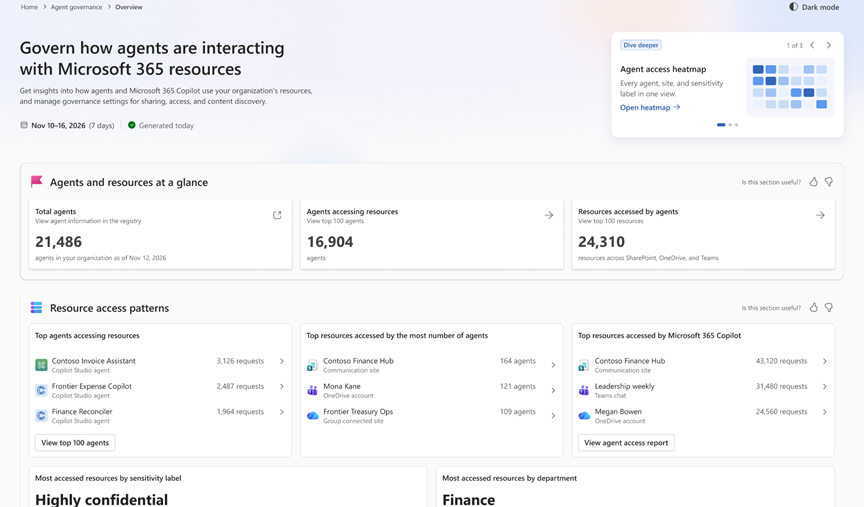
Summary cards at the top of the report show how many agents accessed your content during the reporting period and how that activity is spread across SharePoint sites, OneDrive accounts, and Teams-connected sites. If you use sensitivity labels or business groups, you also see activity broken down by each. Select a card to see supporting detail, such as the most active agents and the sites with the most agent activity.
Read the heatmap
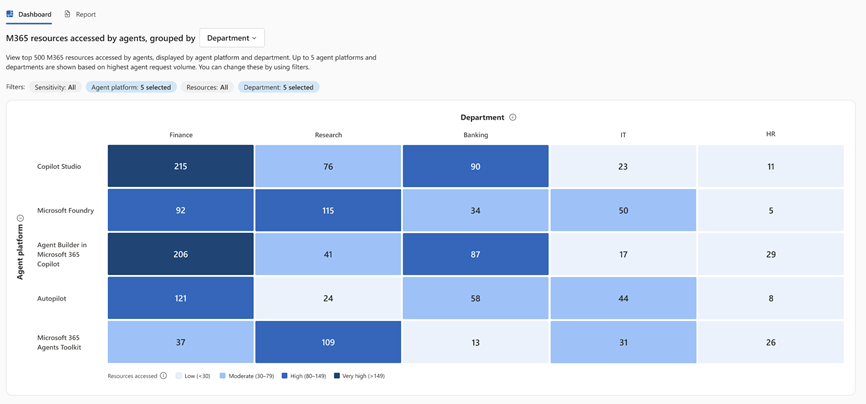
The heatmap plots agent platforms against your content.
| Part of the heatmap | What it shows |
|---|---|
| Rows | The agent platforms responsible for the most activity, such as Copilot declarative agents, Copilot Studio agents, agents in SharePoint, custom engine agents, and third-party agents. |
| Columns | Business groups or sensitivity labels, depending on the view you select. |
| Cells | How many resources (sites, OneDrive accounts, and Teams-connected sites) agents from that platform accessed in that business group or at that sensitivity level. Darker cells indicate more resources. |
To keep the view readable, the heatmap considers the 500 resources with the most agent activity and shows the top five agent platforms and the top five business groups or sensitivity labels, ranked by request volume.
Switch views and filter the heatmap
- Use the view selector above the heatmap to switch between the business group view and the sensitivity view.
- Use the filters to choose which business groups, sensitivity labels, and agent platforms appear on the grid.
Tip
Start with sensitivity. Filter to your most sensitive labels first, and then switch to the business group view to see whose content is involved.
Investigate a cell
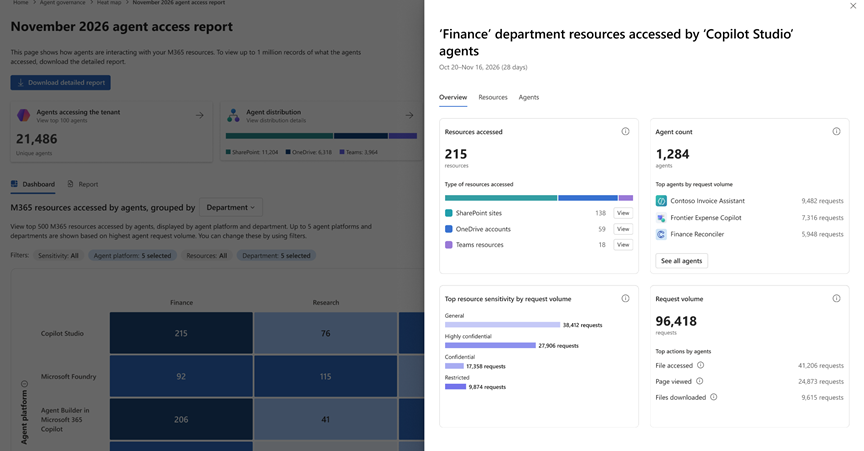
Select a cell to open the details pane for that combination of agent platform and business group or sensitivity label. The pane carries forward any filters you applied.
For each resource, the details pane shows the sensitivity label, site template, site owner, number of agents, request volume, and the top actions agents performed. You can pivot the pane to see the same activity in two ways:
| Pivot | What it shows |
|---|---|
| By resource | The sites and accounts agents accessed, ranked by request volume. The pane lists the top 100. The full list is available in the detailed report. |
| By agent | Each agent in the slice, what it accessed, how often, and what it did. |
Understand what agents did
Actions show whether agents only read content or also create and update it. For each agent and resource, the heatmap lists the top three operations recorded in the audit log, such as FileAccessed, FileModified, or FileUploaded, with a count for each.
What counts as expected depends on your organization and on each agent's purpose. Review the actions against what you expect from each agent on each site, and if they don't match, or you aren't sure, check with the site owner.
Drill into a site
Select a site in the details pane to open the site view. The site view shows who owns the site and lists the top 20 agents that access it by request volume, with each agent's platform and actions.
The site owner usually knows whether an agent belongs with that content, so bring them into the decision before you restrict access.
Act on a site
You can act on a site directly from the details pane or the site view, without switching to another page.
| Action | What it does |
|---|---|
| Restrict content discovery | Keeps the site's content from appearing in Microsoft 365 Copilot agent search and discovery. It doesn't change permissions, so people who have access keep it. Changes can take time to take effect, depending on the size of the site. |
| Restrict site access | Limits access to the site to members of the groups you choose. |
| View site | Opens the site. |
To apply an action:
- In the details pane or the site view, select the site.
- Select Restrict content discovery or Restrict site access.
- Review the settings, and then confirm.
Note
After you apply a policy from a report, the policy status in that report doesn't update. To see the current status, select the policy, or open the site from Sites > Active sites and review its settings. The next report you generate reflects the change.
Site-level actions work well for a specific finding. To apply your intent to every agent in scope, including agents created in the future, use content guardrails on the Settings page in Agent governance.
Use the Report tab and download the detailed report
The Report tab lists the top 100 sites agents accessed, with each site's sensitivity label and governance settings. You can filter the list, for example by site template, sensitivity label, business group, or whether restricted content discovery or restricted site access is applied. Select a site to see the top 20 agents that access it.
To analyze all of the data, select Download detailed report. The download contains up to 1 million rows and includes site details and owner, business group (department), agent ID, name, type, and platform, request volume, operations, site sensitivity, and whether restricted content discovery, restricted site access, and external sharing are enabled for each site.
What a report includes
Each report captures agent activity for the reporting period you choose. The following table describes what a report includes.
| Attribute | Details |
|---|---|
| Reporting period | The last 1, 7, 14, or 28 days. |
| Activity | Agent activity on SharePoint sites, OneDrive accounts, and Teams-connected sites, recorded in the Microsoft 365 unified audit log after data collection was turned on. |
| Agents | Declarative agents, Agent 365 agents, and Microsoft and third-party agents registered in Microsoft Entra ID. |
| Configuration | Sensitivity labels, business groups, and site policies as they were when the report was generated. Changes you make later appear in the next report you generate. |
| Request volume | The number of times agents accessed a resource during the reporting period. The heatmap ranks resources, agents, and agent platforms by request volume. |
| Actions | The operations agents performed on each resource, as recorded in the audit log, such as FileAccessed, FileModified, or FileUploaded. |
| Detailed report | A download of the full report data, for analysis outside the SharePoint admin center. |
Limits
The following limits apply to the heatmap and to each report.
| Item | Limit |
|---|---|
| Resources in the heatmap | The top 500 by request volume |
| Heatmap rows and columns | The top five agent platforms, and the top five business groups or sensitivity labels, ranked by request volume |
| Details pane | The top 100 resources |
| Site view | The top 20 agents for each site |
| Report tab | The top 100 sites |
| Actions | The top three operations for each agent and resource |
| Detailed report | Up to 1 million rows |
| Reporting periods | 1, 7, 14, or 28 days, with one report for each period at a time |
| Report generation | One new report for a period every 24 hours |
| Coverage | SharePoint sites, OneDrive accounts, and Teams-connected sites |
Next steps
- To set content guardrails that apply to every agent in scope, go to Agent governance > Settings. Learn more in (Restrict external sharing by agentic users in SharePoint and OneDrive)[agentic-users-governance-restrict-share-external-agentic-users.md].