Monitor Big Data Clusters by using azdata and Grafana Dashboard
Important
The Microsoft SQL Server 2019 Big Data Clusters add-on will be retired. Support for SQL Server 2019 Big Data Clusters will end on February 28, 2025. All existing users of SQL Server 2019 with Software Assurance will be fully supported on the platform and the software will continue to be maintained through SQL Server cumulative updates until that time. For more information, see the announcement blog post and Big data options on the Microsoft SQL Server platform.
This article describes how to monitor an application inside SQL Server Big Data Clusters. SQL Server 2019 Big Data Clusters expose Grafana Dashboard for monitoring, those metrics are stored in influxDB. Those metrics are categorized as either:
- Kubernetes host-related metrics collected by Telegraf, an agent for collecting, processing, aggregating, and writing metrics.
- Workload-related metrics: those metrics related to SQL Server, Spark and HDFS are collected by CollectD, including such as SQL Server DMV metrics and SQL Server Extended Events (XEvents).
Important
The Internet Explorer browser and older Microsoft Edge browsers are not compatible with Grafana. In Grafana, you will see a black page with errors when using an unsupported browser. Consider the Chromium-based Microsoft Edge, or review the supported browsers for Grafana.
Available metrics
The following metrics are available in SQL Server Big Data Clusters:
| Categories | Description | metrics |
|---|---|---|
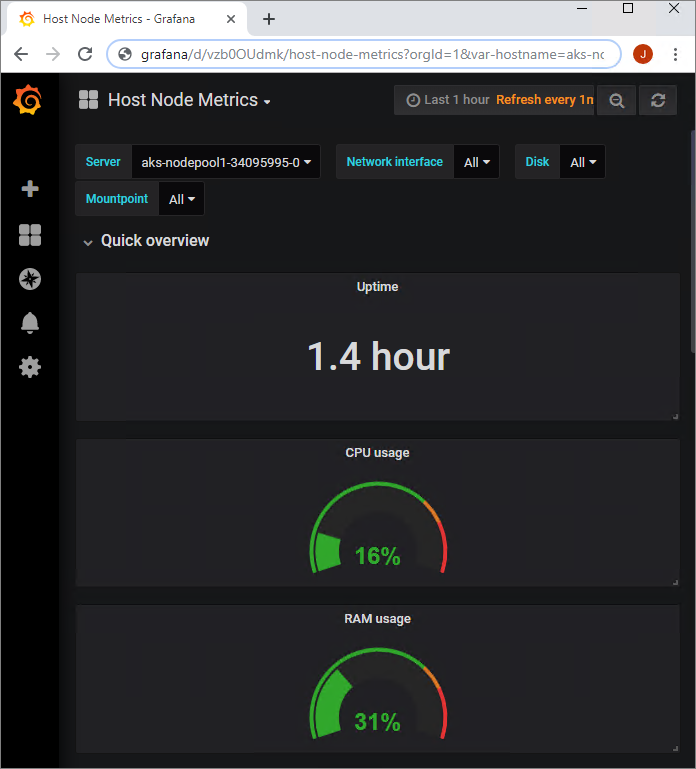
| Hosted Node Metrics | Metrics related to Kubernetes host | CPU, RAM usage, Disk IOPS, Load averages, etc. |
| Pods and Containers Metrics | Metrics related to Kubernetes pods and containers, Grafana allows filtering those metrics by pods or even specific container. | CPU, RAM, Disk, and network usage. |
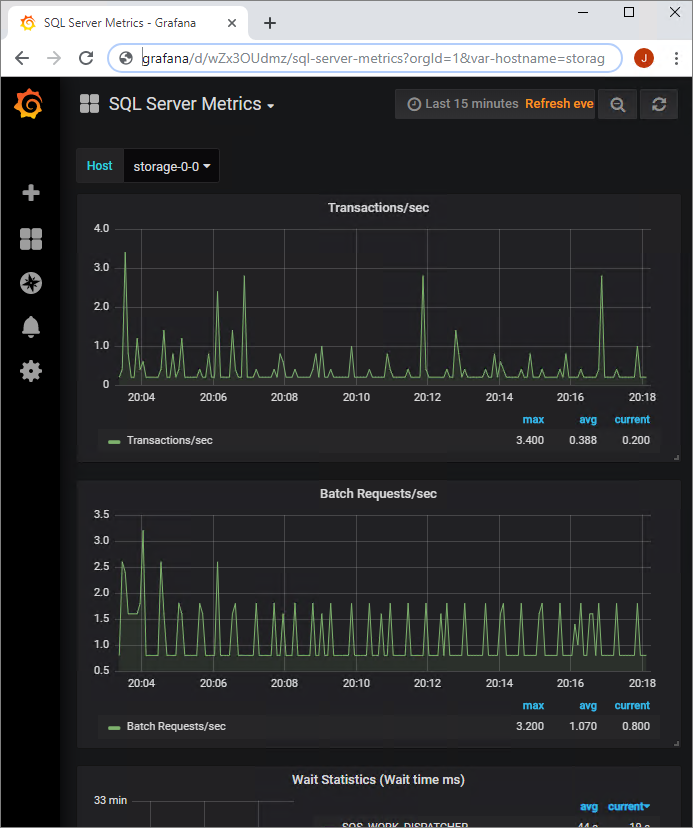
| SQL Server Metrics | Metrics related to SQL Server | Transaction/sec, Batch Requests/sec, Database Activity, SQL Server Activity etc., in particular, when ContainerAG is enabled, you can also monitor the alwaysOn from here. |
| Spark Metrics | Metrics related to Spark apps. | Executor hdfs writes, JVM GC time, JVM heap usage etc. |
| Apps Metrics | Metrics related to the Apps deployed on SQL Server Big Data Clusters, Grafana allows filtering those metrics by specific app and app version. | CPU, RAM, and HTTP requests status. |
Prerequisites
Capabilities
In SQL Server 2019 you can create, delete, describe, initialize, list, run, and update your application. The following table describes the application deployment commands that you can use with azdata.
| Command | Description |
|---|---|
azdata bdc endpoint list |
Lists the endpoints for Big Data Clusters. |
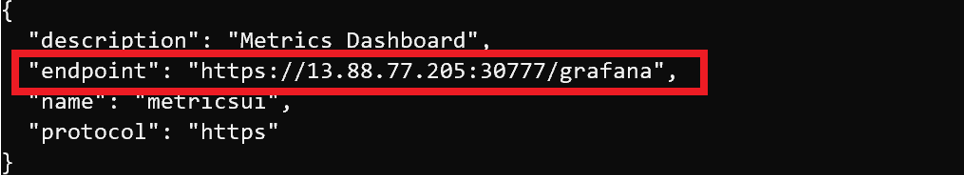
You can use the following example to list the endpoint of Grafana dashboard:
azdata bdc endpoint list --endpoint-name metricsui
The output will give you the endpoint, which you can use your cluster username and password to log in.
The nodeMetricsUrl and sqlMetricsUrl values link to a Grafana dashboard for monitoring Kubernetes node metrics and Big Data Clusters service metrics:
Related content
Feedback
Coming soon: Throughout 2024 we will be phasing out GitHub Issues as the feedback mechanism for content and replacing it with a new feedback system. For more information see: https://aka.ms/ContentUserFeedback.
Submit and view feedback for