Note
Access to this page requires authorization. You can try signing in or changing directories.
Access to this page requires authorization. You can try changing directories.
Applies to: ![]() SQL Server
SQL Server ![]() Azure SQL Managed Instance
Azure SQL Managed Instance
SQL Server Management Studio version 17.2 and later includes the Performance Dashboard. This dashboard was designed to visually provide fast insight into the performance state of SQL Server and Azure SQL Managed Instance.
The Performance Dashboard helps to quickly identify whether SQL Server or Azure SQL Database is experiencing a performance bottleneck. And if a bottleneck is found, easily capture extra diagnostic data that might be necessary to resolve the problem. Some common performance problems that the Performance Dashboard can help identify include:
- CPU bottlenecks (and what queries are consuming the most CPU)
- I/O bottlenecks (and what queries are performing the most I/O)
- Index recommendations generated by the Query Optimizer (missing indexes)
- Blocking
- Resource contention (including latch contention)
The Performance Dashboard also helps to identify expensive queries that might have been executed before, and several metrics are available to define high cost: CPU, Logical Writes, Logical Reads, Duration, Physical Reads, and CLR Time.
The Performance dashboard is divided into the following sections and sub-reports:
System CPU utilization
Current Waiting Requests
Current Activity
- User Requests
- User Sessions
- Cache Hit Ratio
Historical information
- Waits
- Latches
- I/O Statistics
- Expensive Queries
Miscellaneous information
- Active Traces
- Active XEvent Sessions
- Databases
- Missing Indexes
Note
Internally, the Performance Dashboard uses Execution Related Dynamic Management Views and Functions, Index Related Dynamic Management Views and Functions, and I/O Related Dynamic Management Views and Functions related Dynamic Management Views (DMVs) and Functions (DMFs).
View the Performance Dashboard
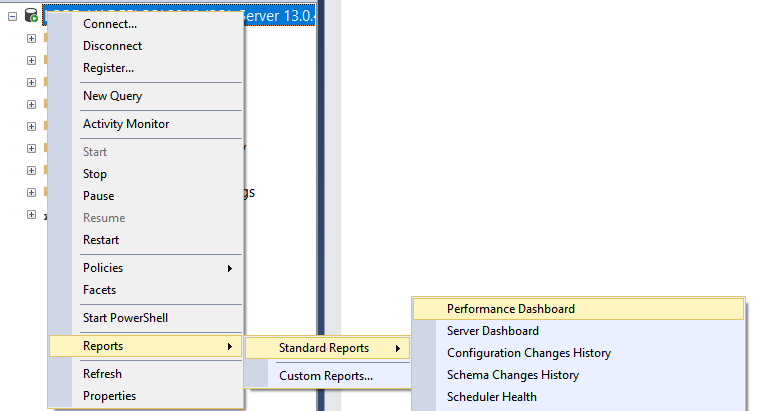
To view the Performance Dashboard, right-click on the SQL Server instance name in Object Explorer, select Reports, Standard Reports, and select Performance Dashboard.
The Performance Dashboard appears as a new tab. Following is an example where a CPU bottleneck is clearly present:

Remarks
The Missing Indexes report shows potentially missing indexes that the Query Optimizer identified during query compilation. However, these recommendations shouldn't be taken at face value. Microsoft recommends that indexes with a score greater than 100,000 should be evaluated for creation, as these indexes have the highest anticipated improvement for user queries.
Tip
Always evaluate if a new index suggestion is comparable to an existing index in the same table, where the same practical results can be achieved simply by changing an existing index instead of creating a new index. For example, given a new suggested index on columns C1, C2 and C3, first evaluate if there's an existing index over columns C1 and C2. If so, then it might be preferable to add column C3 to the existing index (preserving the order of preexisting columns) to avoid creating a new index. For more information, see the SQL Server and Azure SQL index architecture and design guide.
The Waits report filters out all idle and sleep waits. For more information about waits, see sys.dm_os_wait_stats and SQL Server 2005 Performance Tuning Using Waits and Queues.
The Expensive Queries reports are reset when SQL Server restarts because the data in the underlying DMVs is cleared. In SQL Server 2016 (13.x) and later versions, detailed information about expensive queries can be found in the Query Store.
Note
While the SQL Server Management Studio report renderer doesn't support clipboard access to text contained in the reports, the text can be accessed via the standalone reports. Download the standalone reports if you need to copy query text from the reports.
Permissions
SQL Server requires VIEW SERVER STATE and ALTER TRACE permissions.
Azure SQL Managed Instance requires the VIEW DATABASE STATE permission in the database.