Microsoft Report Builder in SQL Server
Microsoft Report Builder is a tool for authoring paginated reports, for business users who prefer to work in a stand-alone environment instead of using Report Designer in Visual Studio/SSDT. When you design a paginated report, you're creating a report definition that specifies what data to retrieve, where to get it, and how to display it. When you run the report, the report processor takes the report definition you specified, retrieves the data, and combines it with the report layout to generate the report. You can preview your report in Report Builder. Then publish your report to a Reporting Services report server in native mode or in SharePoint integrated mode (2016 and earlier).
You can also publish a paginated report to the Power BI service. If so, we recommend using Power BI Report Builder. For more information, see paginated reports in Power BI Premium (Preview).
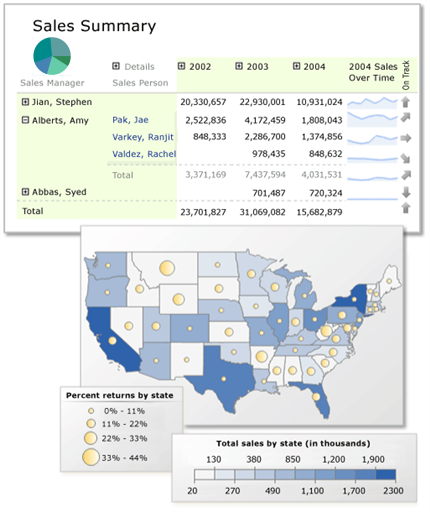
This paginated report features a matrix with row and column groups, sparklines, indicators, and a summary pie chart in the corner cell. The matrix accompanies a map with two sets of geographic data represented by color and by circle size.
Jump-start report creation
Start with a shared dataset: Shared datasets are queries based on a shared data source and saved to a Reporting Services report server in native mode or in SharePoint integrated mode.
Start with the Table, Matrix, or Chart wizard: Choose a data source connection, drag and drop fields to create a dataset query, select a layout and style, add accessibility row properties, and customize your report.
Start with the Map wizard: Create reports that display aggregated data against a geographic or geometric background. Map data can be spatial data from a Transact-SQL query or an Environmental Systems Research Institute, Inc. (ESRI) shapefile. You can also add a Microsoft Bing map tile background.
Start your report with report parts: Report parts are report items that were published separately to a Reporting Services report server in native mode or in SharePoint integrated mode. Report parts can be reused in other reports. Report items such as tables, matrices, charts, and images can be published as report parts.
Note
Report parts are deprecated for all releases of SQL Server Reporting Services starting with SQL Server Reporting Services 2019 and all releases of Power BI Report Server starting with Power BI Report Server September 2022.
Design your report
Create paginated reports with table, matrix, chart, and free-form report layouts: Create table reports for column-based data, matrix reports (like cross-tab or PivotTable reports) for summarized data, chart reports for graphical data, and free-form reports for anything else. Reports can embed other reports and charts, together with lists, graphics, and controls for dynamic web-based applications.
Report from a variety of data sources: Build reports using data from any data source type that has a Microsoft .NET Framework-managed data provider, OLE DB provider, or ODBC data source. You can create reports that use relational and multidimensional data from SQL Server and Analysis Services, Oracle, Hyperion, and other databases. You can use an XML data processing extension to retrieve data from any XML data source. You can use table-valued functions to design custom data sources.
Modify existing reports: By using Report Builder, you can customize and update reports that were created in SQL Server Data Tools (SSDT) Report Designer.
Modify your data: Filter, group, and sort data, or add formulas or expressions.
Add charts, gauges, sparklines, and indicators: Summarize data in a visual format and present large volumes of aggregated information at a glance.
Add interactive features: Includes document maps, show/hide buttons, and drillthrough links to subreports and drillthrough reports. Use parameters and filters to filter data for customized views.
Embed or reference images: Includes other resources and external content.
Manage your report
Save the definition of the report: Save the report definition to your computer or to the report server, where you can manage it and share it with others.
Choose a presentation format: When you open the report, or after you open the report, you can select web-oriented, page-oriented, and desktop application formats. Formats include HTML, MHTML, PDF, XML, CSV, TIFF, Word, and Excel.
Set up subscriptions: After you publish the report to the report server or a report server in SharePoint integrated mode, you can configure your report to run at a specific time, create a report history, and set up e-mail subscriptions.
Generate data feeds: You can generate data feeds from your report by using the Reporting Services Atom rendering extension.
Note
Published reports are managed on a report server or a report server in SharePoint integrated mode by a report server administrator. Report server administrators can define security, set properties, and schedule operations such as report history and email report delivery. They can create shared schedules and shared data sources and make them available for general use. Administrators also manage all of the report server folders. The ability to perform management tasks depends on user permissions.
Related content
Start Report Builder
Install Report Builder
What's new in SQL Server Reporting Services and Report Builder
Tutorial: Create a quick chart report offline
Plan a report (Report Builder)
Reporting Services concepts (SSRS)
Report design view (Report Builder)
Shared dataset design view (Report Builder)
Keyboard shortcuts (Report Builder)
Feedback
Coming soon: Throughout 2024 we will be phasing out GitHub Issues as the feedback mechanism for content and replacing it with a new feedback system. For more information see: https://aka.ms/ContentUserFeedback.
Submit and view feedback for