Note
Access to this page requires authorization. You can try signing in or changing directories.
Access to this page requires authorization. You can try changing directories.
In this Report Builder tutorial, you use expressions with common functions and operators to create powerful and flexible Reporting Services paginated reports.
In this tutorial, you write expressions that concatenate name values, look up values in a separate dataset, display different colors based on field values, and so on.
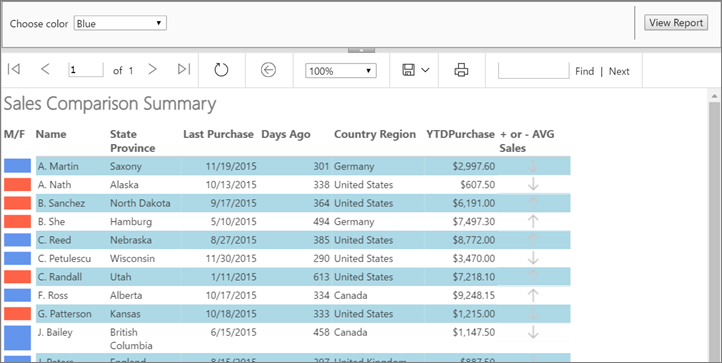
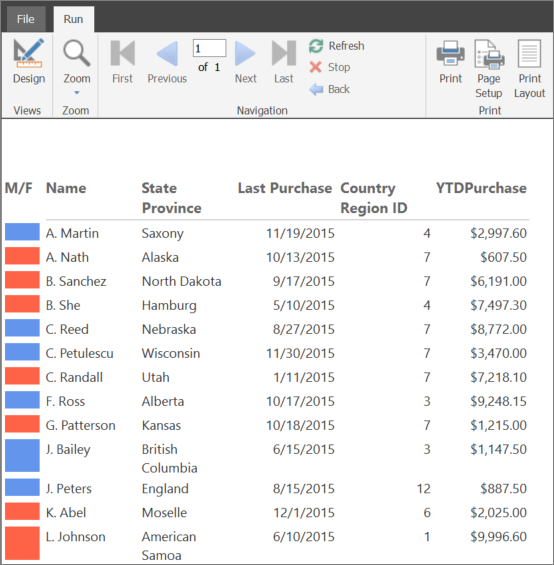
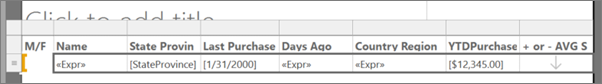
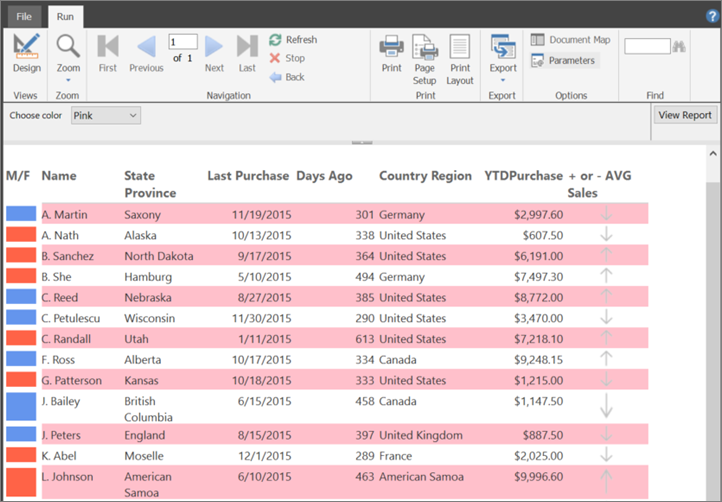
The report is a banded report with alternating rows in white and a color. The report includes a parameter for selecting the color of the nonwhite rows.
This illustration shows a report similar to the one you create in this tutorial.
Estimated time to complete this tutorial: 30 minutes.
Requirements
For information about requirements, see Prerequisites for tutorials (Report Builder).
1. Create a table report and dataset from the table or Matrix Wizard
In this section, you create a table report, a data source, and a dataset. When you lay out the table, you include only a few fields. After you complete the wizard, you manually add columns. The wizard makes it easy to lay out the table.
Note
In this tutorial, the query contains the data values, so it does not need an external data source. This makes the query quite long. In a business environment, a query would not contain the data. This is for learning purposes only.
Create a table report
Start Report Builder either from your computer, the Reporting Services web portal, or SharePoint integrated mode.
The New Report or Dataset dialog box opens.
If you don't see the New Report or Dataset dialog box, on the File menu > New.
In the left pane, verify that New Report is selected.
In the right pane, select Table or Matrix Wizard.
On the Choose a dataset page, select Create a dataset > Next.
On the Choose a connection to a data source page, select a data source that is type SQL Server. Choose a data source from the list or browse to the report server to select one.
Note
The data source you choose isn't important, as long as you have adequate permissions. You will not be getting data from the data source. For more information, see Alternative ways to get a data connection (Report Builder).
Select Next.
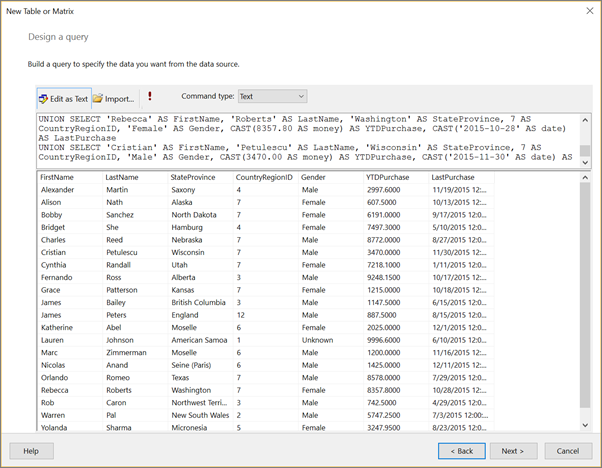
On the Design a query page, select Edit as Text.
Paste the following query into the query pane:
SELECT 'Lauren' AS FirstName,'Johnson' AS LastName, 'American Samoa' AS StateProvince, 1 AS CountryRegionID,'Female' AS Gender, CAST(9996.60 AS money) AS YTDPurchase, CAST('2015-6-10' AS date) AS LastPurchase
UNION SELECT'Warren' AS FirstName, 'Pal' AS LastName, 'New South Wales' AS StateProvince, 2 AS CountryRegionID, 'Male' AS Gender, CAST(5747.25 AS money) AS YTDPurchase, CAST('2015-7-3' AS date) AS LastPurchase
UNION SELECT 'Fernando' AS FirstName, 'Ross' AS LastName, 'Alberta' AS StateProvince, 3 AS CountryRegionID, 'Male' AS Gender, CAST(9248.15 AS money) AS YTDPurchase, CAST('2015-10-17' AS date) AS LastPurchase
UNION SELECT 'Rob' AS FirstName, 'Caron' AS LastName, 'Northwest Territories' AS StateProvince, 3 AS CountryRegionID, 'Male' AS Gender, CAST(742.50 AS money) AS YTDPurchase, CAST('2015-4-29' AS date) AS LastPurchase
UNION SELECT 'James' AS FirstName, 'Bailey' AS LastName, 'British Columbia' AS StateProvince, 3 AS CountryRegionID, 'Male' AS Gender, CAST(1147.50 AS money) AS YTDPurchase, CAST('2015-6-15' AS date) AS LastPurchase
UNION SELECT  'Bridget' AS FirstName, 'She' AS LastName, 'Hamburg' AS StateProvince, 4 AS CountryRegionID, 'Female' AS Gender, CAST(7497.30 AS money) AS YTDPurchase, CAST('2015-5-10' AS date) AS LastPurchase
UNION SELECT 'Alexander' AS FirstName, 'Martin' AS LastName, 'Saxony' AS StateProvince, 4 AS CountryRegionID, 'Male' AS Gender, CAST(2997.60 AS money) AS YTDPurchase, CAST('2015-11-19' AS date) AS LastPurchase
UNION SELECT 'Yolanda' AS FirstName, 'Sharma' AS LastName ,'Micronesia' AS StateProvince, 5 AS CountryRegionID, 'Female' AS Gender, CAST(3247.95 AS money) AS YTDPurchase, CAST('2015-8-23' AS date) AS LastPurchase
UNION SELECT 'Marc' AS FirstName, 'Zimmerman' AS LastName, 'Moselle' AS StateProvince, 6 AS CountryRegionID, 'Male' AS Gender, CAST(1200.00 AS money) AS YTDPurchase, CAST('2015-11-16' AS date) AS LastPurchase
UNION SELECT 'Katherine' AS FirstName, 'Abel' AS LastName, 'Moselle' AS StateProvince, 6 AS CountryRegionID, 'Female' AS Gender, CAST(2025.00 AS money) AS YTDPurchase, CAST('2015-12-1' AS date) AS LastPurchase
UNION SELECT 'Nicolas' as FirstName, 'Anand' AS LastName, 'Seine (Paris)' AS StateProvince, 6 AS CountryRegionID, 'Male' AS Gender, CAST(1425.00 AS money) AS YTDPurchase, CAST('2015-12-11' AS date) AS LastPurchase
UNION SELECT 'James' AS FirstName, 'Peters' AS LastName, 'England' AS StateProvince, 12 AS CountryRegionID, 'Male' AS Gender, CAST(887.50 AS money) AS YTDPurchase, CAST('2015-8-15' AS date) AS LastPurchase
UNION SELECT 'Alison' AS FirstName, 'Nath' AS LastName, 'Alaska' AS StateProvince, 7 AS CountryRegionID, 'Female' AS Gender, CAST(607.50 AS money) AS YTDPurchase, CAST('2015-10-13' AS date) AS LastPurchase
UNION SELECT 'Grace' AS FirstName, 'Patterson' AS LastName, 'Kansas' AS StateProvince, 7 AS CountryRegionID, 'Female' AS Gender, CAST(1215.00 AS money) AS YTDPurchase, CAST('2015-10-18' AS date) AS LastPurchase
UNION SELECT 'Bobby' AS FirstName, 'Sanchez' AS LastName, 'North Dakota' AS StateProvince, 7 AS CountryRegionID, 'Female' AS Gender, CAST(6191.00 AS money) AS YTDPurchase, CAST('2015-9-17' AS date) AS LastPurchase
UNION SELECT 'Charles' AS FirstName, 'Reed' AS LastName, 'Nebraska' AS StateProvince, 7 AS CountryRegionID, 'Male' AS Gender, CAST(8772.00 AS money) AS YTDPurchase, CAST('2015-8-27' AS date) AS LastPurchase
UNION SELECT 'Orlando' AS FirstName, 'Romeo' AS LastName, 'Texas' AS StateProvince, 7 AS CountryRegionID, 'Male' AS Gender, CAST(8578.00 AS money) AS YTDPurchase, CAST('2015-7-29' AS date) AS LastPurchase
UNION SELECT 'Cynthia' AS FirstName, 'Randall' AS LastName, 'Utah' AS StateProvince, 7 AS CountryRegionID, 'Female' AS Gender, CAST(7218.10 AS money) AS YTDPurchase, CAST('2015-1-11' AS date) AS LastPurchase
UNION SELECT 'Rebecca' AS FirstName, 'Roberts' AS LastName, 'Washington' AS StateProvince, 7 AS CountryRegionID, 'Female' AS Gender, CAST(8357.80 AS money) AS YTDPurchase, CAST('2015-10-28' AS date) AS LastPurchase
UNION SELECT 'Cristian' AS FirstName, 'Petulescu' AS LastName, 'Wisconsin' AS StateProvince, 7 AS CountryRegionID, 'Male' AS Gender, CAST(3470.00 AS money) AS YTDPurchase, CAST('2015-11-30' AS date) AS LastPurchase
On the query designer toolbar, select Run (!). The result set displays 23 rows of data in the following columns: FirstName, LastName, StateProvince, CountryRegionID, Gender, YTDPurchase, and LastPurchase.
Select Next.
On the Arrange fields page, drag the following fields, in the specified order, from the Available Fields list to the Values list.
- StateProvince
- CountryRegionID
- LastPurchase
- YTDPurchase
Because the CountryRegionID and YTDPurchase contain numeric data, the SUM aggregate is applied to them by default, but you don't want them to be sums.
In the Values list, right-click CountryRegionID and clear the Sum check box.
Sum is no longer applied to CountryRegionID.
In the Values list, right-click YTDPurchase and select the Sum option.
Sum is no longer applied to YTDPurchase.

select Next.
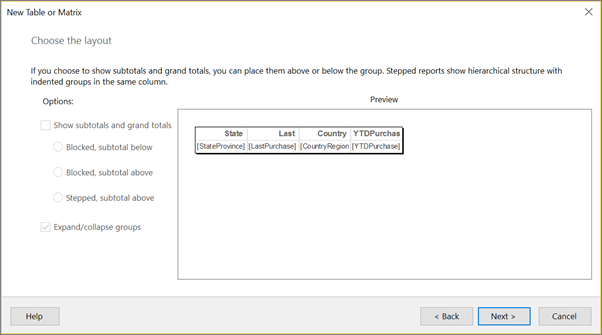
On the Choose the layout page, keep all the default settings and select Next.
Select Finish.
2. Update default names of the data source and dataset
Update the default name of the data source
In the Report Data pane, expand the Data Sources folder.
Right-click DataSource1 and select Data Source Properties.
In the Name box, enter ExpressionsDataSource
Select OK.
Update the default name of the dataset
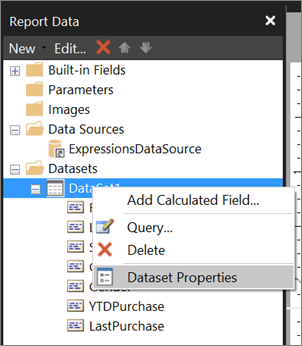
In the Report Data pane, expand the Datasets folder.
Right-click DataSet1 and select Dataset Properties.
In the Name box, enter Expressions
Select OK.
3. Display first initial and last name
In this section, you use the Left function and the Concatenate (&) operator in an expression that evaluates to a name that includes an initial and a last name. You can build the expression step by step or skip ahead in the procedure and copy/paste the expression from the tutorial into the Expression dialog box.
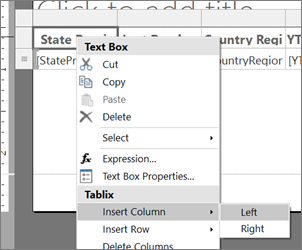
Right-click the StateProvince column, point to Insert Column, and then select Left.
A new column is added to the left of the StateProvince column.
Select the header of the new column and enter Name.
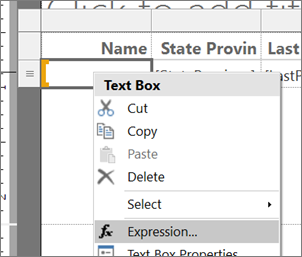
Right-click the data cell for the Name column and select Expression.
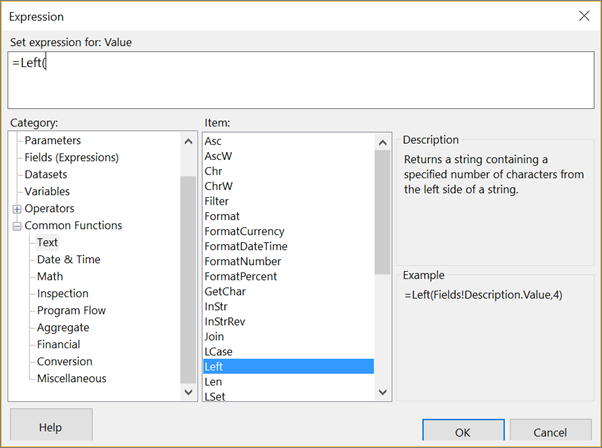
In the Expression dialog box, expand Common Functions, and then select Text.
In the Item list, double-click Left.
The Left function is added to the expression.
In the Category list, select Fields (Expressions).
In the Values list, double-click FirstName.
Enter , 1)
This expression extracts one character from the FirstName value, counting from the left.
Enter &". "&
This expression adds a period and a space after the expression.
In the Values list, double-click LastName.
The completed expression is:
=Left(Fields!FirstName.Value, 1) &". "& Fields!LastName.Value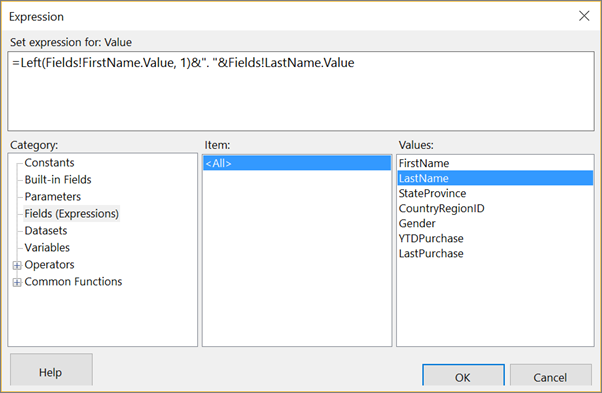
Select OK.
Select Run to preview the report.
(Optional) Format the date and currency columns and header row
In this section, you format the Last Purchase column, which contains dates, and the YTDPurchase column, which contains currency. You also format the header row.
Format the date column
Select Design to return to design view.
Select the data cell in the Last Purchase column, and on the Home tab > Number section, choose Date.

Also in the Number section, select the arrow next to Placeholder Styles and choose Sample Values.

Now you can see an example of the formatting you selected.
Format the currency column
- Select the data cell in the YTDPurchase column, and in the Number section, choose Currency Symbol.
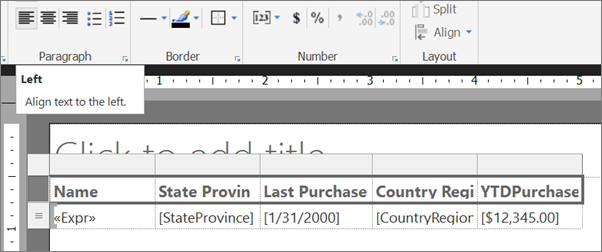
Format the column headers
Select the row of column headers.
On the Home tab > Paragraph section, select Left.
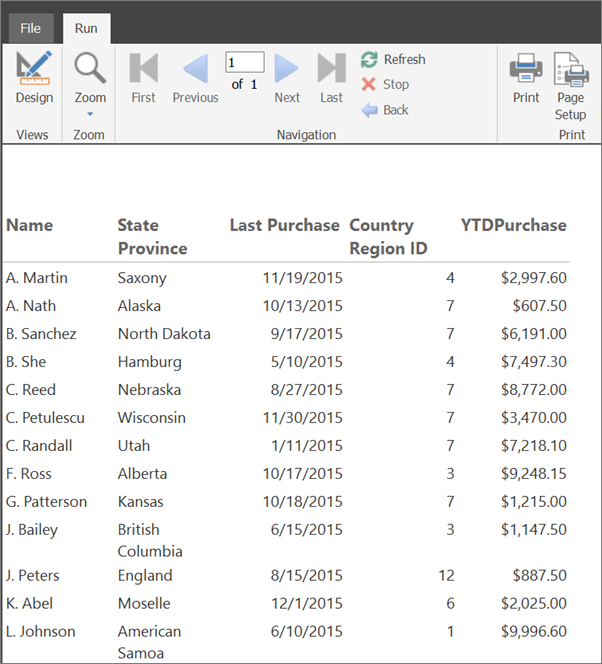
Select Run to preview the report.
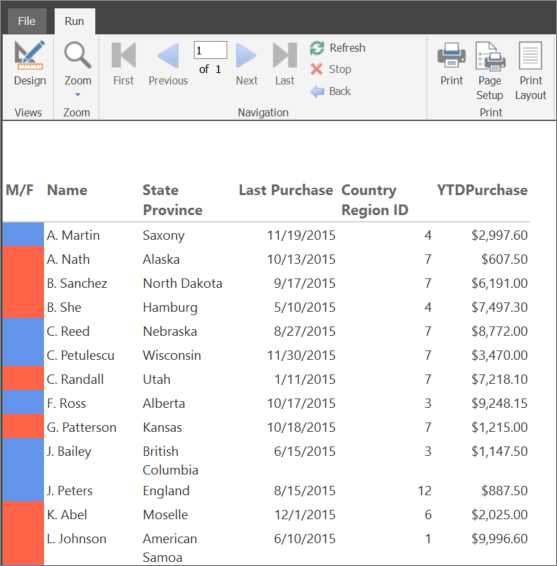
Here's the report so far, with formatted dates, currency, and column headers.
4. Use color to display gender
In this section, you add color to show the gender of a person. You add a new column to display the color, and then determine the color that appears in the column based on the value of the Gender field.
If you want to keep the color you apply in that table cell when you make the report a banded report, you add a rectangle. Then you add the background color to the rectangle.
Add an M/F column
Right-click the Name column, point to Insert Column, and then select Left.
A new column is added to the left of the Name column.
Select the header of the new column and enter M/F.
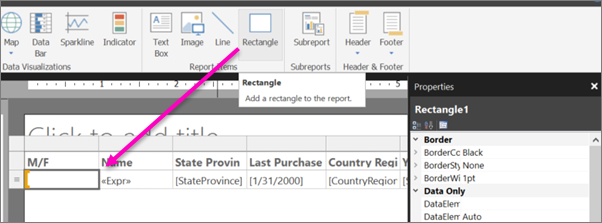
Add a rectangle
On the Insert tab, select Rectangle and then choose in the data cell of the M/F column.
A rectangle is added to the cell.
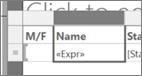
Drag the column divider between the M/F and the Name to make the M/F column narrower.
Use color to show gender
Right-click the rectangle in the data cell in the M/F column and select Rectangle Properties.
In the Rectangle Properties dialog box > Fill tab, select the expression fx button next to Fill color.
In the Expression dialog box, expand Common Functions and select Program Flow.
In the Item list, double-click Switch.
In the Category list, select Fields (Expressions).
In the Values list, double-click Gender.
Enter ="Male", (including the comma).
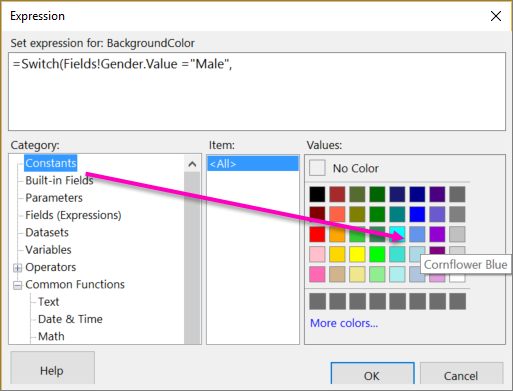
In the Category list, select Constants, and in the Values box, choose Cornflower Blue.
Enter a comma after it.
In the Category list, select Fields (Expressions), and in the Values list, double-click Gender again.
Enter ="Female", (including the comma).
In the Category list, select Constants, and in the Values box, choose Tomato.
Enter a closing parenthesis ) after it.
The completed expression is:
=Switch(Fields!Gender.Value ="Male", "CornflowerBlue",Fields!Gender.Value ="Female","Tomato")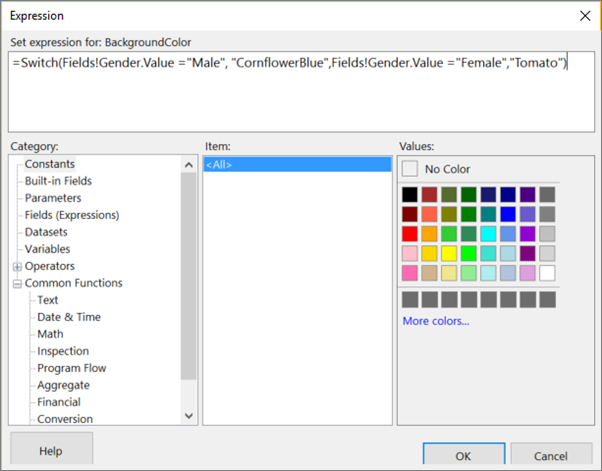
Select OK, then choose OK again to close the Rectangle Properties dialog box.
Select Run to preview the report.
Format the color rectangles
Select Design to return to design view.
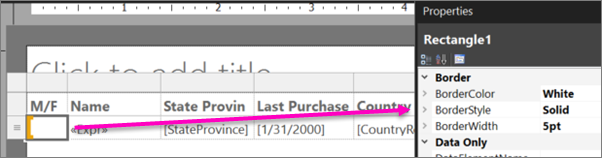
Select the rectangle in the M/F column. In the Properties pane, in the Border section, set these properties:
- BorderColor = White
- BorderStyle = Solid
- BorderWidth = 5pt
Select Run to preview the report again. This time the color blocks have white space around them.
5. Look up the CountryRegion name
In this section, you create the CountryRegion dataset and use the Lookup function to display the name of a country/region instead of the identifier of the country/region.
Create the CountryRegion dataset
Select Design to return to design view.
In the Report Data pane, select New and then choose Dataset.
In Dataset Properties, select Use a dataset embedded in my report.
In the Data source list, select ExpressionsDataSource.
In the Name box, enter CountryRegion
Verify that the Text query type is selected and select Query Designer.
Select Edit as Text.
Copy and paste the following query into the query pane:
SELECT 1 AS ID, 'American Samoa' AS CountryRegion
UNION SELECT 2 AS CountryRegionID, 'Australia' AS CountryRegion
UNION SELECT 3 AS ID, 'Canada' AS CountryRegion
UNION SELECT 4 AS ID, 'Germany' AS CountryRegion
UNION SELECT 5 AS ID, 'Micronesia' AS CountryRegion
UNION SELECT 6 AS ID, 'France' AS CountryRegion
UNION SELECT 7 AS ID, 'United States' AS CountryRegion
UNION SELECT 8 AS ID, 'Brazil' AS CountryRegion
UNION SELECT 9 AS ID, 'Mexico' AS CountryRegion
UNION SELECT 10 AS ID, 'Japan' AS CountryRegion
UNION SELECT 10 AS ID, 'Australia' AS CountryRegion
UNION SELECT 12 AS ID, 'United Kingdom' AS CountryRegion
Select Run (!) to run the query.
The query results are the country/region identifiers and names.
Select OK.
Select OK again to close the Dataset Properties dialog box.
Now you have a second dataset in the Report Data column.
Look up values in the CountryRegion dataset
Select the Country Region ID column header and delete the text: ID, so it reads Country Region.
Right-click the data cell for the Country Region column and select Expression.
Delete the expression except the initial equal (=) sign.
The remaining expression is:
=In the Expression dialog box, expand Common Functions and select Miscellaneous, and in the Item list, double-click Lookup.
In the Category list, select Fields (Expressions), and in the Values list, double-click CountryRegionID.
Place the cursor immediately after
CountryRegionID.Value, and enter ,Fields!ID.value, Fields!CountryRegion.value, "CountryRegion").The completed expression:
=Lookup(Fields!CountryRegionID.Value,Fields!ID.value, Fields!CountryRegion.value, "CountryRegion")The syntax of the Lookup function specifies a lookup between CountryRegionID in the Expressions dataset and ID in the CountryRegion dataset that returns the CountryRegion value from the CountryRegion dataset.
Select OK.
Select Run to preview the report.
6. Count days since last purchase
In this section, you add a column and then use the Now function or the ExecutionTime built-in global variable to calculate the number of days from today since a customer's last purchases.
Add the Days Ago column
Select Design to return to design view.
Right-click the Last Purchase column, point to Insert Column, and then select Right.
A new column is added to the right of the Last Purchase column.
In the column header, enter Days Ago.
Right-click the data cell for the Days Ago column and select Expression.
In the Expression dialog box, expand Common Functions, and then select Date & Time.
In the Item list, double-click DateDiff.
Immediately after
DateDiff(, enter "d", (including the quotation marks "" and comma).In the Category list, select Fields (Expressions), and in the Values list, double-click LastPurchase.
Immediately after
Fields!LastPurchase.Value, enter , (a comma).In the Category list, select Date & Time again, and in the Item list, double-click Now.
Warning
In production reports you should not use the Now function in expressions that are evaluated multiple times as the report renders (for example, in the detail rows of a report). The value of Now changes from row to row and the different values affect the evaluation results of expressions, which leads to results that are subtly inconsistent. Instead, use the
ExecutionTimeglobal variable that Reporting Services provides.Delete the left parenthesis after
Now(, and then enter a right parenthesis ).The completed expression is:
=DateDiff("d", Fields!LastPurchase.Value, Now)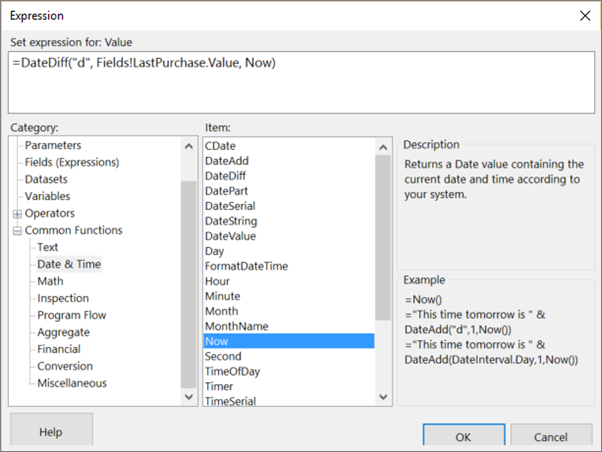
Select OK.
Select Run to preview the report.
7. Use an indicator to show sales comparison
In this section, you add a new column and use an indicator to show whether a person's year-to-date (YTD) purchases are greater or less than the average YTD purchases. The Round function removes decimals from values.
Configuring the indicator and its states takes many steps. If you want, you can skip ahead in the "To configure the indicator" procedure, and copy/paste the completed expressions from this tutorial into the Expression dialog box.
Add the + or - AVG Sales column
Right-click the YTD Purchase column, point to Insert Column, and then select Right.
A new column is added to the right of the YTD Purchase column.
Select the column header and enter + or - AVG Sales.
Add an indicator
On the Insert tab, select Indicator, and then choose the data cell for the + or - AVG Sales column.
The Select Indicator Type dialog box opens.
In the Directional group of icon sets, select the set of three gray arrows.
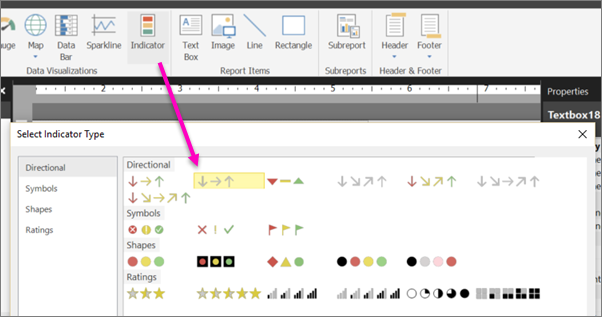
Select OK.
Configure the indicator
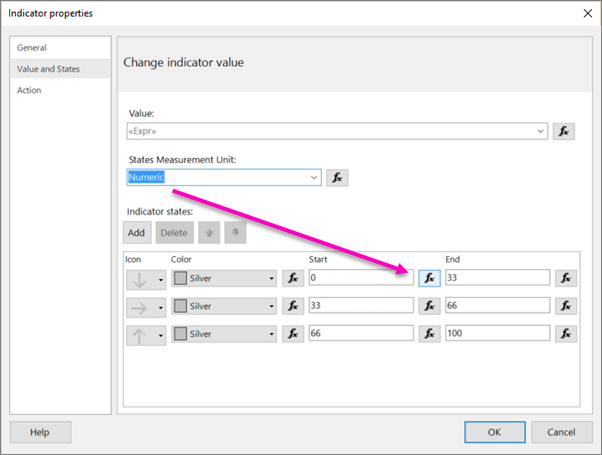
Right-click the indicator, select Indicator Properties, and then choose Value and States.
Select the expression fx button next to the Value text box.
In the Expression dialog box, expand Common Functions, and then select Math.
In the Item list, double-click Round.
In the Category list, select Fields (Expressions), and in the Values list, double-click YTDPurchase.
Immediately after
Fields!YTDPurchase.Value, enter - (a minus sign).Expand Common Functions again, select Aggregate, and in the Item list, double-click Avg.
In the Category list, select Fields (Expressions), and in the Values list, double-click YTDPurchase.
Immediately after
Fields!YTDPurchase.Value, enter , "Expressions")).The completed expression is:
=Round(Fields!YTDPurchase.Value - Avg(Fields!YTDPurchase.Value, "Expressions"))Select OK.
In the States Measurement Unit box, select Numeric.
In the row with the down-pointing arrow, select the fx button to the right of the text box for the Start value.
In the Expression dialog box, expand Common Functions, and then select Math.
In the Item list, double-click Round.
In the Category list, select Fields (Expressions), and in the Values list, double-click YTDPurchase.
Immediately after
Fields!YTDPurchase.Value, enter - (a minus sign).Expand Common Functions again and select Aggregate, and in the Item list, double-click Avg.
In the Category list, select Fields (Expressions), and in the Values list, double-click YTDPurchase.
Immediately after
Fields!YTDPurchase.Value, enter , "Expressions")) < 0The completed expression:
=Round(Fields!YTDPurchase.Value - Avg(Fields!YTDPurchase.Value, "Expressions")) < 0Select OK.
In the text box for the End value, enter 0.
Select the row with the horizontal-pointing arrow and choose Delete.
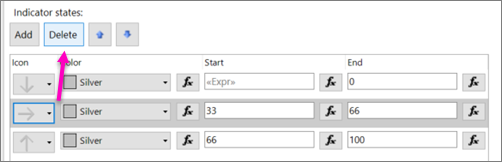
Now there are only two arrows, either up or down.
In the row with the up-pointing arrow, in the Start box, enter 0.
Select the fx button to the right of the text box for the End value.
In the Expression dialog box, delete 100 and create the expression:
=Round(Fields!YTDPurchase.Value - Avg(Fields!YTDPurchase.Value, "Expressions")) >0Select OK.
Select OK again to close the Indicator properties dialog box.
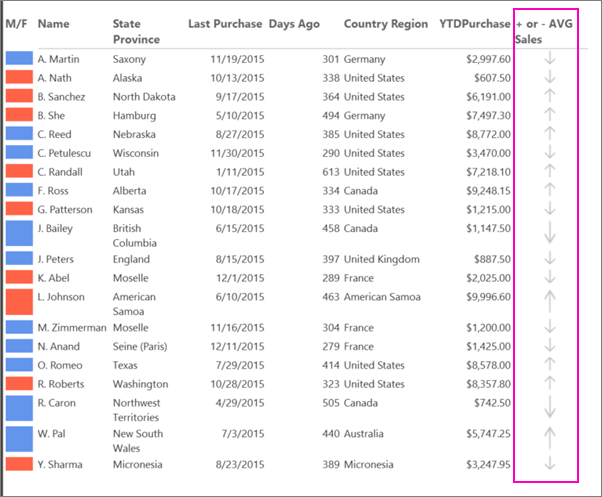
Select Run to preview the report.
8. Make a banded report
Create a parameter so report readers can specify the color to apply to alternating rows in the report, making it a banded report.
Add a parameter
Select Design to return to design view.
In the Report Data pane, right-click Parameters and select Add Parameter.
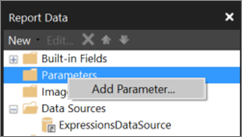
The Report Parameter Properties dialog box opens.
In Prompt, enter Choose color.
In Name, enter RowColor.
On the Available Values tab, select Specify values.
Select Add.
In the Label box, enter Yellow.
In the Value box, enter Yellow.
Select Add.
In the Label box, enter Green.
In the Value box, enter PaleGreen.
Select Add.
In the Label box, enter Blue.
In the Value box, enter LightBlue.
Select Add.
In the Label box, enter Pink.
In the Value box, enter Pink.
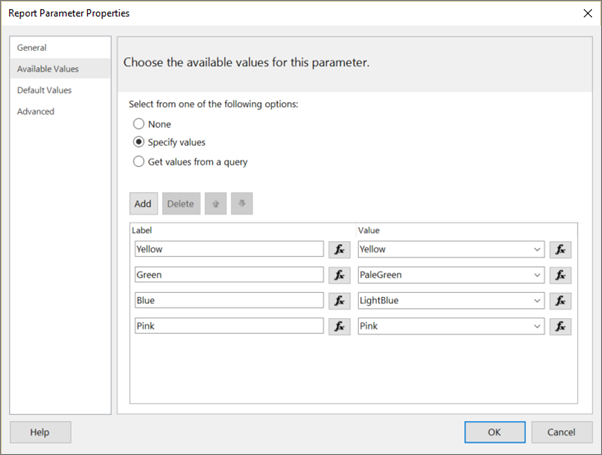
Select OK.
Apply alternating colors to detail rows
- Select all the cell in the data row except the cell in the M/F column, which has its own background color.
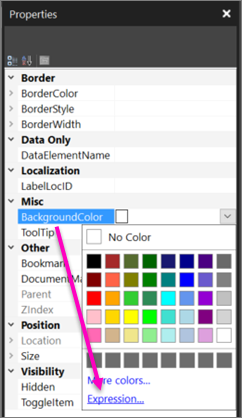
In the Properties pane, select BackgroundColor.
If you don't see the Properties pane, on the View tab select the Properties box.
If the properties are listed by category in the Properties pane, you find BackgroundColor in the Misc category.
Select the down arrow and then choose Expression.
In the Expression dialog box, expand Common Functions, and then select Program Flow.
In the Item list, double-click IIf.
Under Common Functions, select Miscellaneous, and in the Item list, double-click RowNumber.
Immediately after RowNumber( enter Nothing) MOD 2,.
Select Parameters and in the Values list, double-click RowColor.
Immediately after
Parameters!RowColor.Value, enter , "White").The completed expression is:
=IIF(RowNumber(Nothing) MOD 2, Parameters!RowColor.Value, "White")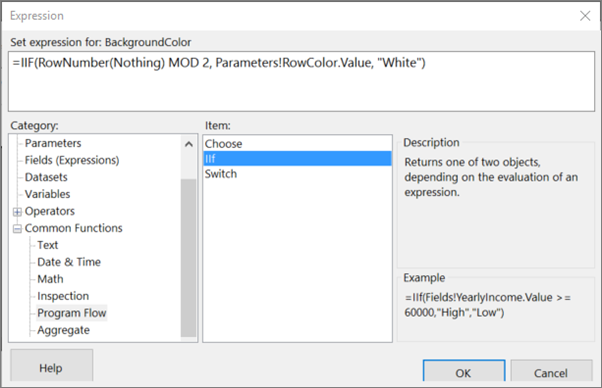
Select OK.
Run the report
On the Home tab, select Run.
Now when you run the report, you don't see the report until you choose a color for the nonwhite bands.
In the Choose color list, select a color for the nonwhite bands in the report.
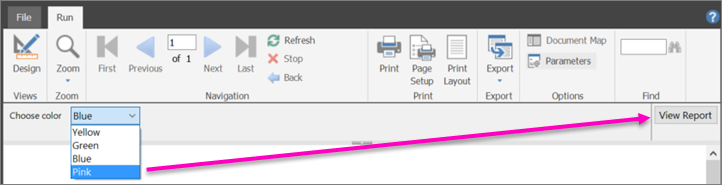
Select View Report.
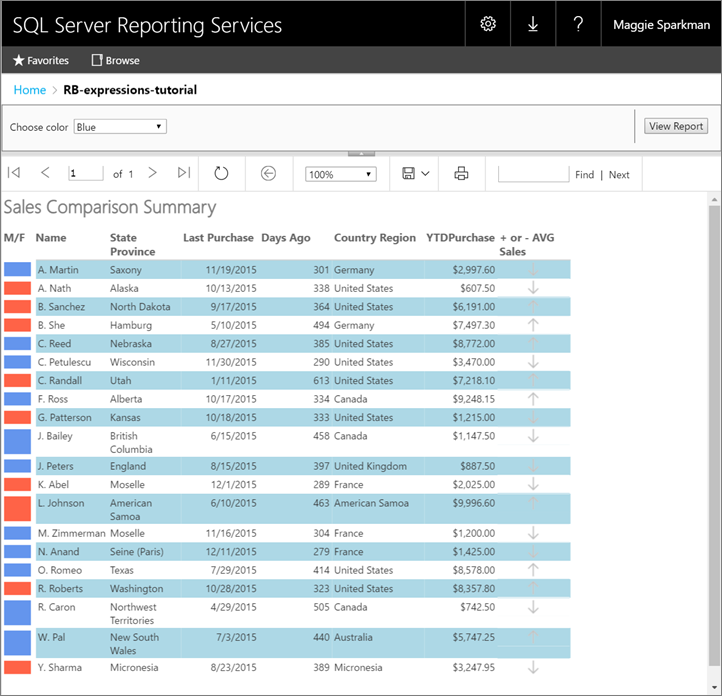
The report renders and alternating rows have the background that you chose.
(Optional) Add a report title
Add a title to the report.
Add a report title
On the design surface, select Click to add title.
Enter Sales Comparison Summary, then select the text.
On the Home tab, in the Font box, set:
- Size = 18
- Color = Gray
- Bold
On the Home tab, select Run.
Select a color for the nonwhite bands in the report, and choose View Report.
(Optional) Save the report
You can save reports to a report server, SharePoint library, or your computer. For more information, see Save reports (Report Builder).
In this tutorial, you save the report to a report server. If you don't have access to a report server, save the report to your computer.
Save the report to a report server
On the File menu, select Save As.
Select Recent Sites and Servers.
Select or enter the name of the report server where you have permission to save reports.
The message "Connecting to report server" appears. When the connection is complete, you see the contents of the report folder that the report server administrator specified as the default report location.
Give the report a name and select Save.
The report is saved to the report server. The name of report server that you're connected to appears in the status bar at the bottom of the window.
Now your report readers can view your report in the Reporting Services web portal.
Related content
- Expressions in a paginated report (Report Builder)
- Expression examples in paginated reports (Report Builder)
- Indicators in a paginated report (Report Builder)
- Images, text boxes, rectangles, and lines in a paginated report (Report Builder)
- Tables in paginated reports (Report Builder)
- Report datasets (SSRS)