Exercise - Monitor performance of your cluster
In this exercise, you’ll walk through different features of Container insights to view the performance and status of different components of your monitored cluster. This is just a sample of the different options that are available to give you a complete picture of the health and performance of your cluster.
Search for and select Monitor in the Azure portal.
Select Containers, then Monitored clusters. Your cluster appears in the list with the health status of the cluster and its nodes and pods.

Select your cluster to view its performance in more detail. Start with the Cluster page, which shows you performance graphs for the cluster itself. This page has a high-level view with key cluster resources such as CPU and Memory utilization to help you gauge whether you are using too much or too little, and need to scale up or down.
Change the Time range at the top of the screen to change the time window for the displayed data. You might want to view data older than the default or target the graph to a smaller time window.
Select Live to change from a past time interval to live data being collected every few seconds. This data is being stored by Container insights as it's being collected.

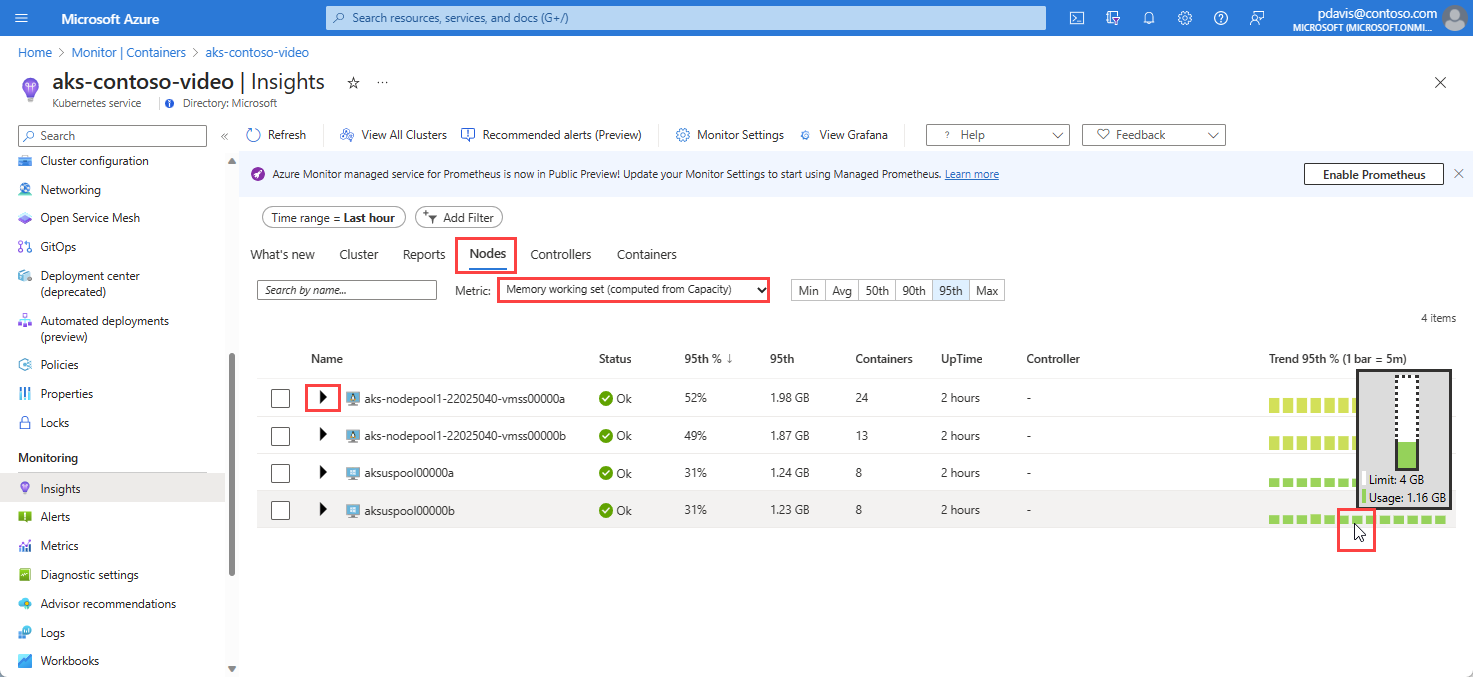
Select the Nodes tab to view each of the nodes for the cluster. The row hierarchy follows the Kubernetes object model, which starts with a node in your cluster.
The icons in the Status column indicate the online statuses of the pods.
From the Metric drop-down at the top of the page, select Memory working set (computed from Capacity).
Hover over one of the metric trend charts to show the detailed memory working set in use, compared to the defined limit. This helps you gauge how efficiently the nodes resources are being used, which highlights underutilized or overutilized nodes.
Expand a node to view the pods running on that node.
Expand a pod to see the containers grouped into the pod, they're displayed as the last row in the hierarchy.
Use this page to drill into a specific node to see what's running on that node and consuming Node CPU and Memory resources.

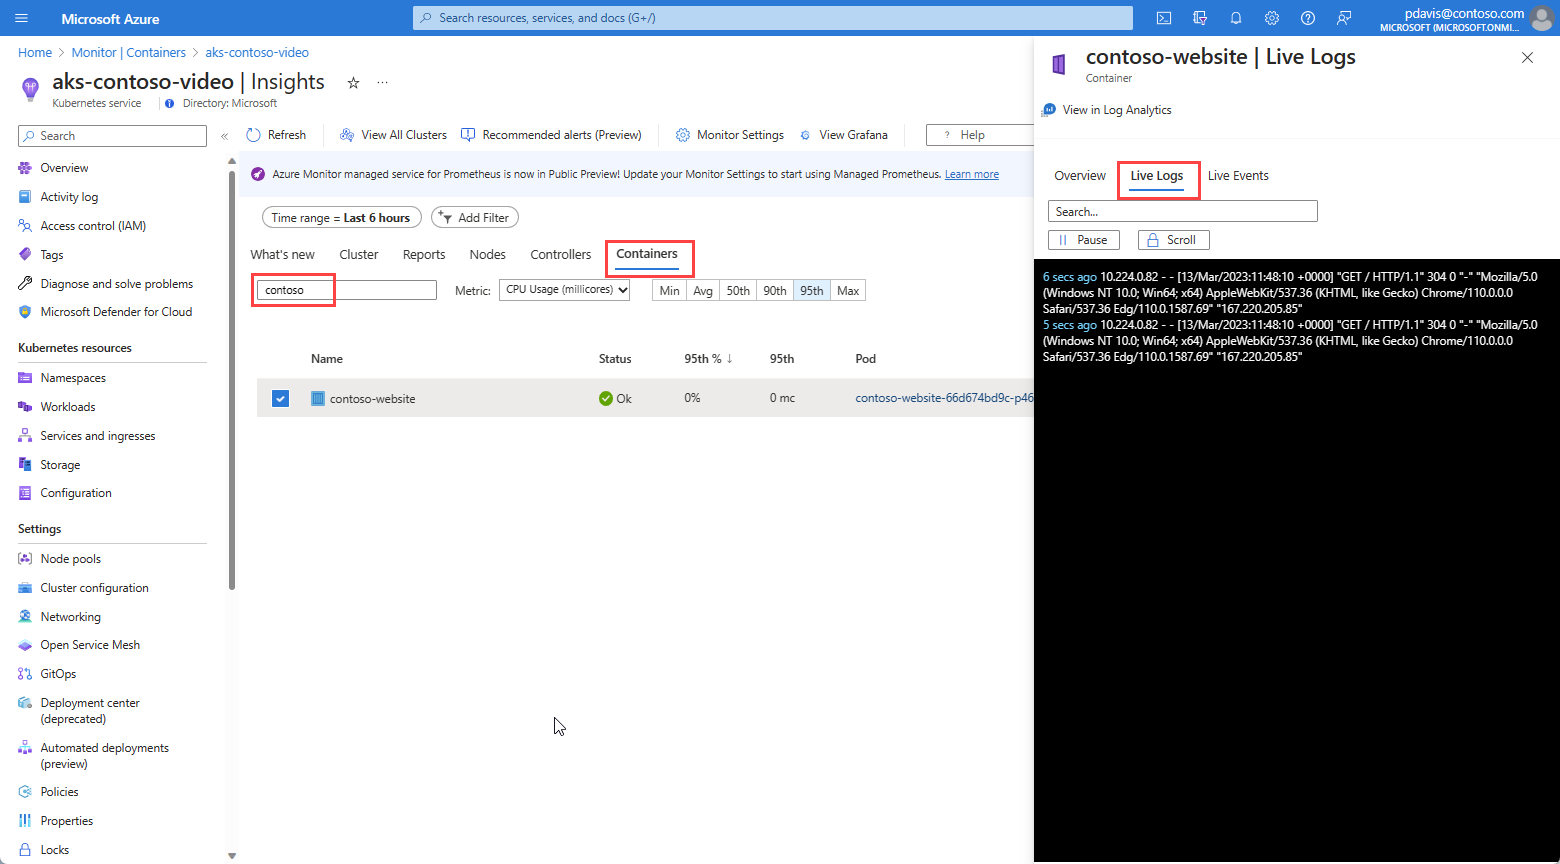
Go to the Containers tab and search for contoso-website. This is the container for the application workload in the sample application. This page shows you an individual pod and the resources it is using, along with the container logs.
Select the contoso-website container to view its properties pane.
Select the Live Logs tab to display the real-time log data for the container. You might need to generate some traffic to generate log data to view.