Lab - Analyze data
This unit includes a lab to complete.
Use the free resources provided in the lab to complete the exercises in this unit. You won't be charged.
Access your environment
Before you start this lab, select Launch lab above.
To log into your lab environment:
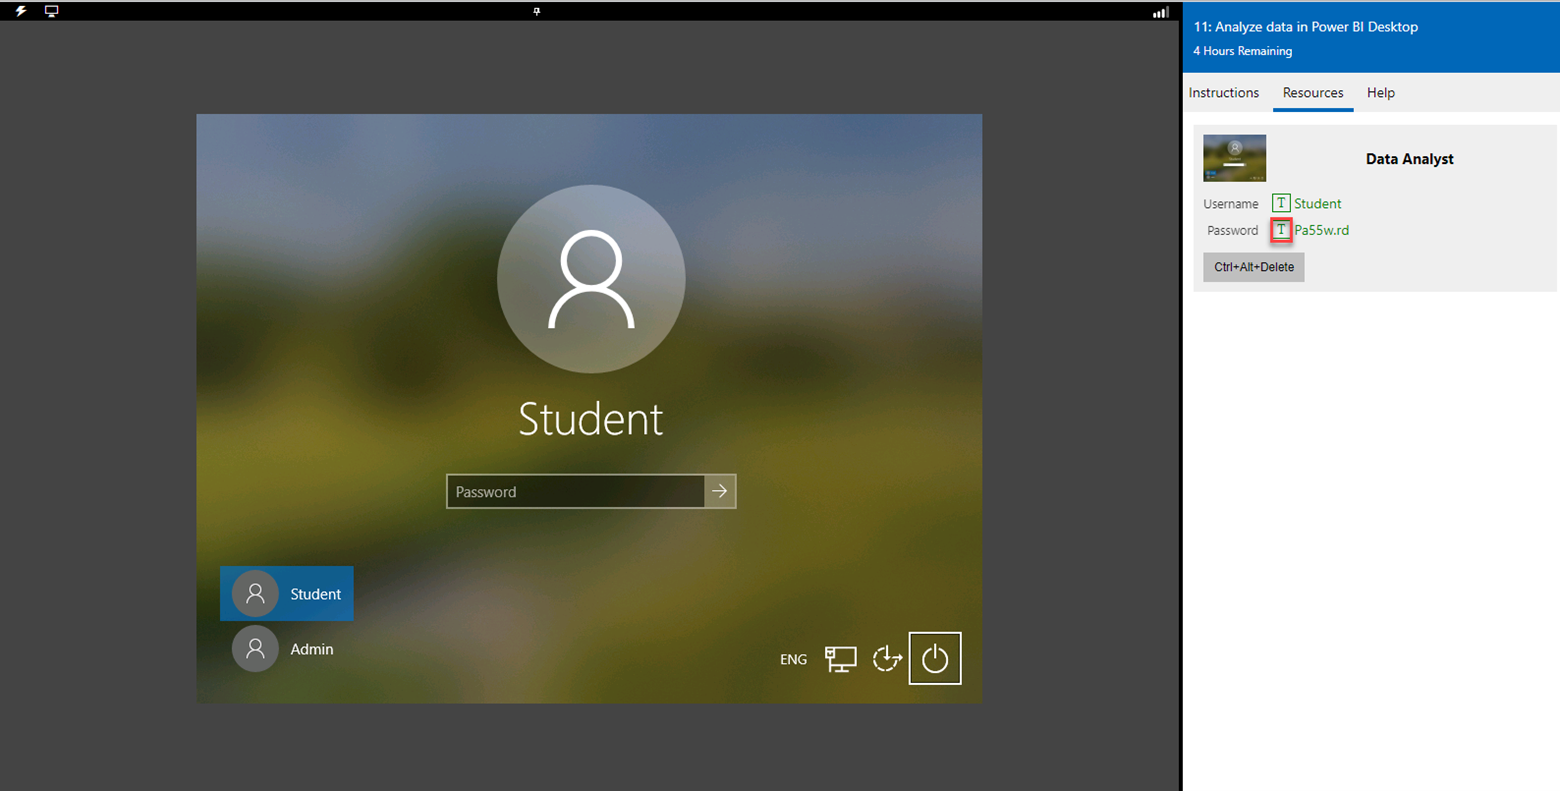
Click anywhere on the Windows desktop in the lab window.
On the Resources tab on the lab side bar, select the T icon next to Password. The machine password is automatically entered for you. You can sign in with the Student profile.
Press Enter.

You can now begin your work on this lab.
Microsoft Dynamics 365 Sales offers multiple options for finding, viewing, and analyzing data.
Learning objectives
At the end of these exercises, you'll be able to perform the following tasks:
Use Advanced Find to create personal Microsoft Dynamics 365 views.
Export Dynamics 365 data and analyze it by using Microsoft Excel.
Create a personal dashboard.
Qualify and disqualify a lead.
Access your hosted lab environment
Before you start this lab, you'll need to open the lab environment link above, and sign in to the lab environment. There's no need to provide your own Dynamics environment, as an environment and an account have been prepared for this lab.
Note
If you are currently logged into Dynamics 365, you may be signed out of your account before this lab begins.
To log into your lab account:
When your lab environment opens, you'll see the Microsoft Sign-in page on the left-hand side. If you're asked to Pick an Account, choose Use another account.
On the right-hand lab window, select the Resources tab, and select the value for Username to copy it. Paste this value into the textbox on the left-hand side of the screen underneath Sign in, then select Next.
You'll now be prompted for a password. Under Resources in the right-hand window, select the value for Password to copy it. Paste it into the left-hand window in the text box below Enter password. Then, select Next.
On the Would you like to store your password for microsoftonline.com window, select Not for this site.
You're now logged into Dynamics 365 and can begin your lab.
Use Dynamics 365 together with Microsoft 365
Many of the people on your sales team are power users of Excel. They like to be able to work with Dynamics 365 data in Excel. Several of them have commented that it can be a little cumbersome to export data to Excel, edit it, and then import it back into Dynamics 365. They're looking for an easier way to work with Dynamics 365 data in Excel.
Most of the time, when you do bulk edits, you're changing opportunities that have an estimated revenue of more than $20,000 and a rating of hot, so you want to start there. You want to make it as easy as possible to edit those records in Excel and commit the changes back into Dynamics 365.
Using the navigation on the left, select Opportunities under the Sales group.
In the upper right corner of the screen, the Advanced Find (Filter Icon) button.
On the Select a table to search pane, select Opportunities.
Select the Continue button.
On the Edit filters: Opportunities screen, select the ellipsis next to the Owner filter. From the menu that appears, select Delete.
Make sure that the Status – Equals – Open is still displayed. DO NOT REMOVE IT.
Under the Status filter, select the Add button. From the menu that appears select Add row.
In the Select a field drop-down, select Rating.
Set the Rating filter as follows:
- Rating – Equals – Hot
Under the Rating filter, select the Add button. From the menu that appears, select Add row.
In the Select a field drop-down, select Est. Revenue.
Set the Est. Revenue filter as follows:
- Est. Revenue – Is Greater Than – 20,000
Select the Apply icon to view the results.
Once the results are displayed, select the down arrow next to My Open Opportunities*.
From the menu that appears, select Save as new view.
In the Save as New view dialog box, set the following values:
Name: Hot Opportunities over 20 K – Your Initials.
Description: Leave this field blank.
Select Save.
The Hot Opportunities over 20K – Your Initials view shouldn't be displayed.
On the command bar, select Export to Excel, and then, on the menu that appears, select Open in Excel Online.
Microsoft Excel Online is opened inside Dynamics 365. (If Export to Excel isn't displayed, select the vertical ellipsis.)
Find an opportunity that has a blank Probability field. Set the Probability field to 65.
Select the Save Button.
Select Close. It might take a few minutes for Dynamics 365 to reflect the changes.
Create an Excel template that other users can use from within Dynamics 365
In the Dynamics 365 Sales Hub app, use the navigation on the left to select Opportunities.
On the command bar, select Excel Templates. From the menu that appears, select Download Template.
In the dialog box, set the following values:
Filter by entity: Opportunity.
Use saved view: Open Opportunities.
Select the Download button.
Open the Open Opportunities template that you downloaded.
Select Enable Editing.
Drag to select the entire table.
On the Insert tab, select PivotTable.
In the Create PivotTable dialog box, set the following values:
Table/Range: Enter Table 1.
New Worksheet: Make sure that this option is selected.
Select OK.
In the PivotTable Fields pane, set the following values:
Values: Add the Sum of Est. Revenue field.
Rows: Add the Rating field.
In Excel, select File > Save As.
Save the file to your Desktop with the name Open Opps with PivotTable – Your Initials.
Close Excel.
Switch back to Dynamics 365 Sales hub.
On the command bar, select Excel Templates, then on the menu that appears, select Upload Template.
Select the file that you changed in Excel, and select Upload.
If necessary, use the navigation on the left to go to Opportunities.
On the command bar, select Excel Templates. On the menu that appears, select the Open Opps with PivotTable – DB template, and then select Open in Excel Online.
Select Return to Dynamics 365 to close the template.
Create and share a dashboard
Scenario
The sales manager for Contoso wants to create a global sales dashboard for their team to use. This dashboard should have a custom view for opportunities and a chart that shows the sales opportunities in a graphical format.
High-level steps
- Create a dashboard that includes an Advanced Find query and a chart.
Detailed steps
Create a dashboard that includes an Advanced Find query and a chart.
In Dynamics 365 Sales Hub, use the left navigation to select Dashboards.
On the command bar, select + New and Dynamics 365 Dashboard.
In the Choose Layout dialog box, select the 3-Column Focused Dashboard layout, and then select Create.
In the New Dashboard window that appears, in the Name field, enter Sales Management Dashboard, and then select Save.
In the dashboard designer, select the left section, and then select the Insert Chart button.
In the Add Component dialog box, set the following values for the new chart component:
Record Type: Opportunity.
View: My Open Opportunities.
Chart: Opportunities by Rating.
Select Add.
In the dashboard designer, select the upper-middle section, and then select the Insert List button.
In the Add Component dialog box, set the following values for the new list component:
Record Type: Opportunities.
View: My Open Opportunities.
Select Add.
In the dashboard designer, select the lower-middle section, and then select the Insert Chart button.
In the Add Component dialog box, set the following values for the new chart component:
Record Type: Opportunities.
View: My Open Opportunities.
Chart: Sales Pipeline.
Select Add.
In the dashboard designer, select the upper-right section, and then select the Insert Iframe button.
In the Add an IFRAME dialog box, set the following values:
URL: Enter https://www.bing.com.
Label: Change the value to Bing Website.
Display label on the Dashboard: Select the check box.
Select OK to close the dialog box.
In the dashboard designer, select the lower-right section, and press the Delete key on your keyboard.
Select the Bing Website iFrame component that you added earlier.
On the command bar, select the ellipsis button (...), then select Increase Height. Repeat this step until the iFrame component fills the remaining empty space on the right side of the dashboard.
On the command bar, select Save and then Close to view the results.
End your lab
To end this lab, select the menu icon in the upper right corner of this instruction window and select End Lab.