Exercise - Identify machines with high CPU usage
Here, you'll write KQL queries to retrieve and transform data from the Perf table to gain an understanding of which machines have reached or are nearing their total compute capacity, and which machines are being underused.
1. Set goals
To address performance issues, mitigate potential issues, and identify opportunities to operate more efficiently, you want to analyze the central processing unit (CPU) usage of virtual machines in your IT environment.
To identify CPU-related performance issues and opportunities to become more efficient, you need information about:
- CPU usage trends of each active machine.
- CPU usage of machines at peak and quiet times.
2. Assess logs
Windows and Linux agents send performance counters of hardware components, operating systems, and applications running on monitored machines to the Perf table in Azure Monitor.
Let's run a simple query on the Perf table to retrieve logs from the past 24 hours and get a sense of the table schema and the data the table holds:
Click to run query in Log Analytics demo environment
Perf  // The table you’re querying
| where TimeGenerated > ago(1d) // Filters for entries generated in the past day

You can see that the TimeGenerated, Computer, ObjectName, CounterName, InstanceName, and CounterValue columns hold data that's relevant to our analysis.
The ObjectName column lists the names of all of the objects for which Azure Monitor collects data from monitored machines. The CounterName column holds the names of the various performance counters that Azure Monitor collects. Both of these columns hold lots of values, many of which appear multiple times. To clearly see the distinct values in these columns and determine which counters are relevant to the current analysis, let's run this query:
Click to run query in Log Analytics demo environment
Perf // The table you’re querying
| distinct ObjectName,CounterName // Lists distinct combinations of ObjectName and CounterName values
This screenshot shows the distinct combinations of ObjectName and CounterName values in the CounterName column in the past 24 hours:

The % Processor Time counter gives you an understanding of the utilization of the processor, or Central Processing Unit (CPU). This is information you need!
Let's assess how we can use this data, and which KQL operations can help extract and transform the data:
| Column | Description | Analysis goal | Related KQL operations |
|---|---|---|---|
TimeGenerated |
Indicates when the virtual machine generated each log. | Define the time scope of the analysis. | where TimeGenerated > ago(1d) For more information, see ago(), where operator, and Numerical operators. |
Computer |
Computer from which the event was collected. | Associate CPU usage with a specific computer. | summarize... by Computer For more information, see summarize operator. |
ObjectName |
Holds the names of all of the objects for which the table holds performance data. | Monitor the performance of the processor. | where ObjectName == "Processor" For more information, see == (equals) operator. |
CounterName |
Holds the names of all of the performance counters in the table. | Monitor the % Processor Time performance counter. |
where CounterName == "% Processor Time" For more information, see where operator and == (equals) operator. |
InstanceName |
Lists the monitored instances of the monitored object. | Monitor all processor cores. | where InstanceName == "_Total" For more information, see where operator and == (equals) operator. |
CounterValue |
The measurement collected for the counter. | Retrieve performance measurements for the % Processor Time performance counter. |
summarize min(CounterValue), avg(CounterValue), max(CounterValue), percentiles(CounterValue, 90,99) For more information, see summarize operator, and the min(), max(), avg(), and percentiles() aggregation functions. |
3. Write your query
Write a query that summarizes the average, minimum and maximum CPU usage of all machines over the past day.
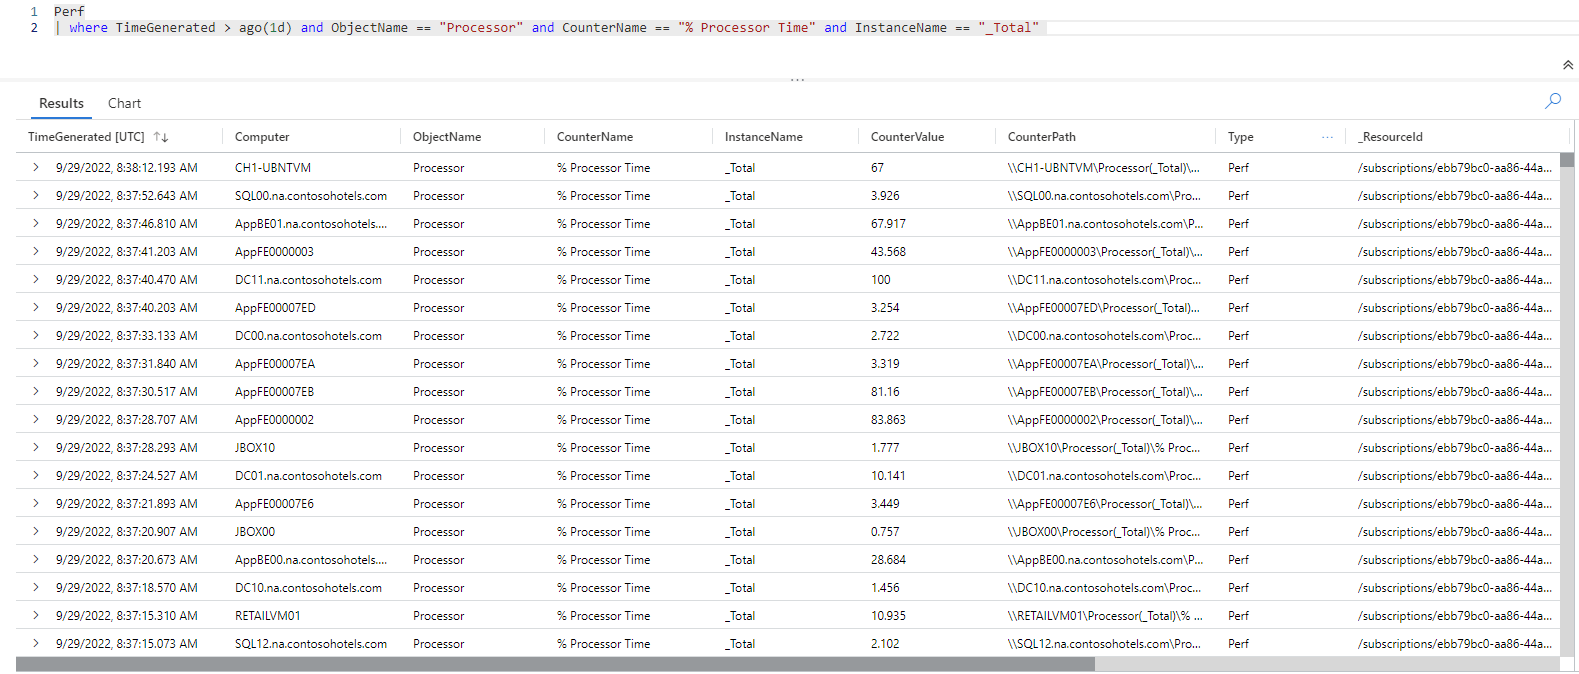
Retrieve all logs generated in the past day that reported the
% Processor Timeperformance counter:Click to run query in Log Analytics demo environment.
Perf  // The table you’re querying
| where TimeGenerated > ago(1d) and ObjectName == "Processor" and CounterName == "% Processor Time" and InstanceName == "_Total" // Filters for entries generated in the past day related to total processor time measurements
This query retrieves all logs related to total processor time measurements from the past day.
Find the minimum, maximum and average counter values, and calculate the 90th and 99th percentile counter values for each computer:
Click to run query in Log Analytics demo environment
Perf  // The table you’re querying
| where TimeGenerated > ago(1d) and ObjectName == "Processor" and CounterName == "% Processor Time" and InstanceName == "_Total" // Filters for entries generated in the past day related to total processor time measurements
| summarize min(CounterValue), avg(CounterValue), max(CounterValue), percentiles(CounterValue, 90,99) by Computer // Presents the minimum, maximum, average, 90th and 99th percentile counter values for each computer
The result set of this query shows the minimum, maximum, average, 90th and 99th percentile
% Processor Timecounter values for each computer for which there's data in your Log Analytics workspace.
Filter the query results for entries where the
% Processor Timecounter value is higher than 80 in the 90th and 99th percentile range:Click to run query in Log Analytics demo environment
Perf  // The table you’re querying
| where TimeGenerated > ago(1d) and ObjectName == "Processor" and CounterName == "% Processor Time" and InstanceName == "_Total" // Filters for entries generated in the past day related to total processor time measurements
| summarize min(CounterValue), avg(CounterValue), max(CounterValue), percentiles(CounterValue, 90,99) by Computer // Presents the minimum, maximum, average, 90th and 99th percentile counter values for each computer
| where percentile_CounterValue_90 > 80 and percentile_CounterValue_99 > 80 // Filters previous query results for instances where the 90th and 99th percentile counters are higher than 80
The result set of this query consists of all computers for which the top 10% and 15%
% Processor Timevalues are over 80.


Challenge: Add operating system information from the Heartbeat table to the query results
You can often get a better understanding of your query results by correlating information from a different table to your query results by using the join operator. For more information, see join operator.
Can you use the join operator to add information about the operating system running on each computer, which is available in the Heartbeat table, as we saw in the first exercise?
Solution:
Add information from the
Heartbeattable about the operating system running on each of the computers in your query results:Click to run query in Log Analytics demo environment
Perf  // The table you’re querying
| where TimeGenerated > ago(1d) and ObjectName == "Processor" and CounterName == "% Processor Time" and InstanceName == "_Total" // Filters for entries generated in the past day related to total processor time measurements
| summarize min(CounterValue), avg(CounterValue), max(CounterValue), percentiles(CounterValue, 90,99) by Computer // Presents the minimum, maximum, average, 90th and 99th percentile counter values for each computer
| where percentile_CounterValue_90 > 80 and percentile_CounterValue_99 > 80 // Filters previous query results for instances where the 90th and 99th percentile counters are higher than 50
| join kind=inner (Heartbeat // Introduces data from the "Heartbeat" table to the previous query results
| where TimeGenerated > ago(1d) // Time range for the data added from the "Heartbeat" table
| distinct Computer, OSType) on Computer // Adds distinct combinations of computer and operating system
This iteration of the query adds the
ComputerandOSTypecolumns from theHeartbeattable to the previous query results.
The
Computercolumn now appears twice in the query results - once from the query on thePerftable and once from the query on theHeartbeattable. TheComputercolumn from theHeartbeattable has been renamedComputer1, but the two tables contain identical data. Having both columns enables correlating the results from the two tables, but you can now filter away the duplicate column.Remove the
Computer1column from the query results:Click to run query in Log Analytics demo environment
Perf  // The table you’re querying
| where TimeGenerated > ago(1d) and ObjectName == "Processor" and CounterName == "% Processor Time" and InstanceName == "_Total" // Filters for entries generated in the past day related to total processor time measurements
| summarize min(CounterValue), avg(CounterValue), max(CounterValue), percentiles(CounterValue, 90,99) by Computer // Presents the minimum, maximum, average, 90th and 99th percentile counter values for each computer
| where percentile_CounterValue_90 > 80 and percentile_CounterValue_99 > 80 // Filters previous query results for instances where the 90th and 99th percentile counters are higher than 50
| join kind=inner (Heartbeat // Introduces data from the "Heartbeat" table to the previous query results
| where TimeGenerated > ago(1d) // Time range for the data added from the "Heartbeat" table
| distinct Computer, OSType) on Computer // Adds distinct combinations of computer and operating system
| project-away Computer1 // Removes the "Computer1" column from the query results
The result set of this query lists all of the computers that reached their full CPU capacity and the operating system running on each computer, which will be helpful for further analysis.


