Exercise - Summarize free space statistics by computer
Here, you'll retrieve and transform data from the Perf table, using KQL queries, to analyze the free space of the machines logging data to your Log Analytics workspace.
1. Set goals
Recall that your IT team has noticed recurring issues related to insufficient free space on virtual machines.
To analyze free space usage of machines running in your IT environment, you need information about:
- Total free space available on each machine.
- Percentage of space used on each machine.
2. Assess logs
As we saw the previous exercise, the Perf table provides information about the performance of hardware components, operating systems, and applications.
We noted that the Perf table's ObjectName column lists the names of all of the objects being monitored and the CounterName column holds the names of the various performance counters that Azure Monitor collects. We also saw that both of these columns hold lots of values, many of which appear multiple times.
Let's run a query on the Perf table to list distinct ObjectName values:
Click to run query in Log Analytics demo environment
Perf // The table you’re querying
| distinct ObjectName // Lists distinct ObjectName values
The result set of this query includes all ObjectName values currently in the table:

In our scenario, we're interested in analyzing virtual machines, so the objects we want to look at are LogicalDisk and Logical Disk (to monitor the memory in a physical machine, you'd look at the memory object). The reason there are two similarly named objects is that LogicalDisk is the object name in Windows records while Logical Disk is used in Linux records.
To list the distinct names of the counters Azure Monitor collects for the LogicalDisk and Logical Disk objects, run:
Click to run query in Log Analytics demo environment
Perf // The table you’re querying
| where ObjectName == "LogicalDisk" or // The object name used in Windows records
ObjectName == "Logical Disk" // The object name used in Linux records
| distinct CounterName // Lists distinct CounterName values
The result set of this query includes all performance counters collected for the LogicalDisk and Logical Disk objects:

The performance counters that provide information about used and free space are % Used Space, % Free Space, and Free Megabytes. We have two similar counters - % Free Space and % Used Space - collected from Windows and Linux records, respectively.
Let's assess how we can use this data and which KQL operations can help extract and transform the data:
| Column | Description | Analysis goal | Related KQL operations |
|---|---|---|---|
TimeGenerated |
Indicates when the virtual machine generated each log. | Define the time scope of the analysis. | where TimeGenerated > ago(1d) For more information, see ago(), where operator, and Numerical operators. |
Computer |
Computer from which the event was collected. | Associate CPU usage with a specific computer. | summarize... by Computer For more information, see summarize operator. |
ObjectName |
Holds the names of all of objects for which the table holds performance data. For your analysis, you're interested in the LogicalDisk and Logical Disk objects. |
Monitor the logical disks in virtual machines. | where ObjectName == "LogicalDisk" or ObjectName == "Logical Disk"For more information, see where operator and == (equals) operator. |
CounterName |
Holds the names of all performance counters in the table. |
|
where CounterName == "Free Megabytes" or CounterName =="% Free Space" or CounterName == "% Used Space"To simplify the results and facilitate further analysis:
|
InstanceName |
Lists the monitored instances of the monitored object. | Monitor all drives on the virtual machine. | InstanceName == "_Total" For more information, see where operator and == (equals) operator. |
CounterValue |
The measurement collected for the counter. | Retrieve performance measurements for the % Used Space, % Free Space, and Free Megabytes performance counters. |
|
3. Write your query
Retrieve all logs generated in the past day that reported the
% Used Space,% Free Space, andFree Megabytesperformance counters for theLogicalDiskandLogical Diskobjects:Click to run query in Log Analytics demo environment
Perf
| where TimeGenerated > ago(1d)
| where ObjectName == "LogicalDisk" or // The object name used in Windows records
ObjectName == "Logical Disk" // The object name used in Linux records
| where CounterName == "Free Megabytes" or CounterName =="% Free Space" or CounterName == "% Used Space" // Filters for the performance counters Free Megabytes, % Free Space, and % Used Space performance counters
| where InstanceName == "_Total"  // Retrieves data related to free space for all drives on a virtual machine
The result set of this query likely includes multiple records for each machine from which you collect performance counters related to free space.

Filter for the last counter value collected for every counter reported by each virtual machine:
Click to run query in Log Analytics demo environment
Perf
| where TimeGenerated > ago(1d)
| where ObjectName == "LogicalDisk" or // The object name used in Windows records
ObjectName == "Logical Disk" // The object name used in Linux records
| where CounterName == "Free Megabytes" or CounterName =="% Free Space" or CounterName == "% Used Space" // Filters for the performance counters Free Megabytes, % Free Space, and % Used Space performance counters
| where InstanceName == "_Total"  // Retrieves data related to free space for all drives on a virtual disk
| summarize arg_max(TimeGenerated, CounterValue) by Computer, CounterName // Retrieves the last counter value collected for each counter for every virtual machine
You now have the last reported counter value for every free space-related counter of every machine.

To facilitate analysis:
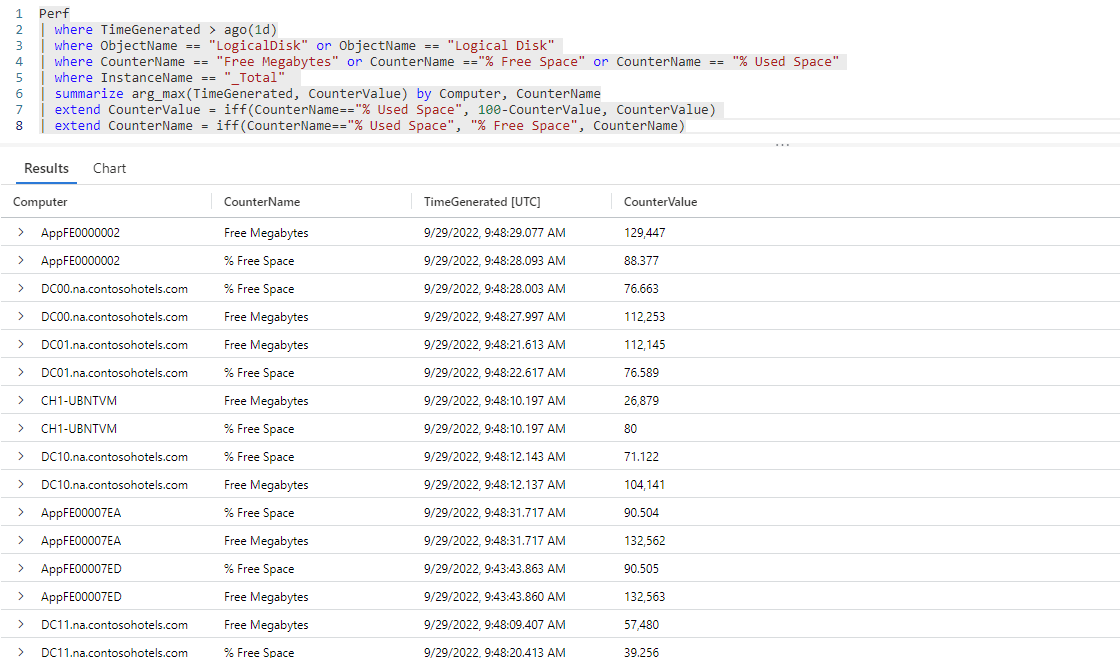
Convert the
% Used Spacecounter value to% Free Space(by subtracting the% Used Spacevalue from 100%) and change the name of the% Used Spacecolumn to% Free Space:Click to run query in Log Analytics demo environment
Perf
| where TimeGenerated > ago(1d)
| where ObjectName == "LogicalDisk" or // The object name used in Windows records
ObjectName == "Logical Disk" // The object name used in Linux records
| where CounterName == "Free Megabytes" or CounterName =="% Free Space" or CounterName == "% Used Space" // Filters for the performance counters Free Megabytes, % Free Space, and % Used Space performance counters
| where InstanceName == "_Total"  // Retrieves data related to free space for all drives on a virtual disk
| summarize arg_max(TimeGenerated, CounterValue) by Computer, CounterName // Retrieves the last counter value collected for each counter for every virtual machine
| extend CounterValue = iff(CounterName=="% Used Space", 100-CounterValue, CounterValue) // Converts % Used Space to % Free Space
| extend CounterName = iff(CounterName=="% Used Space", "% Free Space", CounterName) // Changes the column name from % Used Space to % Free Space
The result set of this query presents the percentage of free space on Windows and Linux machines in the same way, which makes further analysis clearer and easier.
Convert
Free Megabytesto Gigabytes (Free Megabytesvalue * 0.001 = Free Gigabytes) and relabelFree MegabytestoOverallFreeSpaceInGB:Click to run query in Log Analytics demo environment
Perf
| where TimeGenerated > ago(1d)
| where ObjectName == "LogicalDisk" or // The object name used in Windows records
ObjectName == "Logical Disk" // The object name used in Linux records
| where CounterName == "Free Megabytes" or CounterName =="% Free Space" or CounterName == "% Used Space" // Filters for the performance counters Free Megabytes, % Free Space, and % Used Space performance counters
| where InstanceName == "_Total"  // Retrieves data related to free space for all drives on a virtual disk
| summarize arg_max(TimeGenerated, CounterValue) by Computer, CounterName // Retrieves the last counter value collected for each counter for every virtual machine
| extend CounterValue = iff(CounterName=="% Used Space", 100-CounterValue, CounterValue) // Converts % Used Space to % Free Space
| extend CounterName = iff(CounterName=="% Used Space", "% Free Space", CounterName) // Changes the column name from % Used Space to % Free Space
| extend CounterValue = iff(CounterName=="Free Megabytes", (CounterValue)*0.001, CounterValue) // Converts megabytes to gigabytes
| extend CounterName= iff(CounterName=="Free Megabytes", "OverallFreeSpaceInGB", CounterName) // Changes the column name fromFree Megabytes to OverallFreeSpaceInGB
You can now get a clear picture of the total free space on each machine in gigabytes and as a percentage of the machine's total memory.


Challenge: Bundle together free space statistics for each computer
The result set of our query so far includes two lines for each computer - one line shows the overall free space in Gigabytes and the other shows the percentage of free space available.
Can you create a dictionary that bundles these two free space statistics together for each virtual machine?
Hint:
- Use the bag_pack() function to create key-value pairs for each of the two performance counters.
- Use the make_bag() aggregation function to bundle both key-value values for each computer.
Solution:
Group together
CounterName, CounterValuekey-value pairs:Click to run query in Log Analytics demo environment
Perf
| where TimeGenerated > ago(1d)
| where ObjectName == "LogicalDisk" or // The object name used in Windows records
ObjectName == "Logical Disk" // The object name used in Linux records
| where CounterName == "Free Megabytes" or CounterName =="% Free Space" or CounterName == "% Used Space" // Filters for the performance counters Free Megabytes, % Free Space, and % Used Space performance counters
| where InstanceName == "_Total"  // Retrieves data related to free space for all drives on a virtual disk
| summarize arg_max(TimeGenerated, CounterValue) by Computer, CounterName // Retrieves the last counter value collected for each counter for every virtual machine
| extend CounterValue = iff(CounterName=="% Used Space", 100-CounterValue, CounterValue) // Converts % Used Space to % Free Space
| extend CounterName = iff(CounterName=="% Used Space", "% Free Space", CounterName) // Changes the column name from % Used Space to % Free Space
| extend CounterValue = iff(CounterName=="Free Megabytes", (CounterValue)*0.001, CounterValue) // Converts megabytes to gigabytes
| extend CounterName= iff(CounterName=="Free Megabytes", "OverallFreeSpaceInGB", CounterName) // Changes the column name fromFree Megabytes to OverallFreeSpaceInGB
| extend packed = pack(CounterName, CounterValue) // Groups together CounterName-CounterValue key-value pairs
Grouping together
CounterName, CounterValuekey-value pairs lets you create a dictionary of free space statistics for each computer in the next step.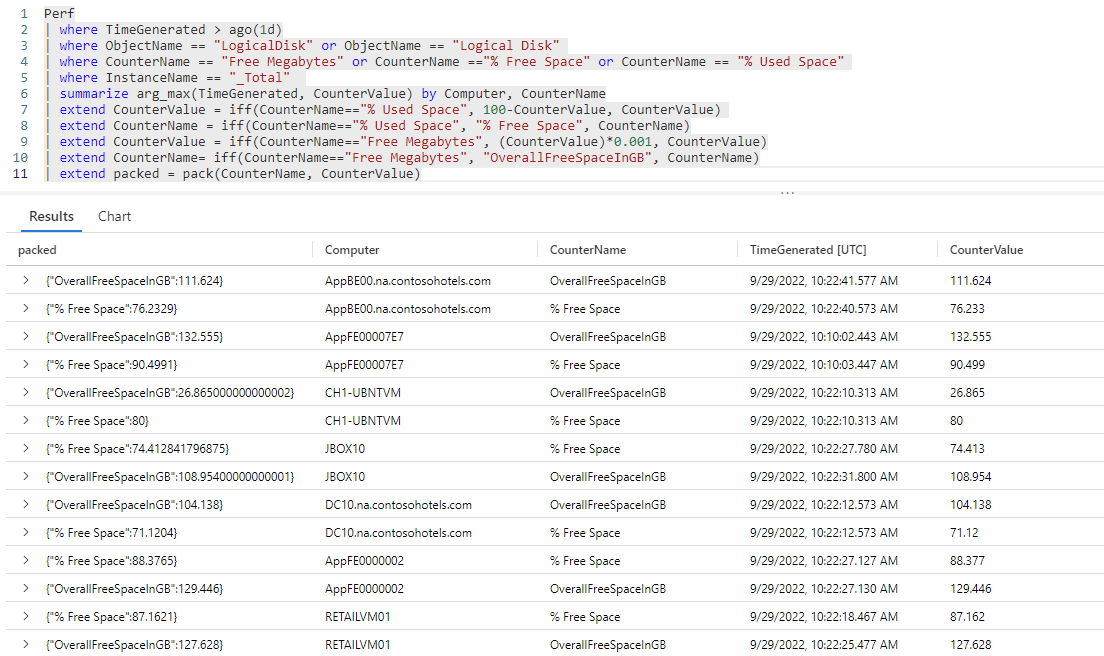
Create a property-bag (dictionary), called SpaceStats, of all free space statistics collected for each machine, summarize by computer, and filter for machines with less than 50% free space:
Click to run query in Log Analytics demo environment
Perf
| where TimeGenerated > ago(1d)
| where ObjectName == "LogicalDisk" or // The object name used in Windows records
ObjectName == "Logical Disk" // The object name used in Linux records
| where CounterName == "Free Megabytes" or CounterName =="% Free Space" or CounterName == "% Used Space" // Filters for the performance counters Free Megabytes, % Free Space, and % Used Space performance counters
| where InstanceName == "_Total"  // Retrieves data related to free space for all drives on a virtual disk
| summarize arg_max(TimeGenerated, CounterValue) by Computer, CounterName // Retrieves the last counter value collected for each counter for every virtual machine
| extend CounterValue = iff(CounterName=="% Used Space", 100-CounterValue, CounterValue) // Converts % Used Space to % Free Space
| extend CounterName = iff(CounterName=="% Used Space", "% Free Space", CounterName) // Changes the column name from % Used Space to % Free Space
| extend CounterValue = iff(CounterName=="Free Megabytes", (CounterValue)*0.001, CounterValue) // Converts megabytes to gigabytes
| extend CounterName= iff(CounterName=="Free Megabytes", "OverallFreeSpaceInGB", CounterName) // Changes the column name fromFree Megabytes to OverallFreeSpaceInGB
| extend packed = pack(CounterName, CounterValue) // Groups together CounterName-CounterValue key-value pairs
| summarize SpaceStats = make_bag(packed) by Computer // Summarizes free space statstics by computer
| where SpaceStats.["% Free Space"]<= 50
The result set of this query summarizes free space statistics by machine, which was the goal of your free space analysis!
The last line of the query filters for machines with less that 50% free space. You might want to monitor or analyze more closely, or reconfigure them to ensure they don't run out of space.


