Business rules
With the Power Automate Process Mining desktop app, you can define business rules that evaluate your key performance indicators (KPI). Business rules set thresholds that are associated with a category flag of Error (red), Warning (yellow), or OK (green) to help you quickly detect problems in your processes.
For example, you might have a business rule that evaluates the average case duration and then flags as error any cases over 10 days. The following image shows a Process map with a single business rule applied. The edges and nodes show the category that the business rule flags. Each red flag indicates an error, a yellow flag is a warning, and a green flag is OK.
The thresholds apply to all business rules in the process context. However, each business rule can have its own calculation formula and filters. Because business rules are part of the process context, they're available in any view that you create for that process.
Create business rules
To view, edit, create, duplicate, or delete business rules, select the Process context button.
The Business rules tab lists your existing business rules. You can create a new business rule by selecting the Create new Business rule button.
Set up business rule scope
When you create a business rule, you need to specify the scope of the rule. The scope determines to which output the result is derived. The following sections explain each option that you can choose from.
Event
Event scope provides results for each activity. The data element over which the formula is calculated is events. The default output is the number of events that fit into the business rule dataset.
The Statistics and Process map screens display calculation results. In the detail view for a business rule, the results display for each activity. The system categorizes each activity according to the defined severities. In the process map, the results display for each activity, similar to how it displays in the detailed view for a single business rule on the Statistics screen.
Case
Case scope provides a single result for each business rule dataset. The data element over which the formula is calculated is cases. The default output is the number of cases that fit into the business rule dataset.
The Statistics and Process map screens display calculation results. The process map highlights all activities and edges that belong to any of the cases in the business rule.
Process
Process scope is the most generic. It provides a single result for each business rule dataset.
For a process scope, you can define the custom result formula with an explicit calculation context to determine over which data elements the formula is calculated by using events, edges, or cases. The default business rule result is the count of elements.
The calculation result isn't relevant to activities and edges. It displays on the Statistics screen only.
Edge
Edge scope is the same as event scope, except that results are provided for each edge. The Statistics and Process map screens display calculation results.
Set up the rule options
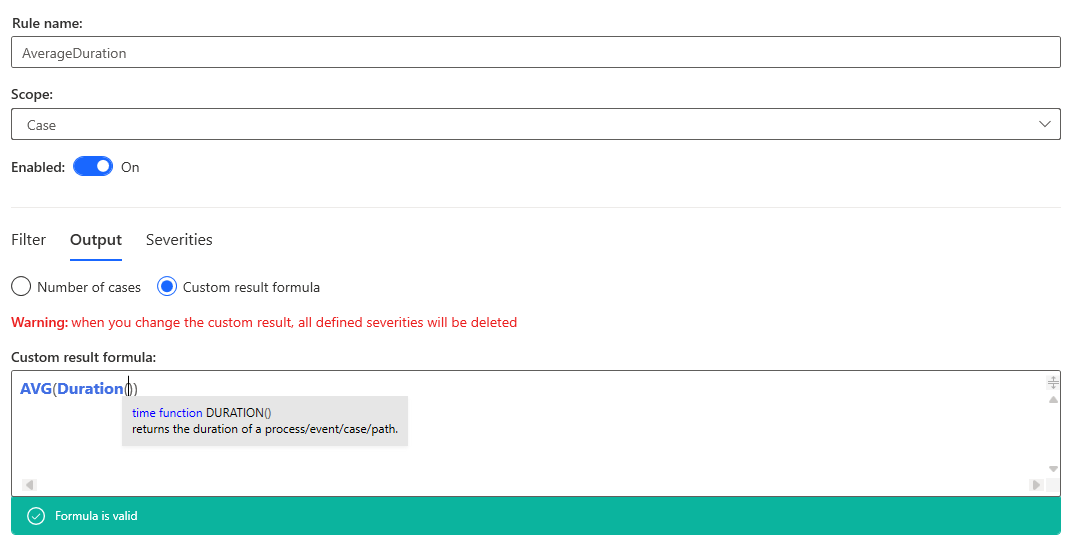
The following example shows how to create a business rule that shows the case average durations. The rule is named AverageDuration and has a Scope set to Case.
The new Business rule dialog has three tabs that you can configure: Filter, Output, and Severities.
Filter
Filters that you define in the business rule apply on top of any filters that you apply to the process view. If no filters are defined in the business rule, the business rule dataset is the same as the process view dataset.
Indicators in the lower part of the Business rule panel show how much of the view dataset that the business rule covers. Hover your cursor over an indicator to view the number of cases or events that are covered out of the total number of cases or events.
Output
All business rule scopes, other than the process scope, have one default output. It's the count of cases, events, or edges that are in the business rule dataset. You can also define a custom result formula output by using custom metrics.
Severities
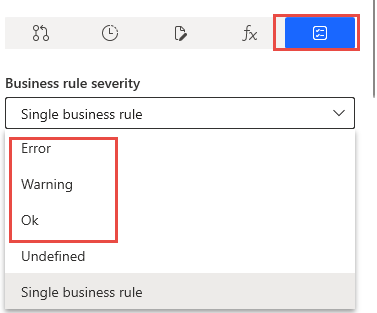
You can define severities, or thresholds and limits, to score the results of the business rule outputs and assign a category flag. Three categories are available: Error, Warning, and OK.
Thresholds and limits can include constant values and custom expressions that are dynamically calculated. For example, you might assign an Error flag when the duration of a case is longer than the average case duration.
You must define severities before you can save the business rule. The simplest definition of a severity category is the expression Any.
If the business rule doesn't have a custom output defined, the system applies severities over the default output: Count.
This example doesn't include a filter. From the Output tab, select the Custom result formula option, and then provide a formula for average duration: AVG(Duration()).
On the Severities tab, add three severity types of Error, Warning, and OK. Then, set the severity expressions as follows:
Error - Duration more than 60 days
Warning - Duration between 40 and 60 days
OK - Duration less than 40 days
After creating the business rule, you can turn on, turn off, delete, or create a duplicate.
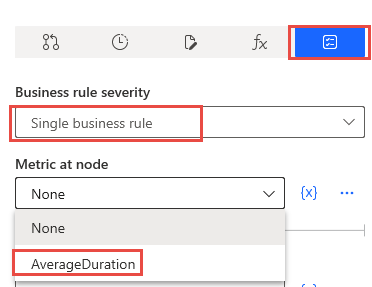
Any business rules that are turned on are available for use in the process map under the Business rules tab of the Customize pane. You can use it as a business rule severity or as a metric.
The following image shows what the process map looks like when you use the average duration business rule as a metric.
The following image shows what the process map looks like when you use the Social chart.
Using a business rule is a powerful way to help you visualize the performance of your KPIs when looking at the process map or statistics.


