Process compare
The Process compare module helps you perform an intuitive and efficient comparison of processes. You can compare the processes at the level of the process map, where the generated visualization helps you identify the differences in the flow and frequency or time metrics.
The compare module uses views to perform the compare. You can compare up to three different views and review the differences and common steps. For example, you could compare the default view, which includes all your cases where the process map would reflect the combination of the process paths that all cases use, with one specific variant. In this example, you would first prepare a view for the variant that you want to compare with by going to Variants, selecting the variant, and then creating a filter. Next, you would save that view as an extra view for the process. Then, you would use the default and new saved view to compare and review the differences between the two processes.
For example, consider a scenario where you want to compare cases with rework versus cases without rework. Your first step is to create a view of cases without reworks. To do so, you would create a filter.
Then, you can save the view as CasesWithoutReworks.
Return to the view that includes all cases. Select Process compare from the left navigation and then add the view that you created as a layer. You can choose a total of three extra views to add as layers in the comparison. Additionally, you can add layers from a Business Process Model and Notation (BPMN) file.
After you add the layers, the visual shows common activities as green, activities that are specific to the current view as blue, and one activity that's specific to the view that you're comparing to as red.
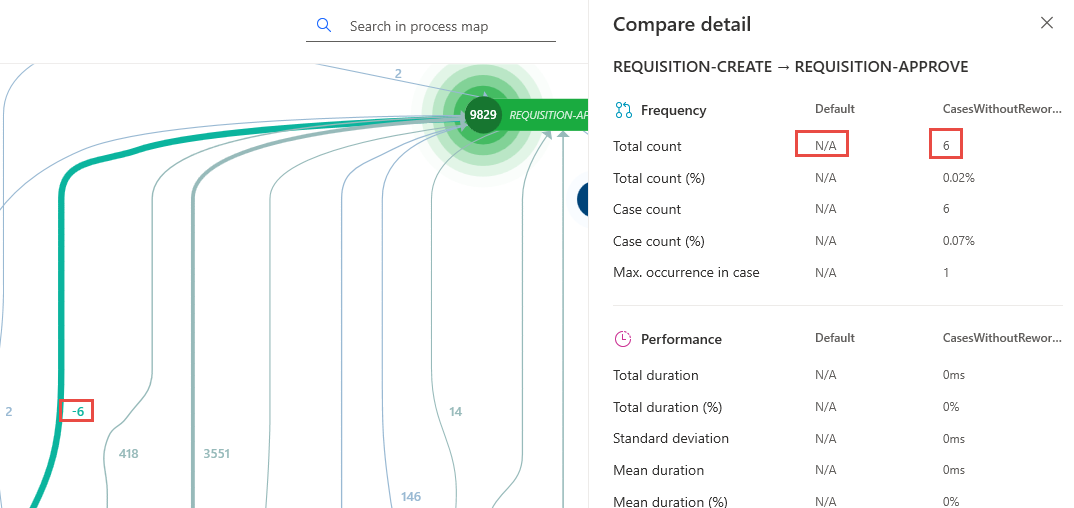
Select a node to view details of that activity, including its frequency on both layers.
The visual uses a red color to indicate paths that are specific to cases without rework. You can select the path to view frequency of the cases without reworks.
You can still use filters and all process map tools in the Customize pane.
Use other views
You can add up to three compare views to your process, but you can only select one compare layer at a time. The Compare box shows a list of all available layers. You can turn on and off the individual layers by selecting or clearing them. The currently open view and the Compare layer are on by default. You can select the minus (-) sign to remove the layer from the list.
Because you perform the compare by using different views, you can use the module to compare different types of scenarios by creating views that represent the different processes that you want to compare. You could do the comparison for compliance purposes or to identify why one process performs better than another by identifying the differences. For example, you can compare across processes, across countries/regions or business units, or time periods based on the filters that you use on the views.


