Exercise - Scale the performance of your workload
In this exercise, you'll take the problem you encountered in the first exercise and improve performance by scaling more CPUs for Azure SQL Database. You'll use the database you deployed in the previous exercise.
You can find all the scripts for this exercise in the 04-Performance\monitor_and_scale folder in the GitHub repository you cloned or the zip file you downloaded.
Scale up Azure SQL performance
To scale performance for a problem that appears to be a CPU capacity problem, you should decide what your options are and then proceed to scale CPUs by using provided interfaces for Azure SQL.
Decide how to scale performance. Because the workload is CPU bound, one way to improve performance is to increase CPU capacity or speed. A SQL Server user would have to move to a different machine or reconfigure a VM to get more CPU capacity. In some cases, even a SQL Server administrator might not have permission to make these scaling changes. The process might take time and even require a database migration.
For Azure, you can use
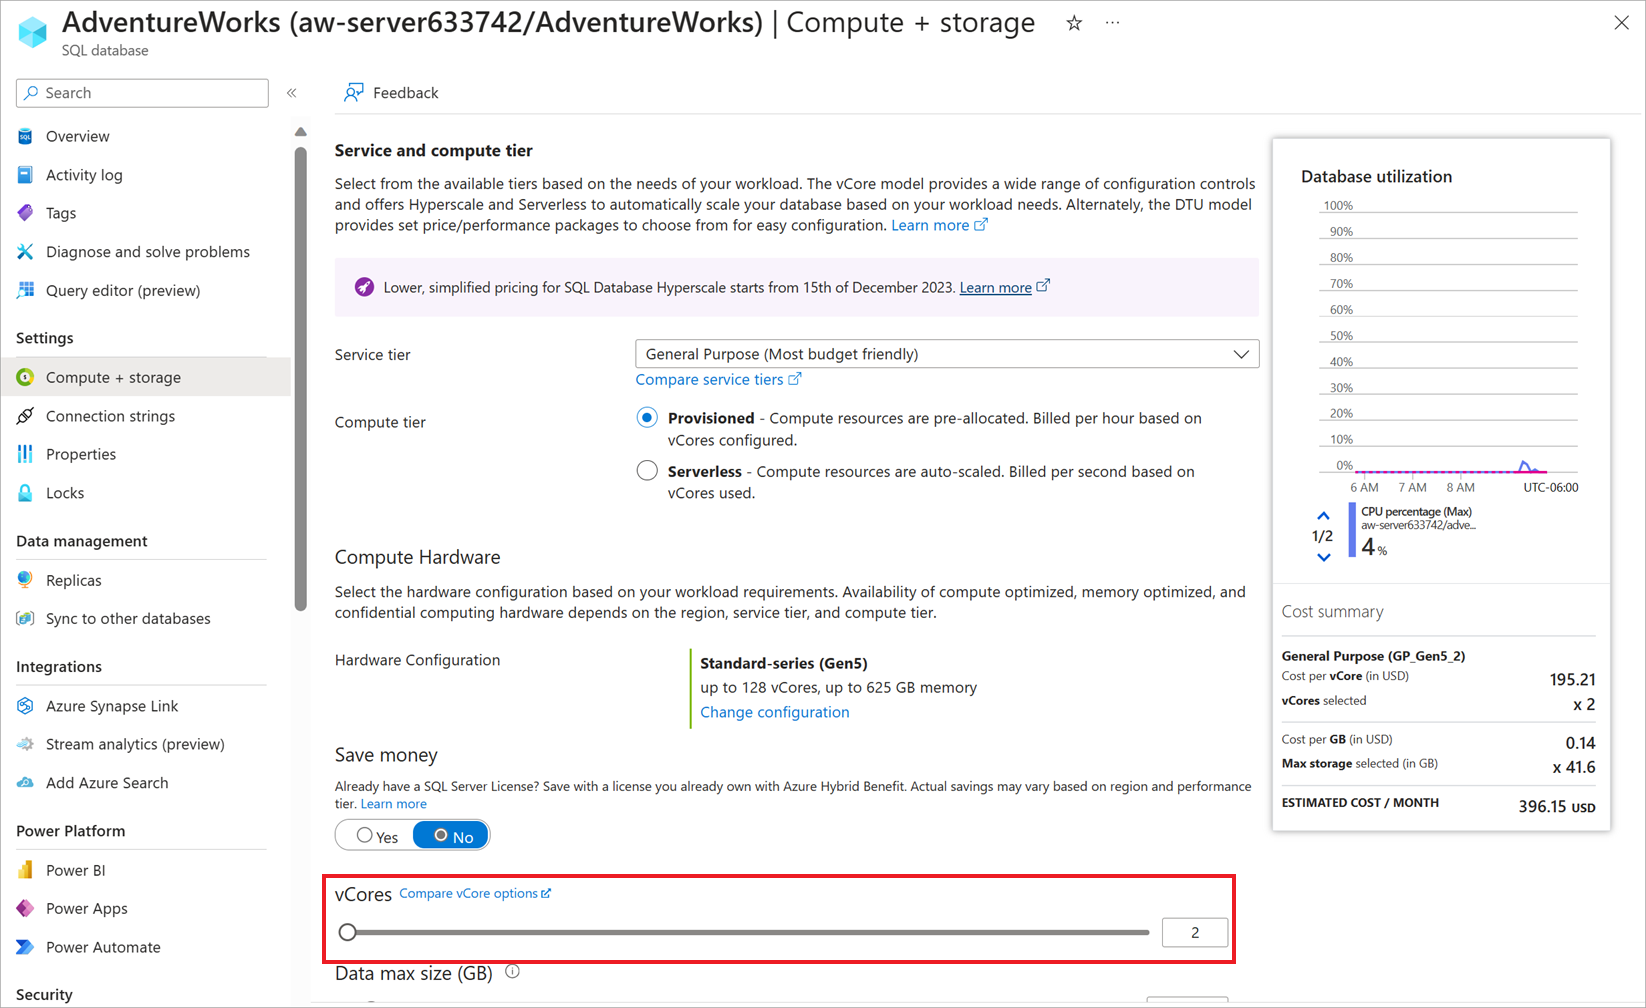
ALTER DATABASE, the Azure CLI, or the Azure portal to increase CPU capacity with no database migration on the part of the user.Using the Azure portal, you can see options for how you can scale for more CPU resources. From your database's Overview pane, select the Pricing tier for the current deployment. The Pricing tier allows you to change the service tier and the number of vCores.
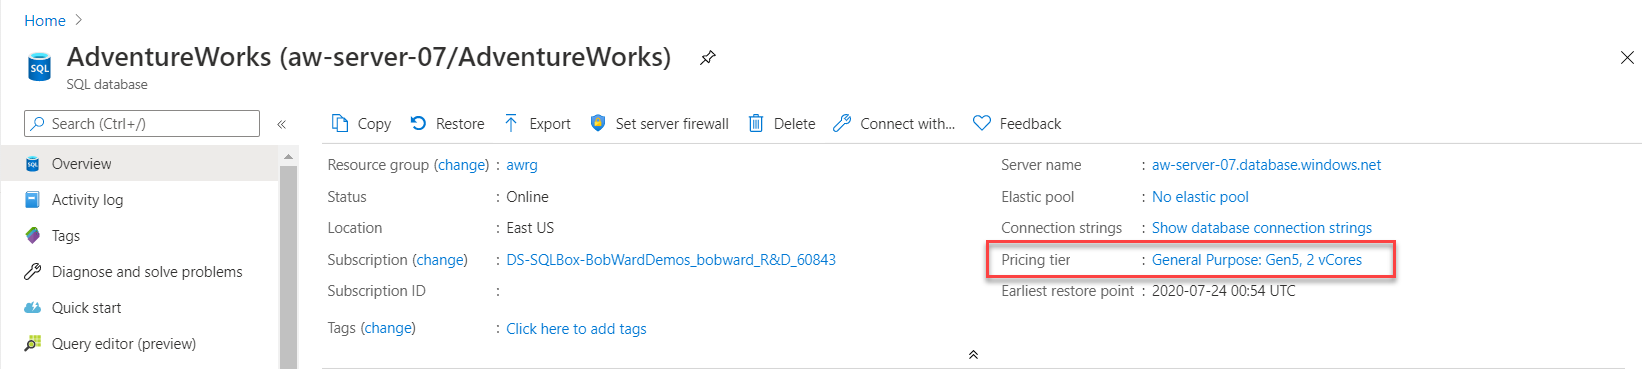
Here you can see options for changing or scaling compute resources. For General Purpose, you can easily scale up to something like 8 vCores.
You can also use a different method to scale your workload.
For this exercise, so that you can see proper differences in reports, you must first flush the Query Store. In SQL Server Management Studio (SSMS), select the AdventureWorks database and use the File > Open > File menu. Open the flushhquerystore.sql script in SSMS in the context of the AdventureWorks database. Your query editor window should look like the following text:
EXEC sp_query_store_flush_db;Select Execute to run this T-SQL batch.
Note
Running the preceding query flushes the in-memory portion of the Query Store data to disk.
Open the script get_service_objective.sql in SSMS. Your query editor window should look like the following text:
SELECT database_name,slo_name,cpu_limit,max_db_memory, max_db_max_size_in_mb, primary_max_log_rate,primary_group_max_io, volume_local_iops,volume_pfs_iops
FROM sys.dm_user_db_resource_governance;
GO
SELECT DATABASEPROPERTYEX('AdventureWorks', 'ServiceObjective');
GO
This is a method to find out your service tier by using T-SQL. The pricing or service tier is also known as a service objective. Select Execute to run the T-SQL batches.
For the current Azure SQL Database deployment, your results should look like the following image:
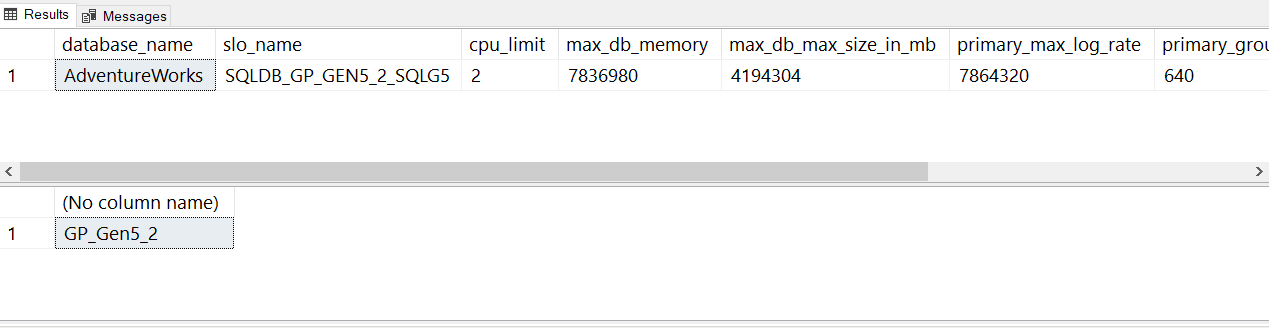
Notice the term slo_name is also used for service objective. slo stands for service level objective.
The various
slo_namevalues aren't documented, but you can see from the string value that this database uses a general purpose service tier with two vCores:Note
SQLDB_OP_...is the string used for Business Critical.When you view the ALTER DATABASE documentation, notice the ability to select your target SQL Server deployment to get the right syntax options. Select SQL Database single database/elastic pool to see the options for Azure SQL Database. To match the compute scale you found in the portal, you need the service objective
'GP_Gen5_8'.Modify the service objective for the database to scale more CPUs. Open the modify_service_objective.sql script in SSMS and run the T-SQL batch. Your query editor window should look like the following text:
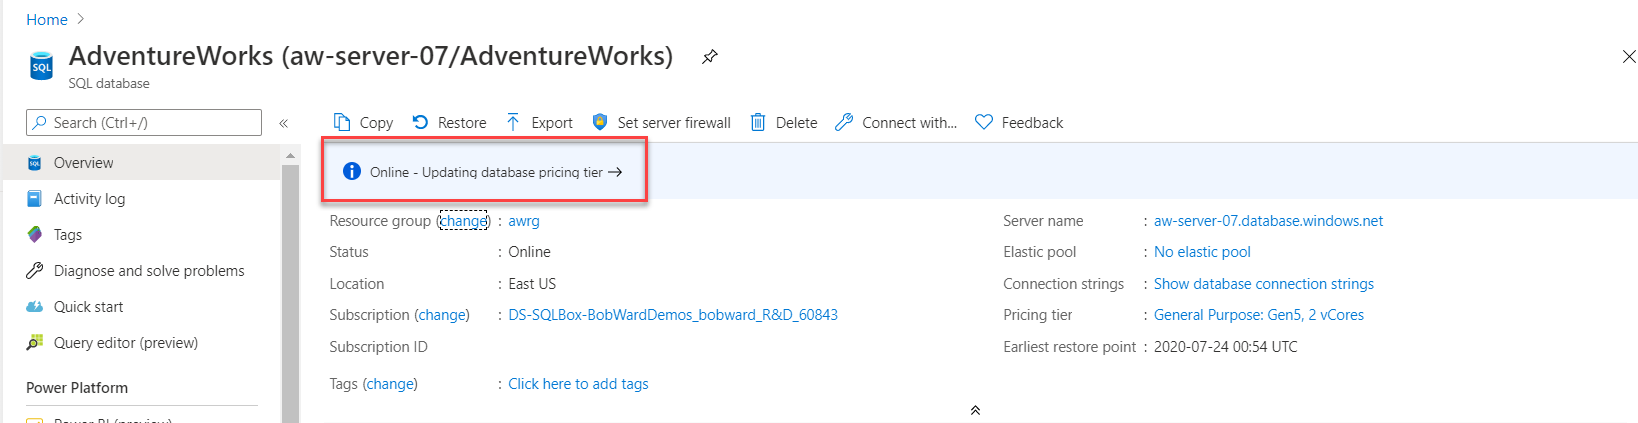
ALTER DATABASE AdventureWorks MODIFY (SERVICE_OBJECTIVE = 'GP_Gen5_8');This statement comes back immediately, but the scaling of the compute resources takes place in the background. A scale this small should take less than a minute, and for a short period of time the database is offline to make the change effective. You can monitor the progress of this scaling activity by using the Azure portal.
In Object Explorer, under the System Databases folder, right-click the master database and select New Query. Run this query in the SSMS query editor window:
SELECT * FROM sys.dm_operation_status;This is another way to monitor the progress of a change for the service objective for Azure SQL Database. This dynamic management view (DMV) exposes a history of changes to the database with ALTER DATABASE to the service objective. It shows the active progress of the change.
Here's an example of the output of this DMV in a table format, after you run the preceding ALTER DATABASE statement:
Item Value session_activity_id 97F9474C-0334-4FC5-BFD5-337CDD1F9A21 resource_type 0 resource_type_desc Database major_resource_id AdventureWorks minor_resource_id operation ALTER DATABASE state 1 state_desc IN_PROGRESS percent_complete 0 error_code 0 error_desc error_severity 0 error_state 0 start_time [date time] last_modify_time [date time] During a change for the service objective, queries are allowed against the database until the final change is implemented. An application can't connect for a very brief period of time. For Azure SQL Managed Instance, a change of tier allows queries and connections, but prevents all database operations, like the creation of new databases. In these cases, you receive the following error message: "The operation could not be completed because a service tier change is in progress for managed instance '[server]'. Please wait for the operation in progress to complete and try again."
When this is done, use the preceding queries listed from get_service_objective.sql in SSMS to verify that the new service objective or service tier of 8 vCores has taken effect.
Run the workload after scale up
Now that the database has more CPU capacity, let's run the workload we did in the previous exercise to observe whether there is a performance improvement.
Now that the scaling has completed, check if the workload duration is faster and whether waits on CPU resources has decreased. Run the workload again by using the sqlworkload.cmd command that you ran in the previous exercise.
Using SSMS, run the same query from the first exercise of this module to observe results from the script dmdbresourcestats.sql:
SELECT * FROM sys.dm_db_resource_stats;You should see that the average CPU resource usage has decreased from the almost 100 percent usage in the previous exercise. Normally,
sys.dm_db_resource_statsdisplays one hour of activity. Resizing the database causessys.dm_db_resource_statsto reset.Using SSMS, run the same query from the first exercise of this module to observe results from the script dmexecrequests.sql.
SELECT er.session_id, er.status, er.command, er.wait_type, er.last_wait_type, er.wait_resource, er.wait_time
FROM sys.dm_exec_requests er
INNER JOIN sys.dm_exec_sessions es
ON er.session_id = es.session_id
AND es.is_user_process = 1;
You will see that there are more queries with a status of RUNNING. This means our workers have more CPU capacity to execute.
Observe the new workload duration. The workload duration from sqlworkload.cmd should now be much less, and should be approximately 25-30 seconds.
Observe Query Store reports
Let's look at the same Query Store reports as we did in the previous exercise.
Using the same techniques as the first exercise in this module, look at the Top Resource Consuming Queries report from SSMS:
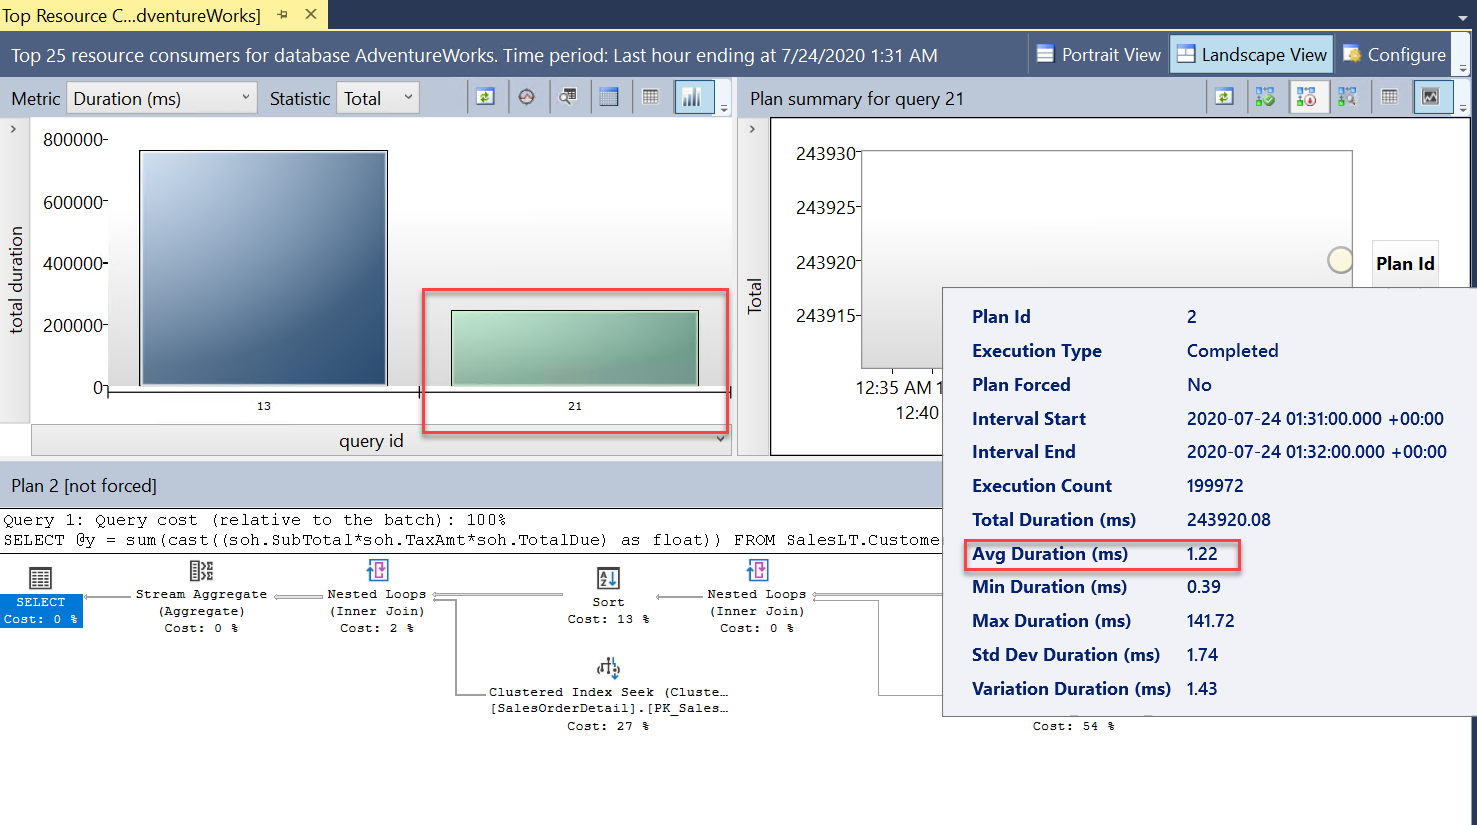
You will now see two queries (
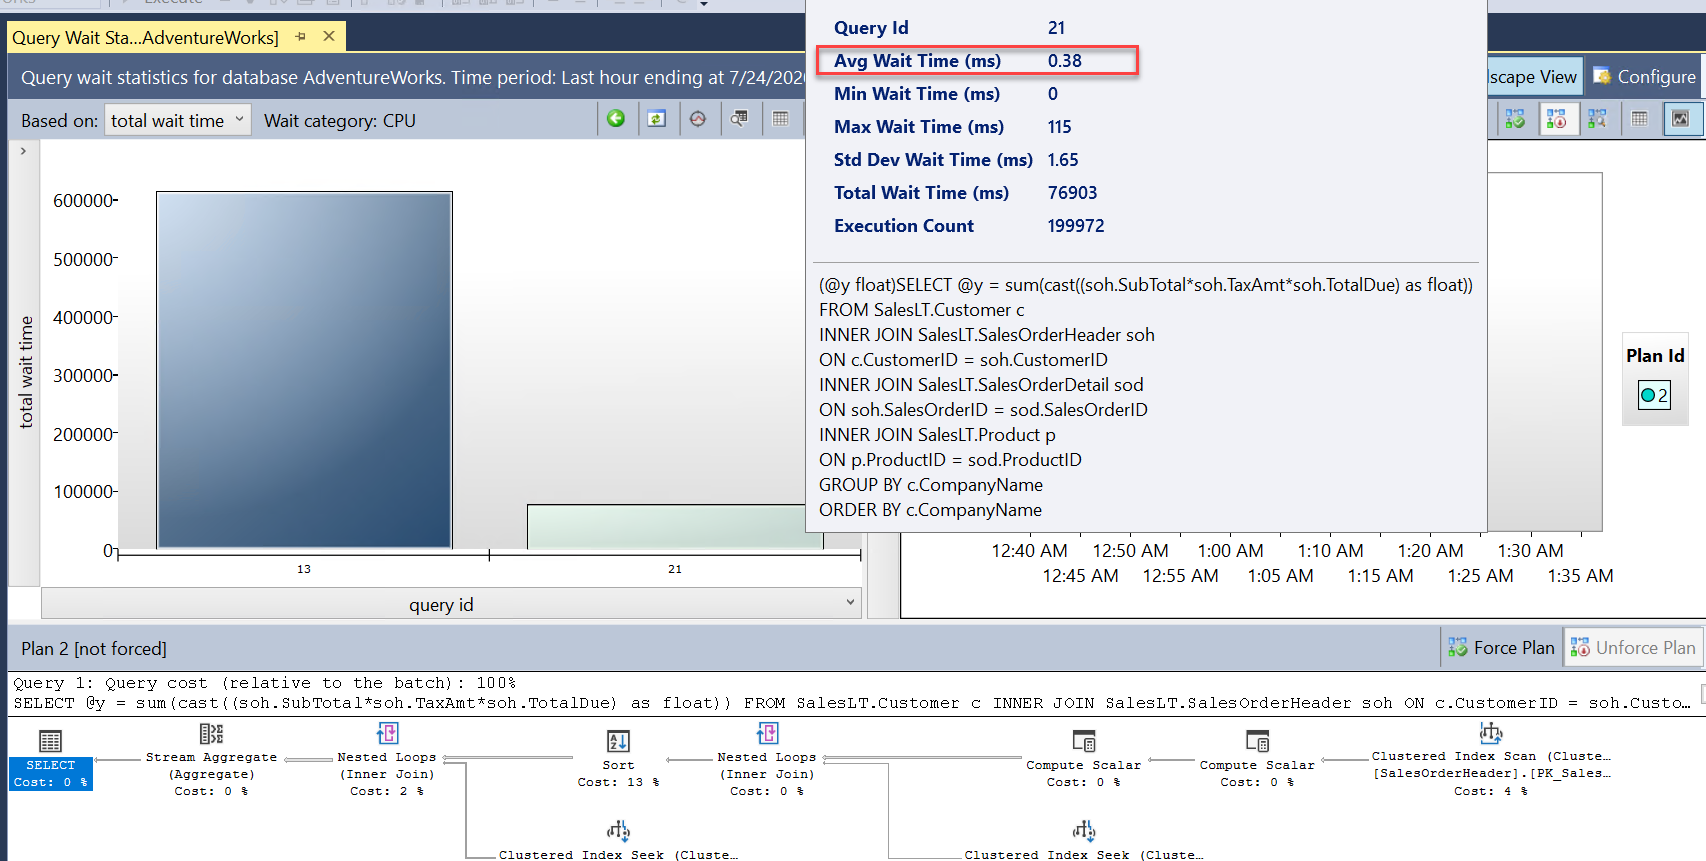
query_id). These are the same query, but show up as differentquery_idvalues in the Query Store, because the scale operation required a restart and the query had to be recompiled. You can see in the report the overall and average duration was significantly less.Look also at the Query Wait Statistics report and select the CPU wait bar. You can see the overall average wait time for the query is less, and it's a lower percentage of the overall duration. This is a good indication that the CPU isn't as much of a resource bottleneck when the database had a lower number of vCores:
You can close out all reports and query editor windows. Leave SSMS connected, because you'll need it in the next exercise.
Observe changes from Azure Metrics
Go to the AdventureWorks database in the Azure portal, and look at the Monitoring tab on the Overview pane again for Compute Utilization:
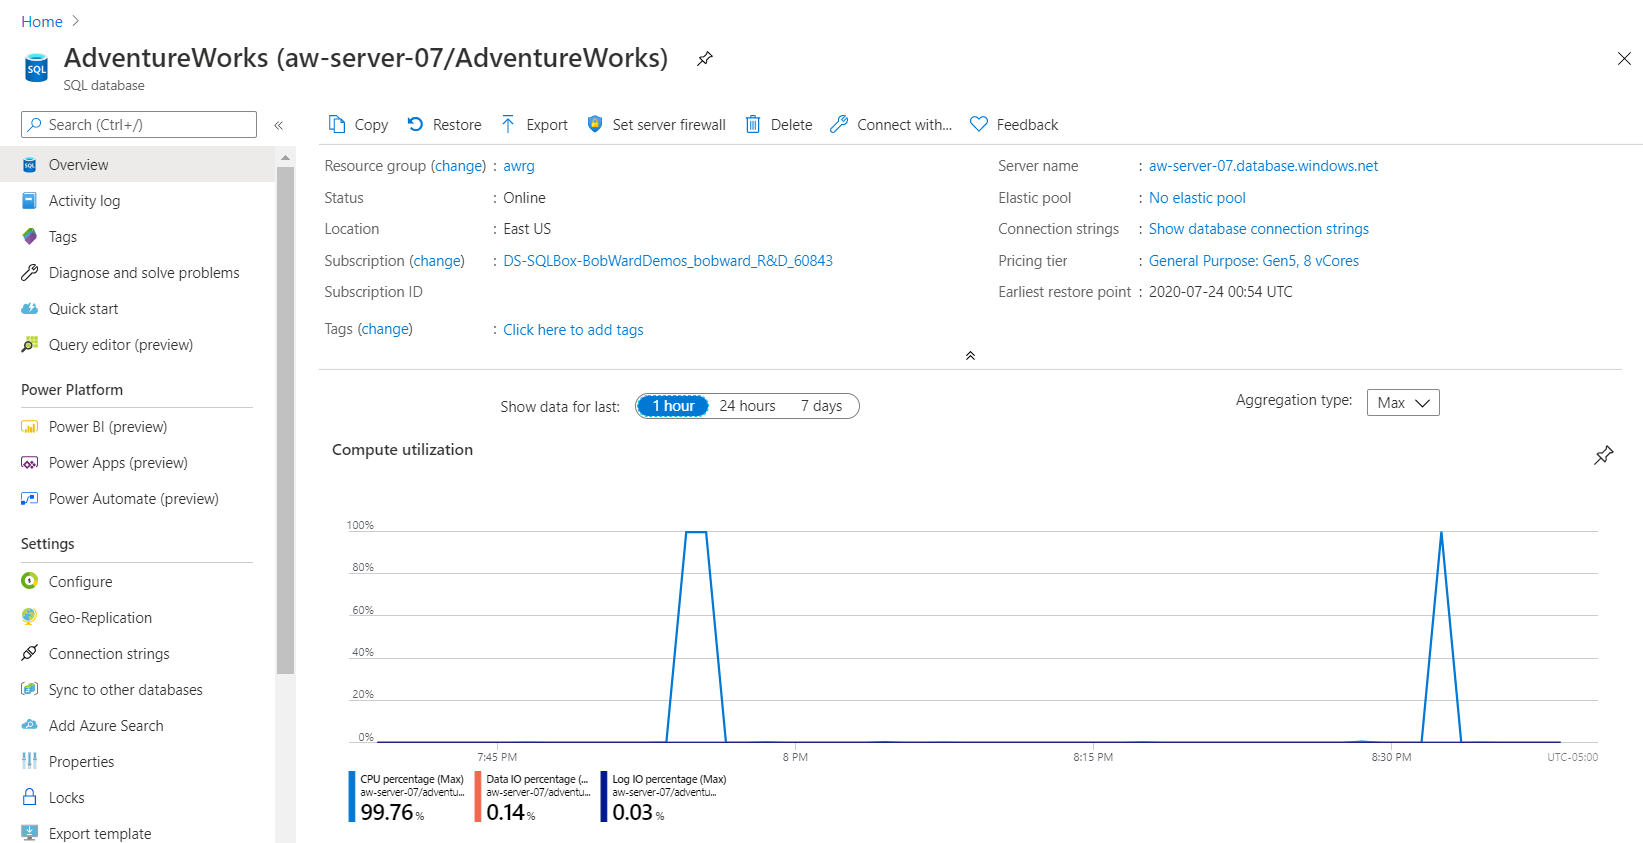
Notice that the duration is shorter for high CPU utilization, which means an overall drop in the CPU resources required to run the workload.
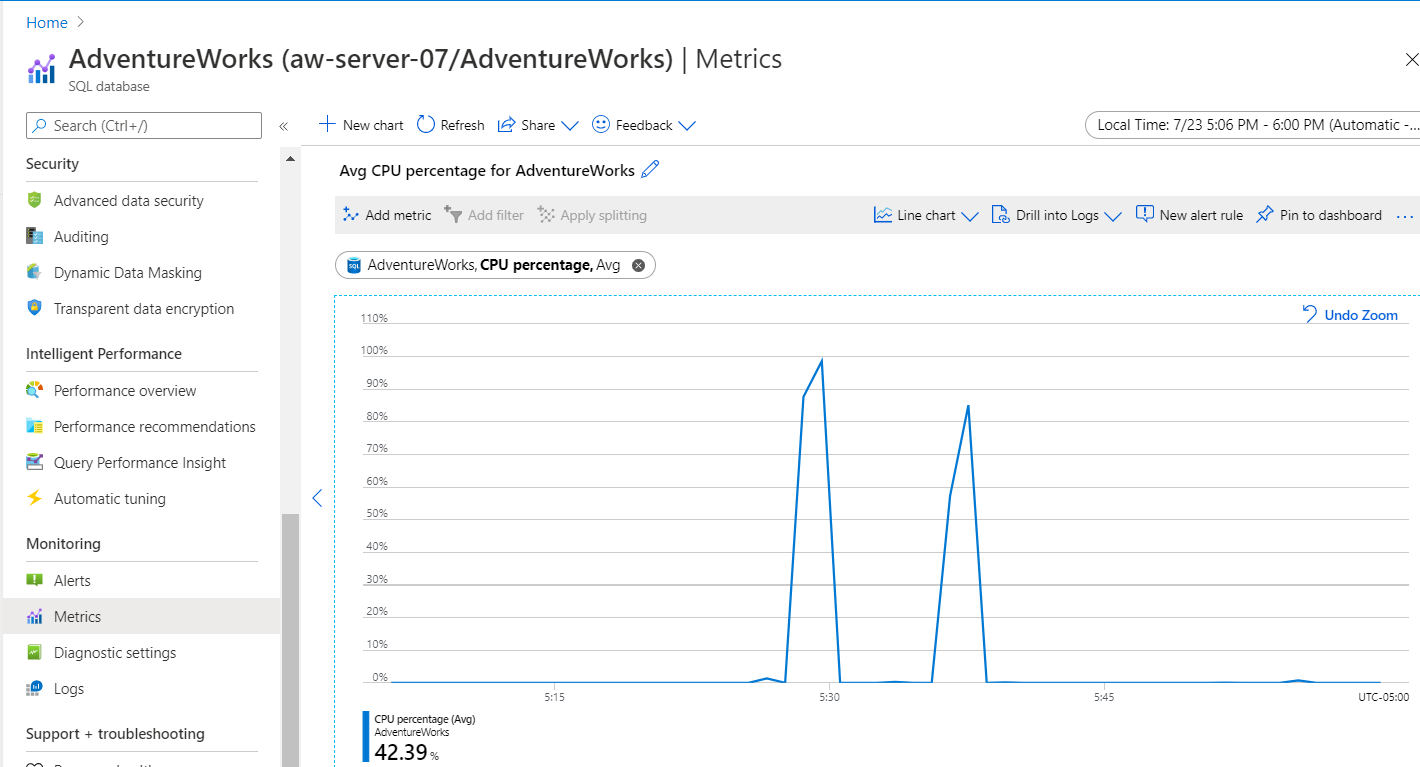
This chart can be somewhat misleading. From the Monitoring menu, use Metrics, then set the Metric to CPU limit. The CPU comparison chart looks more like the following:
Tip
If you continue to increase vCores for this database, you can improve performance up to a threshold where all queries have plenty of CPU resources. This doesn't mean you must match the number of vCores to the number of concurrent users from your workload. In addition, you can change the Pricing Tier to use Serverless Compute Tier, instead of Provisioned. This helps you achieve a more auto-scaled approach to a workload. For example, if you chose a minimum vCore value of 2 for this workload and maximum vCore value of 8, this workload would immediately scale to 8 vCores.
In the next exercise, you'll observe a performance problem and resolve it by applying best practices for application performance.