Understand Application Insights
Application Insights is an extension of Azure Monitor and provides Application Performance Monitoring (also known as APM) features. APM tools are useful for monitoring applications from development, through test, and into production in the following ways:
- Proactively understand how an application is performing.
- Reactively review application execution data to determine the cause of an incident.
In addition to collecting metrics and application telemetry data, which describe application activities and health, Application Insights can also be used to collect and store application trace logging data.
The log trace is associated with other telemetry to give a detailed view of the activity. Adding trace logging to existing apps only requires providing a destination for the logs; the logging framework rarely needs to be changed.
What Application Insights monitors
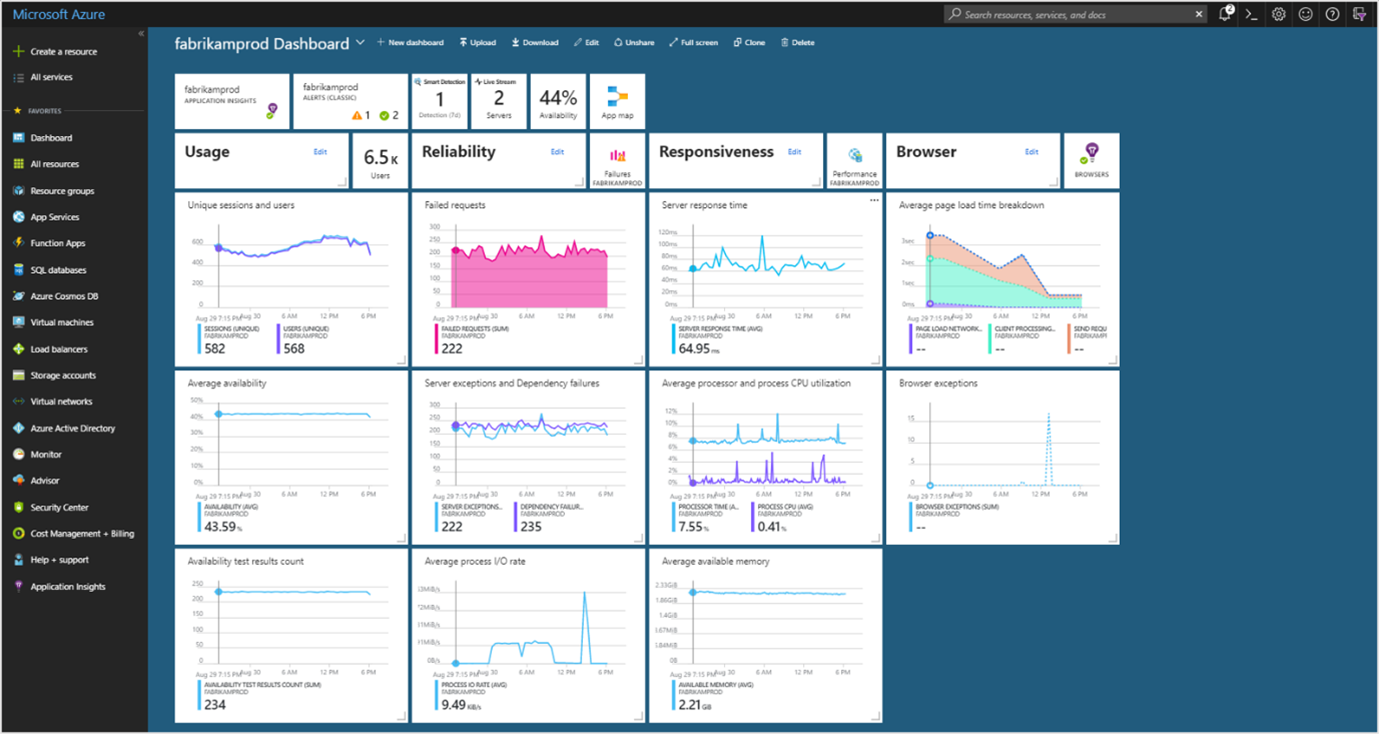
Application Insights collects metrics and application telemetry data, which describe application activities and health, as well as trace logging data.
- Request rates, response times, and failure rates – Identify which pages are most popular, at what times of day, and where your users are. See which pages perform best. If your response times and failure rates go high when there are more requests, then you may have a resourcing problem.
- Dependency rates, response times, and failure rates – Determine whether external services are slowing you down.
- Exceptions – Analyze the aggregated statistics, or pick specific instances and drill into the stack trace and related requests. Both server and browser exceptions are reported.
- Page views and load performance – reported by your users' browsers.
- AJAX calls from web pages – rates, response times, and failure rates.
- User and session counts.
- Performance counters from your Windows or Linux server machines, such as CPU, memory, and network usage.
- Host diagnostics from Docker or Azure.
- Diagnostic trace logs from your app – so that you can correlate trace events with requests.
- Custom events and metrics that you write yourself in the client or server code, to track business events such as items sold, or games won.
There are several ways to get started monitoring and analyzing app performance:
- At run time – instrument your web app on the server. Ideal for applications already deployed. Avoids any update to the code.
- At development time – add Application Insights to your code. Allows you to customize telemetry collection and send more telemetry.
- Instrument your web pages for page view, AJAX, and other client-side telemetry.
- Analyze mobile app usage by integrating with Visual Studio App Center.
- Availability tests - ping your website regularly from our servers.
Metric types
Application Insights log-based metrics let you analyze the health of your monitored apps, create powerful dashboards, and configure alerts. There are two kinds of metrics:
- Log-based metrics behind the scene are translated into Kusto queries from stored events.
- Standard metrics are stored as pre-aggregated time series.
Since standard metrics are pre-aggregated during collection, they have better performance at query time. Standard metrics are a better choice for dashboarding and in real-time alerting. The log-based metrics have more dimensions, which makes them the superior option for data analysis and ad-hoc diagnostics. Use the namespace selector to switch between log-based and standard metrics in metrics explorer.
Log-based metrics
Developers can use the SDK to send events manually (by writing code that explicitly invokes the SDK) or they can rely on the automatic collection of events from auto-instrumentation. In either case, the Application Insights backend stores all collected events as logs, and the Application Insights blades in the Azure portal act as an analytical and diagnostic tool for visualizing event-based data from logs.
Using logs to retain a complete set of events can bring great analytical and diagnostic value. For example, you can get an exact count of requests to a particular URL with the number of distinct users who made these calls. Or you can get detailed diagnostic traces, including exceptions and dependency calls for any user session. Having this type of information can significantly improve visibility into the application health and usage, allowing to cut down the time necessary to diagnose issues with an app.
At the same time, collecting a complete set of events may be impractical (or even impossible) for applications that generate a large volume of telemetry. For situations when the volume of events is too high, Application Insights implements several telemetry volume reduction techniques, such as sampling and filtering that reduces the number of collected and stored events. Unfortunately, lowering the number of stored events also lowers the accuracy of the metrics that, behind the scenes, must perform query-time aggregations of the events stored in logs.
Pre-aggregated metrics
Pre-aggregated metrics aren't stored as individual events with lots of properties. Instead, they're stored as pre-aggregated time series, and only with key dimensions. This makes the new metrics superior at query time: retrieving data happens faster and requires less compute power. This enables new scenarios such as near real-time alerting on dimensions of metrics, more responsive dashboards, and more.
The current SDKs (Application Insights 2.7 SDK or later for .NET) pre-aggregate metrics during collection. This applies to standard metrics sent by default, so the accuracy isn't affected by sampling or filtering. It also applies to custom metrics sent using GetMetric resulting in less data ingestion and lower cost.
For the SDKs that don't implement pre-aggregation the Application Insights backend still populates the new metrics by aggregating the events received by the Application Insights event collection endpoint. While you will not benefit from the reduced volume of data transmitted over the wire, you can still use the pre-aggregated metrics and experience better performance and support of the near real-time dimensional alerting with SDKs that don't pre-aggregate metrics during collection.
It's worth mentioning that the collection endpoint pre-aggregates events before ingestion sampling, which means that ingestion sampling will never impact the accuracy of pre-aggregated metrics, regardless of the SDK version you use with your application.
