Azure SQL Insights
SQL Insights allows you to analyze your queries, and tune performance of any product in the Azure SQL family. SQL Insights allows you to customize telemetry collection and frequency. SQL Insights also allows you to combine data from multiple sources into a single monitoring experience.
SQL Insights performs all monitoring remotely. Monitoring agents are hosted on dedicated virtual machines that connect to your SQL resources to remotely gather data. SQL Insights remote data collection leverages Azure SQL dynamic management views. Data gathered by SQL Insights is stored in Azure Monitor Logs to enable easy aggregation, filtering, and trend analysis. You can view the collected data from the SQL Insights workbook template, or you can delve directly into the data by using log queries.
SQL Insights is built on top of the Azure Monitor platform, which provides native alerting and out-of-the-box visualizations. This also allows you to retain a set of metrics over time so you can investigate performance issues that you may have encountered in the past.
SQL Insights allows you to configure which telemetry data to collect, the frequency of collection, and how long you want to store that data. Database activity and the settings that you've set in your monitoring profiles determine the amount of data being collected, which impacts the cost of the service.
Azure SQL Insights and Azure SQL Analytics
Both Azure SQL Insights, Azure SQL Analytics, and Azure diagnostic telemetry provide information on how your Azure SQL databases function.
- Azure SQL Insights is a project inside Azure Monitor that can provide advanced insights into Azure SQL database activity. It's deployed via a customer-managed VM using Telegraf as a collection agent that connects to SQL sources, collects data, and moves data into Log Analytics.
- Azure SQL Analytics also requires Log Analytics to provide advanced insights into Azure SQL database activity.
- Azure diagnostic telemetry is a separate, streaming source of data for Azure SQL Database and Azure SQL Managed Instance. Separate from Azure SQL Insights, SQLInsights is a log inside Intelligent Insights, and is one of several packages of telemetry emitted by Azure diagnostic settings. Diagnostic settings are a feature that contains Resource Log categories (formerly known as Diagnostic Logs).
Azure SQL Analytics consumes the resource logs coming from the diagnostic telemetry (configurable under Diagnostic Settings in the Azure portal), while Azure SQL Insights uses a different pipeline to collect Azure SQL telemetry.
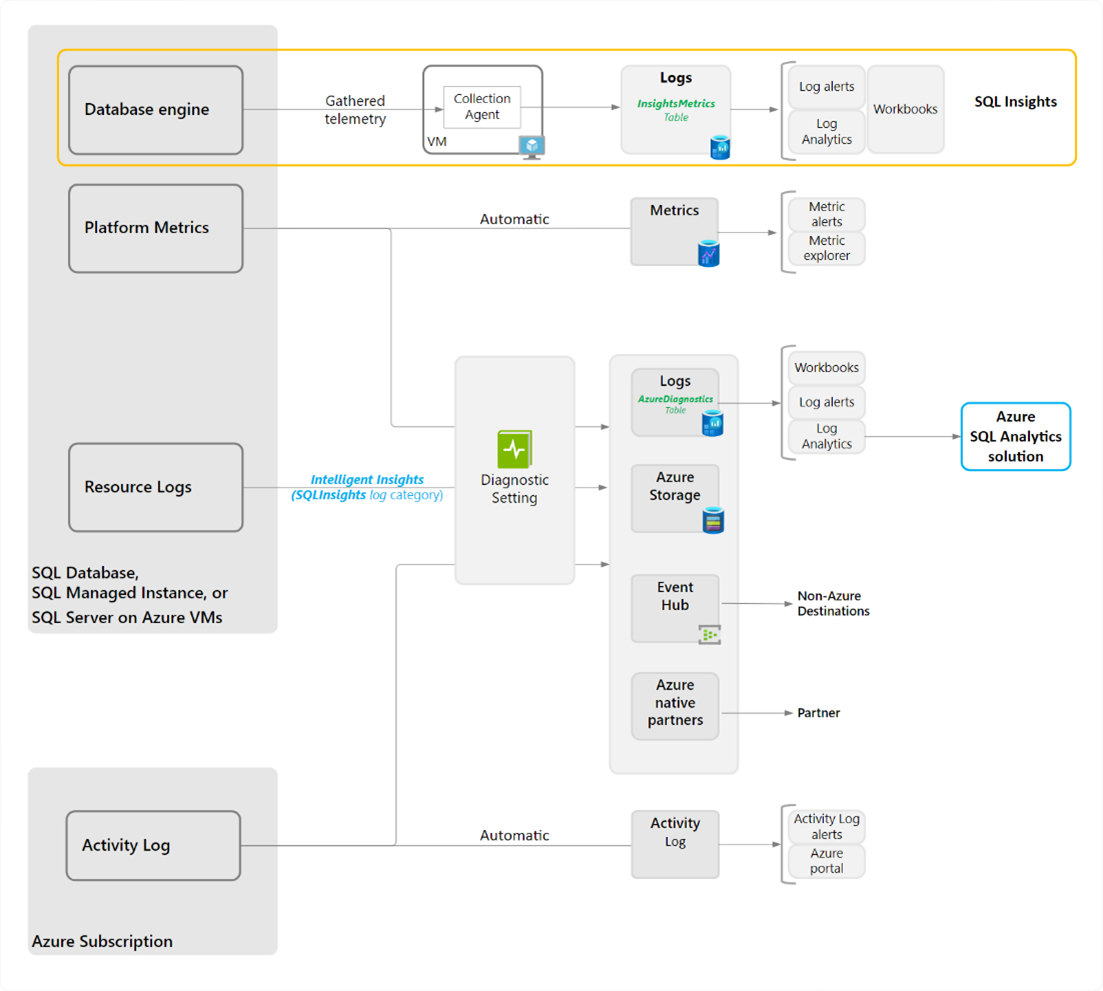
The following diagram details all the database engine, platform metrics, resource logs, and Azure activity logs generated by Azure SQL products, how they're processed, and how they can be surfaced for analysis.
You can quickly monitor various Azure SQL related resource metrics in the Azure portal in the Metrics view. These metrics enable you to see if a database is approaching the limits of CPU, memory, IO, or storage resources. High DTU, CPU or IO utilization may indicate that your workload needs more resources. It might also indicate that queries need to be optimized.
Database advisors
Azure SQL Database provides several Database Advisors to provide intelligent performance tuning recommendations and automatic tuning options to improve performance.
The Query Performance Insight page shows you details about the queries responsible for the most CPU and IO usage for single and pooled databases.
- Query Performance Insight is available in the Azure portal in the Overview pane of your Azure SQL Database under "Intelligent Performance." Use the automatically collected information to identify queries and begin optimizing your workload performance.
- You can also configure automatic tuning to implement these recommendations automatically, such as forcing a query execution plan to prevent regression, or creating and dropping nonclustered indexes based on workload patterns. Automatic tuning is also available in the Azure portal in the Overview pane of your Azure SQL Database under "Intelligent Performance."