Configure data collection rules for IaaS VM logs
If you enable VM insights, the Azure Monitor agent is installed and starts sending a predefined set of performance data to Azure Monitor Logs. You can create additional data collection rules to collect events and other performance data.
Data collection rules (DCRs) define the data collection process in Azure Monitor. DCRs specify what data should be collected, how to transform that data, and where to send that data. Some DCRs will be created and managed by Azure Monitor to collect a specific set of data to enable insights and visualizations. You might also create your own DCRs to define the set of data required for other scenarios.
You can define a data collection rule to send data from multiple machines to multiple Log Analytics workspaces, including workspaces in a different region or tenant. Create the data collection rule in the same region as your Log Analytics workspace. You can send Windows event and Syslog data to Azure Monitor Logs only. You can send performance counters to both Azure Monitor Metrics and Azure Monitor Logs.
Collect events and performance logs
To collect events and performance data, perform the following steps:
- In the Azure portal, navigate to Azure Monitor.
- On the Monitor menu, select Data Collection Rules.
- Select Create to create a new data collection rule and associations.
- Enter a Rule name and specify a Subscription, Resource Group, Region, and Platform Type:
- Region specifies where the DCR will be created. The virtual machines and their associations can be in any subscription or resource group in the tenant.
- Platform Type specifies the type of resources this rule can apply to. The Custom option allows for both Windows and Linux types.
- On the Resources tab:
- Select + Add resources and associate resources to the data collection rule. Resources can be virtual machines, Virtual Machine Scale Sets, and Azure Arc for servers.
- Select Enable Data Collection Endpoints.
- Select a data collection endpoint for each of the resources and associate to the data collection rule.
- On the Collect and deliver tab, select Add data source to add a data source and set a destination.
- Select a Data source type.
- Select which data you want to collect. For performance counters, you can select from a predefined set of objects and their sampling rate. For events, you can select from a set of logs and severity levels.
- Select Custom to collect logs and performance counters that aren't currently supported data sources, or to filter events by using XPath queries. You can then specify an XPath to collect any specific values.
- On the Destination tab, add one or more destinations for the data source. You can select multiple destinations of the same or different types. For instance, you can select multiple Log Analytics workspaces, which is also known as multihoming. You can send Windows event and Syslog data sources to Azure Monitor Logs only. You can send performance counters to both Azure Monitor Metrics and Azure Monitor Logs.
- Select Add data source and then select Review + create to review the details of the data collection rule and association with the set of virtual machines.
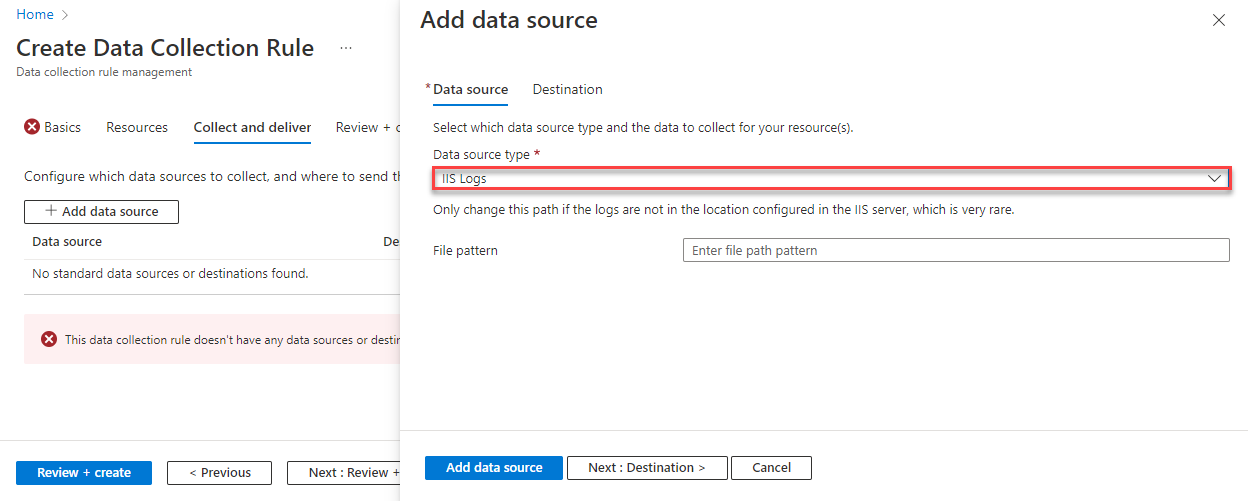
Collect IIS logs
To create the data collection rule to collect IIS logs from a Windows Server VM in the Azure portal perform the steps outlined in the collect events and performance section, except when choosing your data source, specify IIS Logs.
Collect Syslog data
Syslog is an event logging protocol that's common to Linux. You can use the Syslog daemon that's built into Linux devices and appliances to collect local events of the types you specify. You can then have it send those events to a Log Analytics workspace. Applications send messages that might be stored on the local machine or delivered to a Syslog collector.
When the Azure Monitor agent for Linux is installed, it configures the local Syslog daemon to forward messages to the agent when Syslog collection is enabled in data collection rules (DCRs). Azure Monitor Agent then sends the messages to an Azure Monitor or Log Analytics workspace where a corresponding Syslog record is created in a Syslog table.
The following facilities are supported with the Syslog collector:
- auth
- authpriv
- cron
- daemon
- mark
- kern
- lpr
- news
- syslog
- user
- uucp
- local0-local7
The Azure Monitor Agent for Linux only collects events with the facilities and severities that are specified in its configuration. You can configure Syslog through the Azure portal or by managing configuration files on your Linux agents.
Configure Syslog collection from the Data Collection Rules menu of Azure Monitor. This configuration is delivered to the configuration file on each Linux agent. Follow the procedure outlined earlier in the unit for events and performance logs, but when selecting Add data source, ensure that for the data source type you select Linux syslog.
You can collect Syslog events with a different log level for each facility. By default, all Syslog facility types are collected. If you don't want to collect, for example, events of auth type, select NONE in the Minimum log level list box for auth facility and save the changes. If you need to change the default log level for Syslog events and collect only events with a log level starting at NOTICE or a higher priority, select LOG_NOTICE in the Minimum log level list box.
