Create list data Power BI reports to display in Business Central
Business Central includes a factbox control element on several key list pages that provides more insight into the data in the list. As you move between rows in the list, the report is updated and filtered for the selected entry. You can create custom reports to display in this control, but there are a few rules to follow when creating the reports to ensure they provide the desired behavior.
You must have a valid account in both Business Central and Power BI. Start by creating your report in Power BI Desktop.
Select a report data set in Power BI Desktop
When you create a report in Power BI Desktop, specify the data source or web service that contains the data related to the list that you want to associate the report with. For example, if you want to create a report for the Sales List, ensure that the data set contains information related to sales.
To filter data on the reports based upon the record selected from the list page, the primary key must be used as a report filter. The primary keys need to be part of your data set for the reports to filter correctly. In most cases, the primary key for a list is the number (No.) field.
Define a report filter in Power BI Desktop
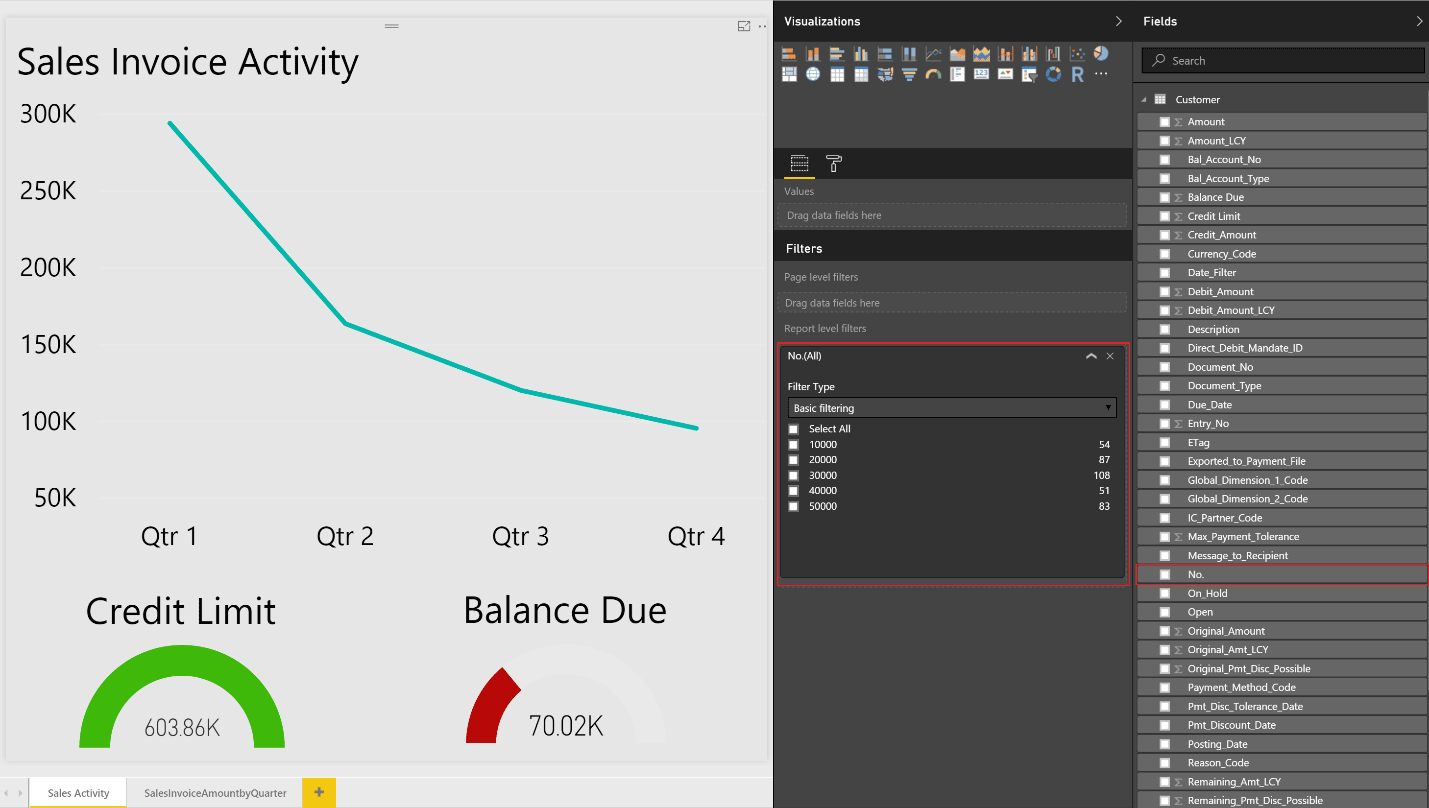
Reports shown in Business Central are required to have a basic report filter (not a page or visual filter and not an advanced filter) to filter correctly in the Power BI Fact Box Control. The filter that is passed to the Power BI report from each list page is based on the primary key as described in the previous section.
To define a filter for the report, select the primary key from the list of available fields, and then drag and drop that field into the Report Filter section.
Set the report size and color in Power BI Desktop
The report size must be set to 325 pixels by 310 pixels. This is required so that the report scales and displays properly in the available space allowed by the Power BI Fact Box control. To define the size of the report, place focus outside of the report layout area, and then choose the paint roller icon.
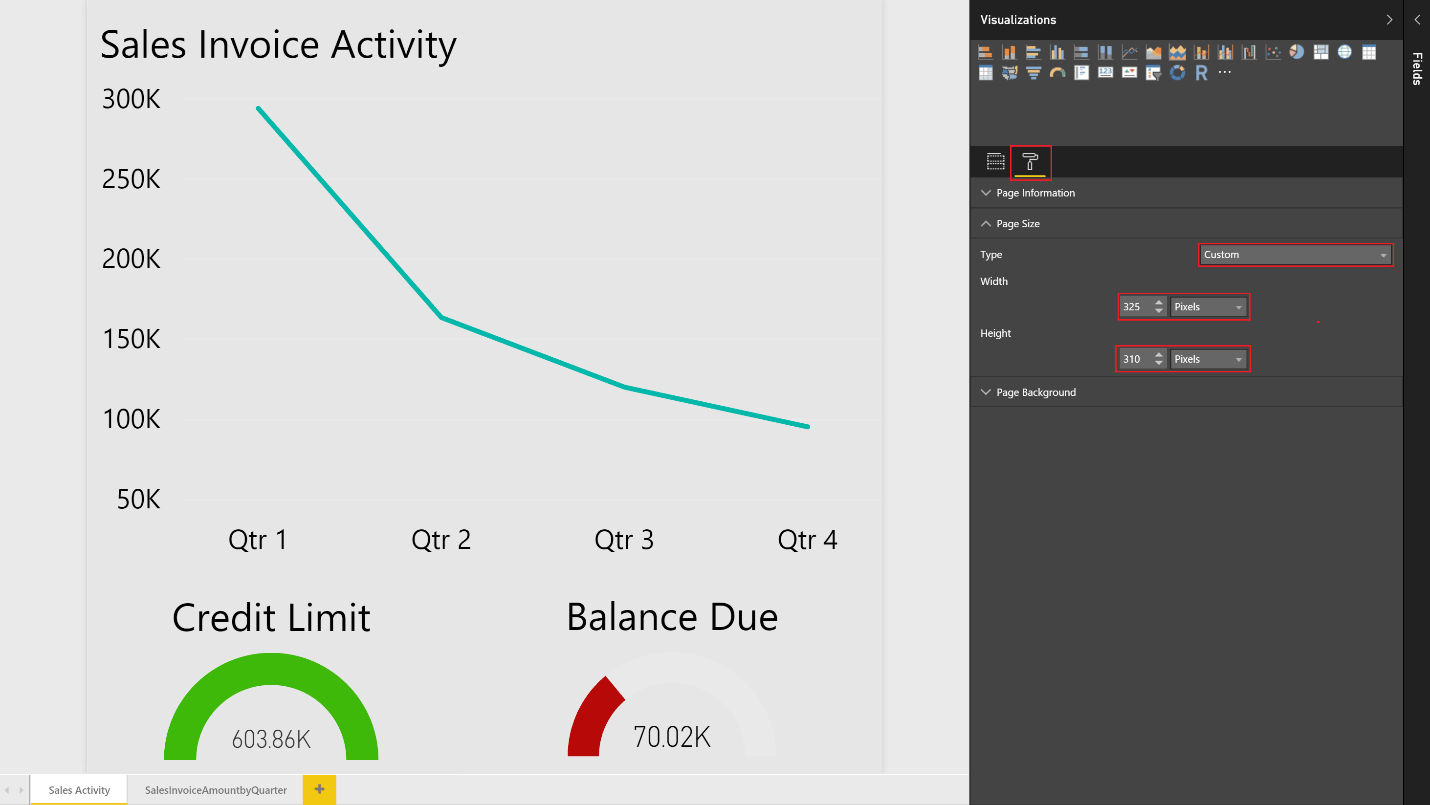
You can change the width and height of the report by choosing Custom in the Type field.
Similarly, if you want to have the background of the report blend into the background color of the Power BI Fact Box control, you can define a custom report background color of E5E5E5. This is optional.
Configure reports with multiple pages in Power BI Desktop
With Power BI, you can create a single report with multiple pages. The visuals that you want to see in the Business Central list pages must be on the first page of the report in Power BI.
The Power BI Fact Box can show only the first page of your report. If you want to see other pages, you must expand the report and use tabs at the bottom of the report to navigate to other pages
Save and name your report in Power BI Desktop
When you save your report, we recommend that you include the name of the list page that you want to display the report in. For example, include "Vendor" in the report name for reports that you want to make available on the Vendor list.
This isn't a requirement; however, it makes the process of selecting reports quicker. When the report selection page is opened from a list page, Business Central passes in a filter based on the page name to limit the reports that are displayed. You may remove the filter to get a full list of reports available to you in Power BI.