Exercise - Visualize and interact with simulated operations data using SignalR
Important
Be aware that this simulation generates a significant amount of data that simulates real-world operations. Azure consumption occurs. Remember to stop the simulator whenever it isn't needed to avoid unnecessary charges on your Azure account.
In this unit, you use the Visual Studio s solution to simulate an operating wind farm. You also send telemetry data to Azure Digital Twins, where your newly configured digital twin in Unity receives input and displays wind-farm operating conditions.
Begin the wind farm device simulation
In Visual Studio, open DeviceSimulator.sln.
Run the device simulator by selecting the Play button or F5.
A console window opens that displays turbine IDs and messages indicating connectivity and device retrieval and creation.
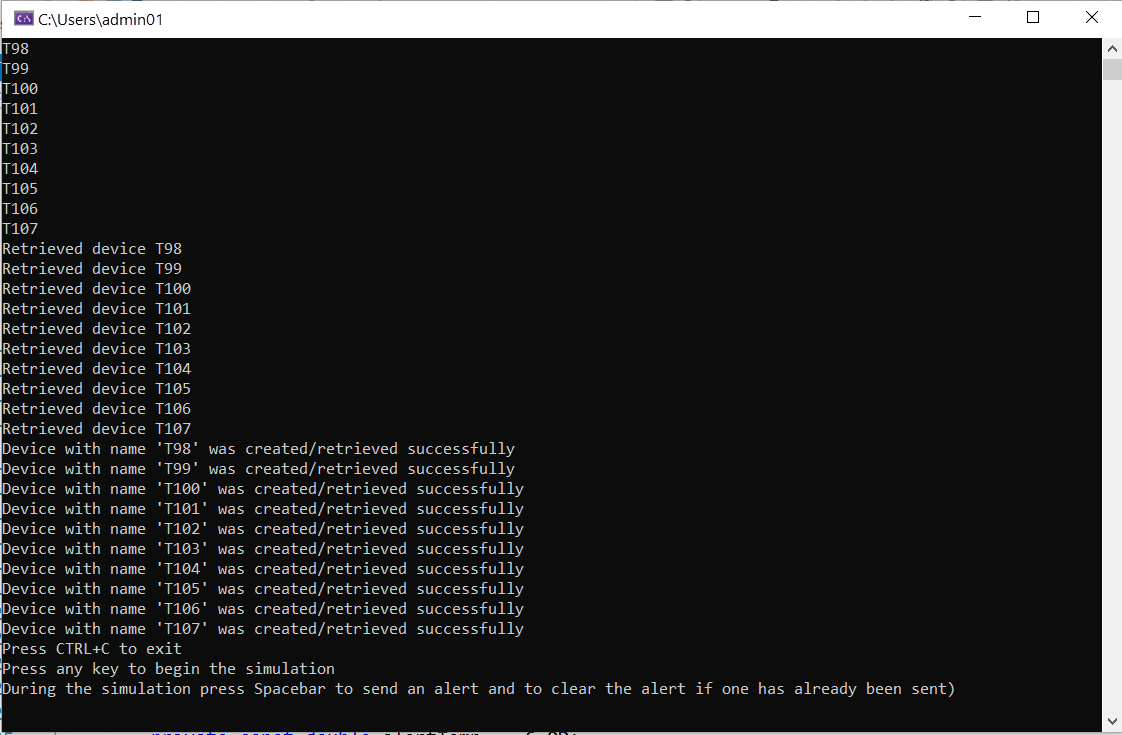
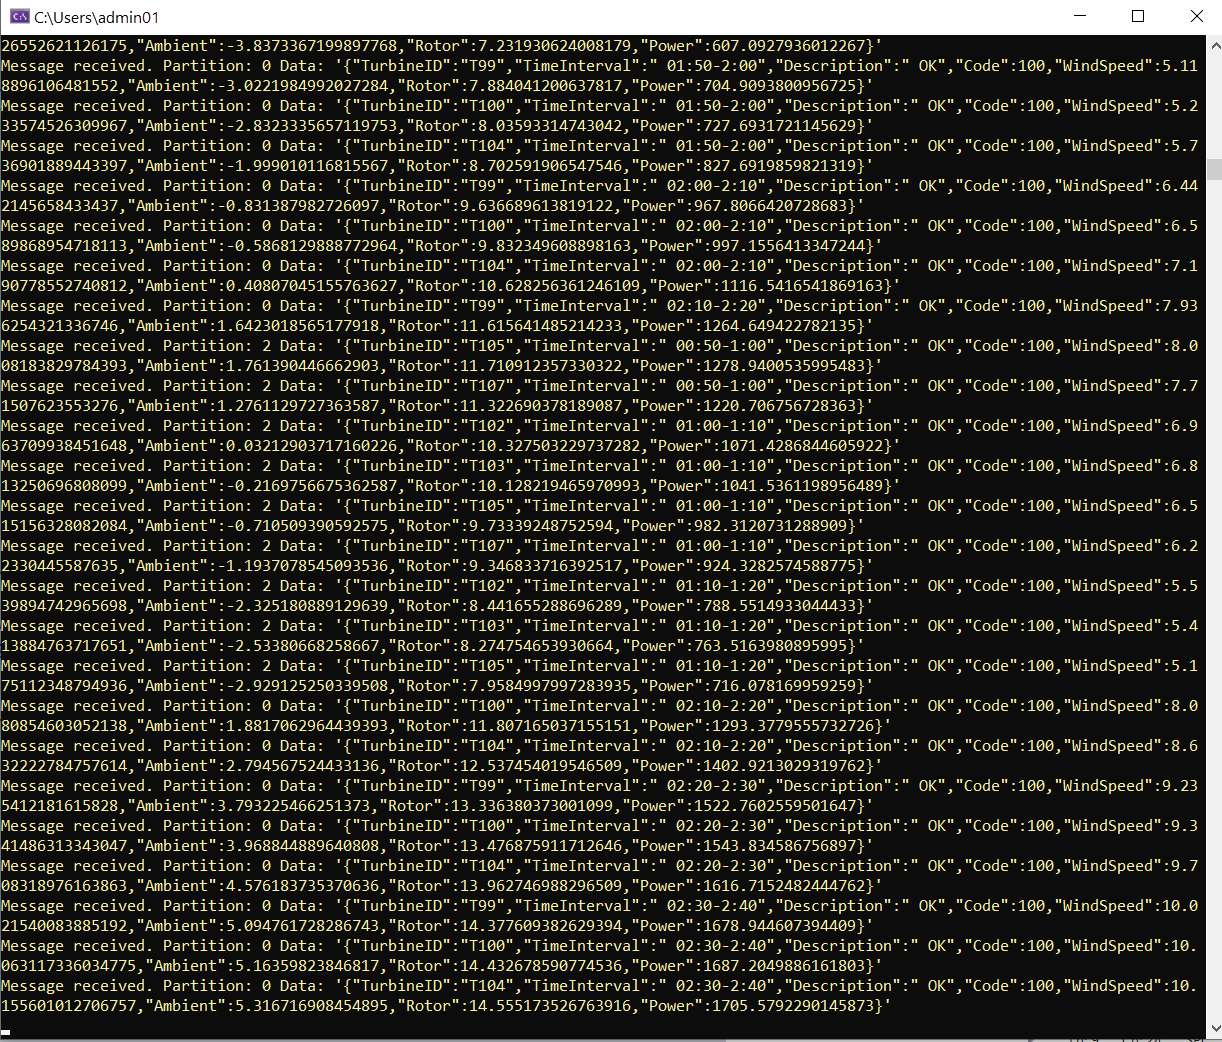
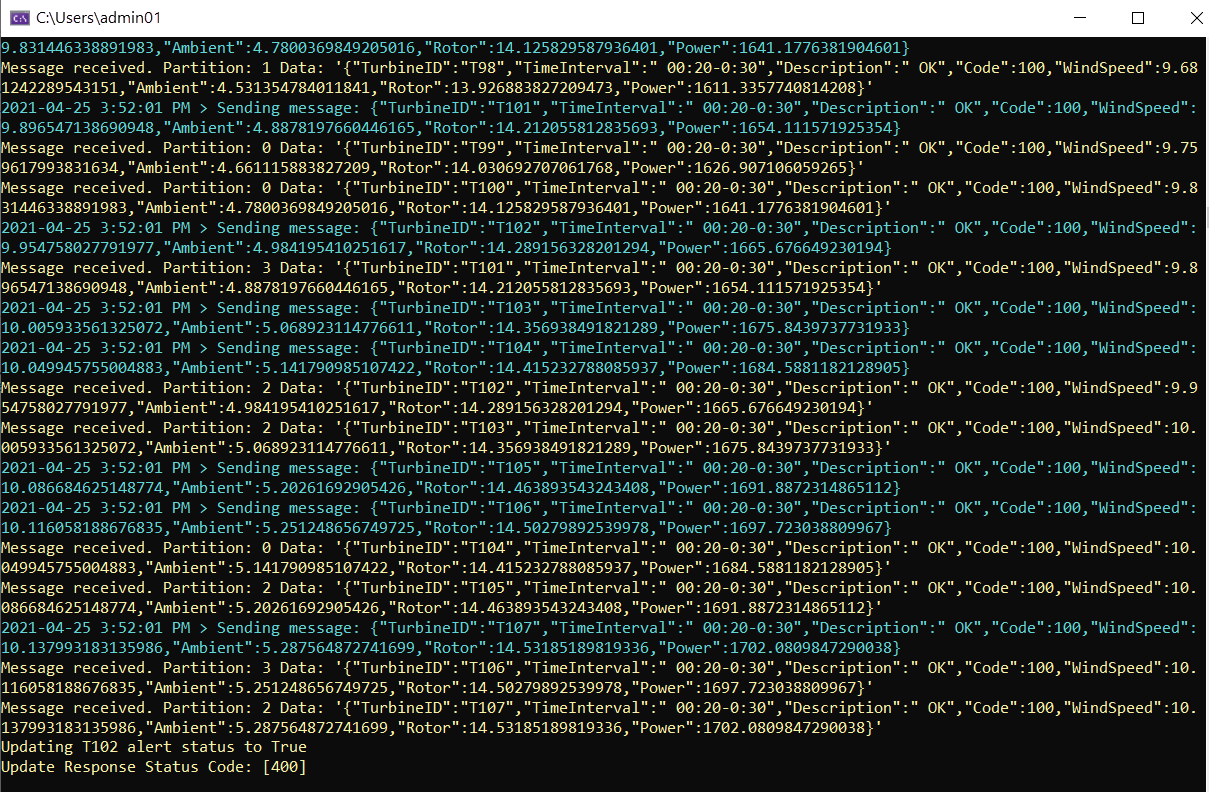
Press any key to begin the simulation. If configured properly and connected to the correct Azure services, there are a series of streaming console messages Message Received, which indicate that the Azure Digital Twins service has acknowledged the receipt of the simulated IoT data.
Launch the digital twin in Unity editor
Select the Play button in the Unity editor. The editor switches to the Game tab automatically and begins rendering your scene. The data in the UI panels reflect the data being generated from the
DeviceSimulatorapplication running.
Navigate in the Game tab by pressing and holding your right mouse button while you navigate. Move the scene so that the white circle hovers over a turbine or a turbine name. In the Site Overview Menu panel, you see the Turbine Panel with specifics for that Turbine asset.
Observe what happens to the data displayed in the Site Overview Menu and Turbine Panel in your Unity Game view.
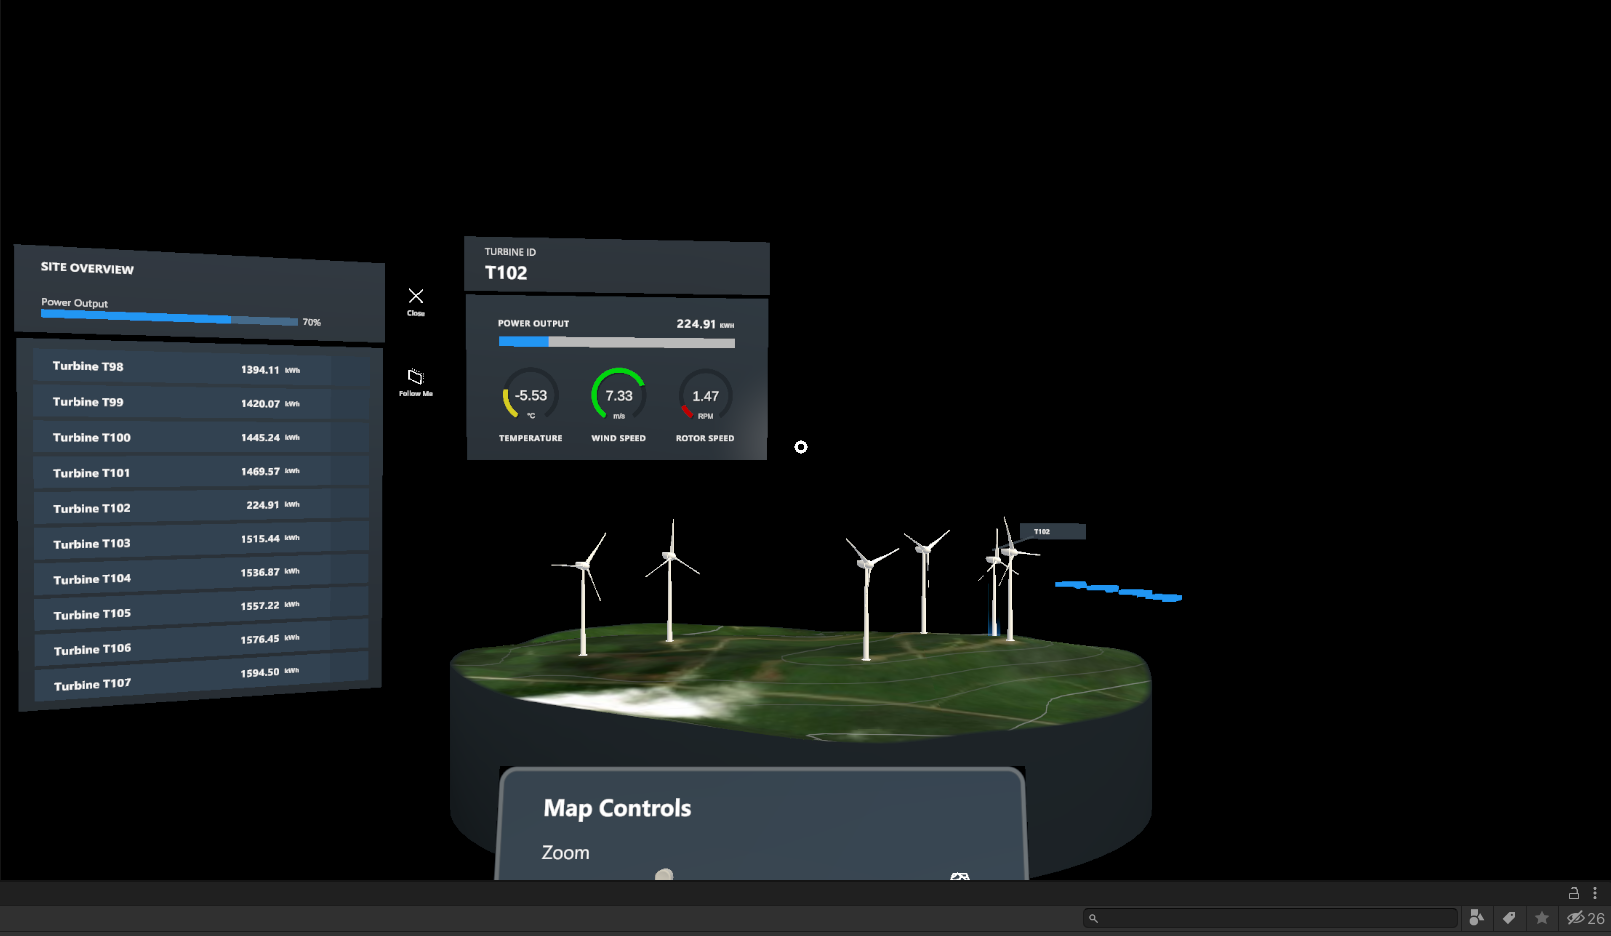
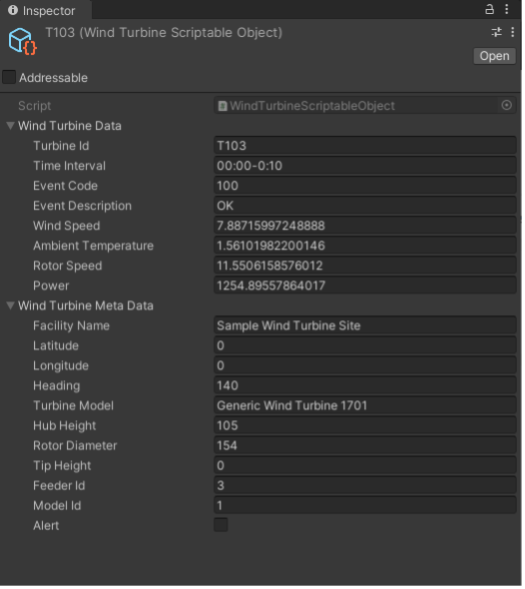
Observe wind-turbine performance data by selecting the scriptable object of interest. Select Assets > ScriptableObjects > Turbine Site Data > T103. Examine the incoming data in the Wind Turbine Data section of the Inspector panel. You should see the Time Interval, Wind Speed, Ambient Temperature, Rotor Speed, and Power fluctuate as new telemetry messages are consumed by the application.

Stop the DeviceSimulator
Stopping the simulator is important to ensure you avoid unnecessary charges to your Azure account. Press Ctrl+C in the command prompt window or select Stop in Visual Studio.
Next unit: Exercise - Connect to the Azure Digital Twins REST API to resolve alerts
Having an issue? We can help!
- For issues related to this module, explore existing questions using the #azure training tag or Ask a question on Microsoft Q&A.
- For issues related to Certifications and Exams, post on Certifications Support Forums or visit our Credentials Help.