Create a Power BI dataflow with Business Central data
In the previous unit, you've seen how to develop API page and API query objects. Power BI can then connect to the Business Central web services and import the data.
You can now access data from Business Central in a more seamless and proficient way by creating dataflows that you share across different reports and dashboards.
The Business Central connector is now available in Power Query Online (Power BI Datamarts and Dataflows). So you can create far more performant and flexible data source configurations, not least when multiple users access or refresh data from Business Central.
As data volume continues to grow, so does the challenge of wrangling that data into well-formed, actionable information. We want data that's ready for analytics, to populate visuals, reports, and dashboards, so we can quickly turn our volumes of data into actionable insights. With self-service data prep for big data in Power BI, you can go from data to Power BI insights with just a few clicks.

Dataflows are designed to support the following scenarios:
Create reusable transformation logic that many datasets and reports inside Power BI can share. Dataflows promote reusability of the underlying data elements, preventing the need to create separate connections with your cloud or on-premises data sources.
Expose the data in your own Azure Data Lake Gen 2 storage, enabling you to connect other Azure services to the raw underlying data.
Create a single source of the truth by forcing analysts to connect to the dataflows, rather than connecting to the underlying systems. So you have control over which data is accessed, and how data is exposed to report creators. You can also map the data to industry standard definitions, enabling you to create tidy curated views, which can work with other services and products in the Power Platform.
If you want to work with large data volumes and perform ETL at scale, dataflows with Power BI Premium scales more efficiently and gives you more flexibility. Dataflows supports a wide range of cloud and on-premises sources.
Prevent analysts from having direct access to the underlying data source. Since report creators can build on top of dataflows, it may be more convenient for you to allow access to underlying data sources only to a few individuals, and then provide access to the dataflows for analysts to build on top of. This approach reduces the load to the underlying systems and gives administrators finer control of when the systems get loaded from refreshes.
Once you've created a dataflow, you can use Power BI Desktop and the Power BI service to create datasets, reports, dashboards, and apps that use the Common Data Model. These tools help you gain deep insights into your business activities. Dataflow refresh scheduling is managed directly from the workspace in which your dataflow was created, just like your datasets.
A dataflow is a collection of tables that are created and managed in workspaces in the Power BI service. A table is a set of columns that are used to store data, much like a table within a database. You can add and edit tables in your dataflow, and manage data refresh schedules, directly from the workspace in which your dataflow was created.
To create a dataflow, launch the Power BI service in a browser then select a workspace (dataflows aren't available in my-workspace in the Power BI service) from the nav pane on the left, as shown in the following screen. You can also create a new workspace in which to create your new dataflow.

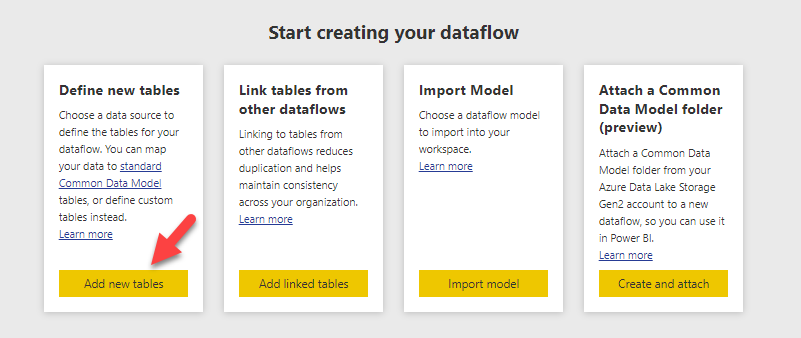
Using the Define new tables option lets you define a new table and connect to a new data source.
When you select a data source, you're prompted to provide the connection settings, including the account to use when connecting to the data source.
Once connected, you can select which data to use for your table. When you choose data and a source, Power BI reconnects to the data source. It does so in order to keep the data in your dataflow refreshed, at the frequency you select later in the setup process.
Once you select the data for use in the table, you can use dataflow editor to shape or transform that data into the format necessary for use in your dataflow.
Users can create Dataflows in a Premium workspace, with a Pro license, or with a Premium Per User (PPU) license.
To create a Power BI dataflow that connects to Business Central data, follow these steps:
Go to your Power BI Service.
Create a new workspace.
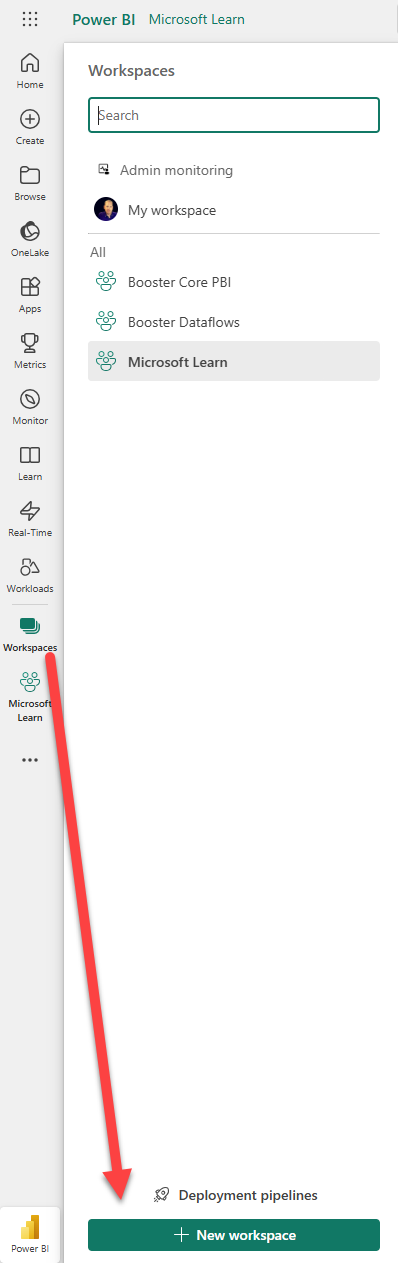
Enter a Workspace name and select Save.

In your Power BI workspace select New, Dataflow.

Select Add new tables.
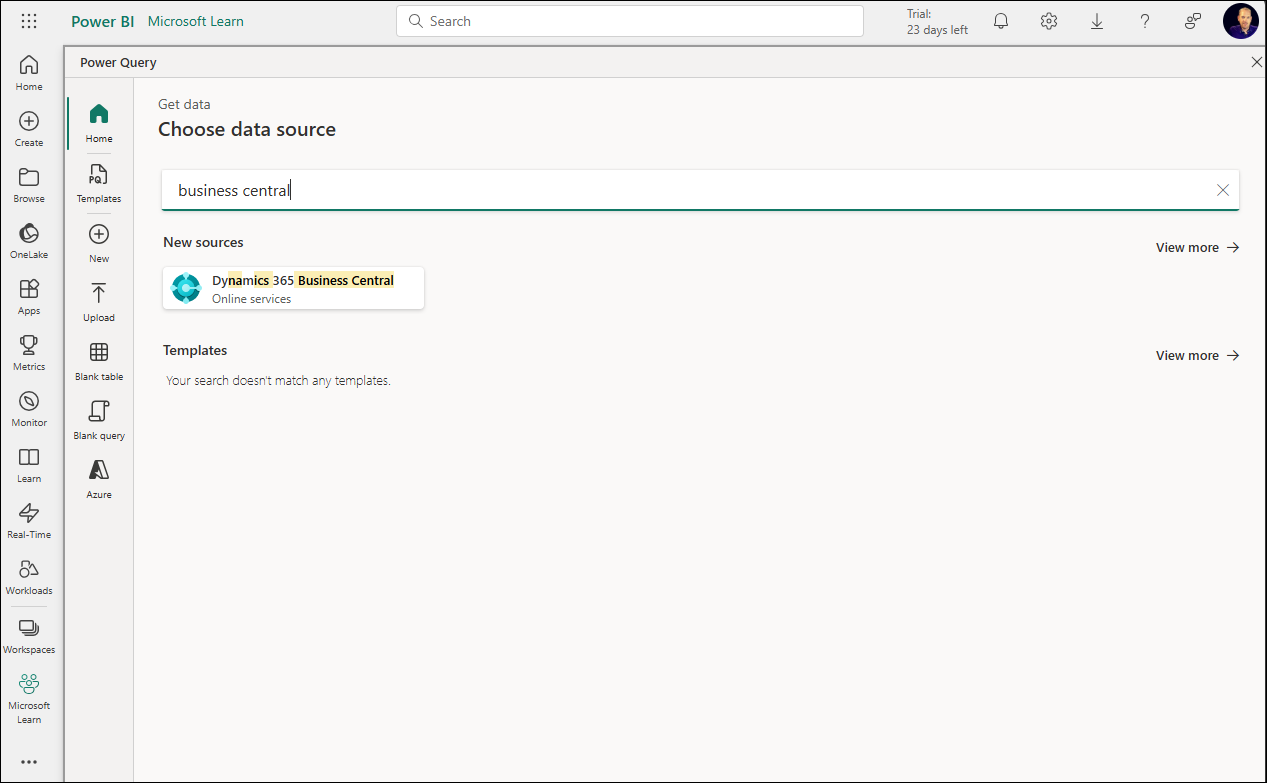
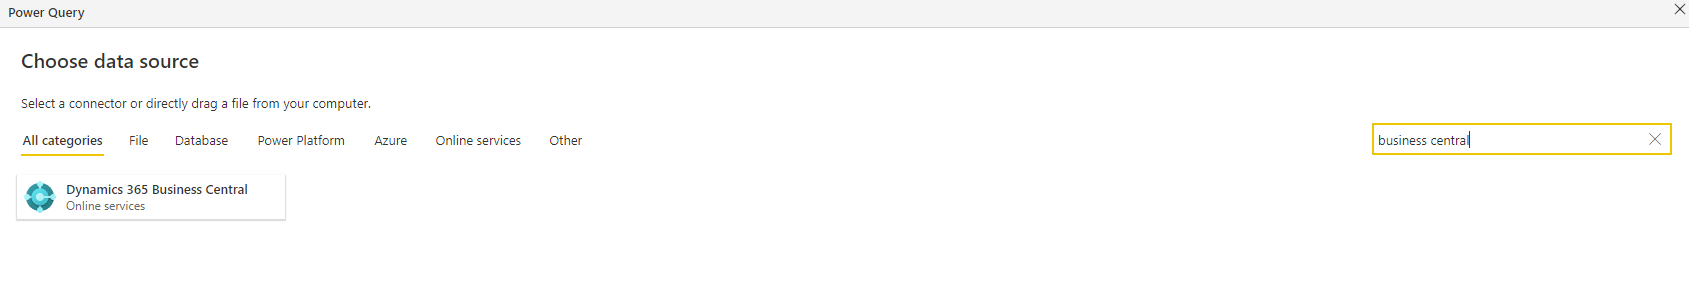
Select Dynamics 365 Business Central as the data source.
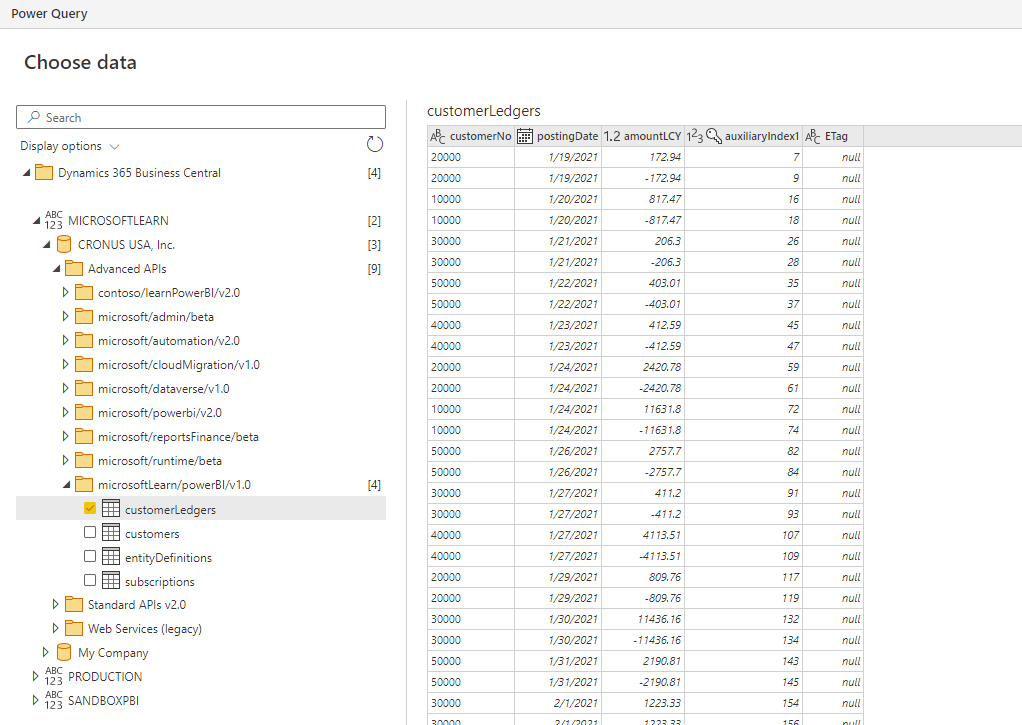
Next, enter the Environment, Company and API category, or leave them blank.
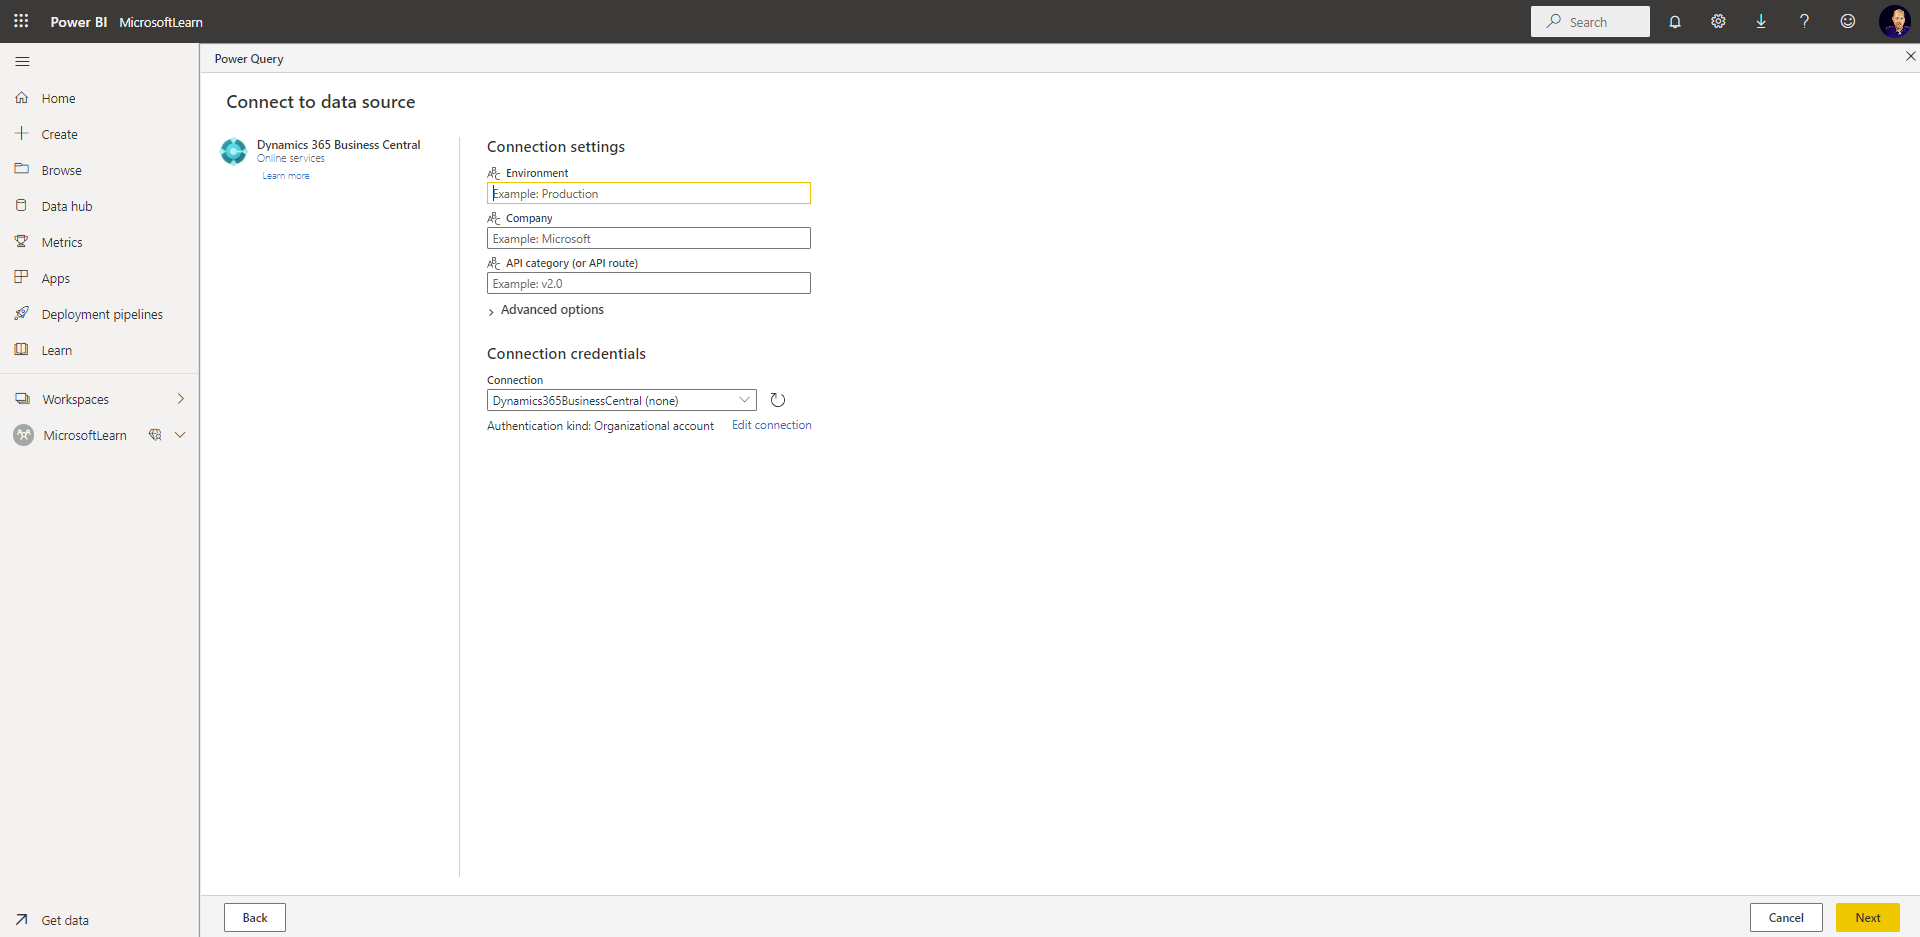
Enter your credentials in the connection, if asked.
Then select Next.
In the next screen you can see the Business Central APIs and Web services, per Environment and Company:
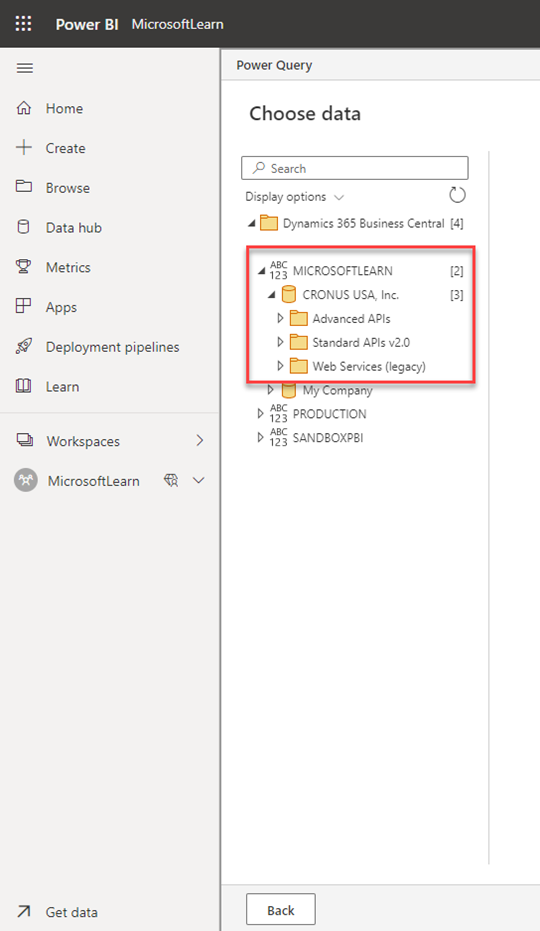
Connect to one of the APIs you have developer in the previous unit, or connect to a standard API:
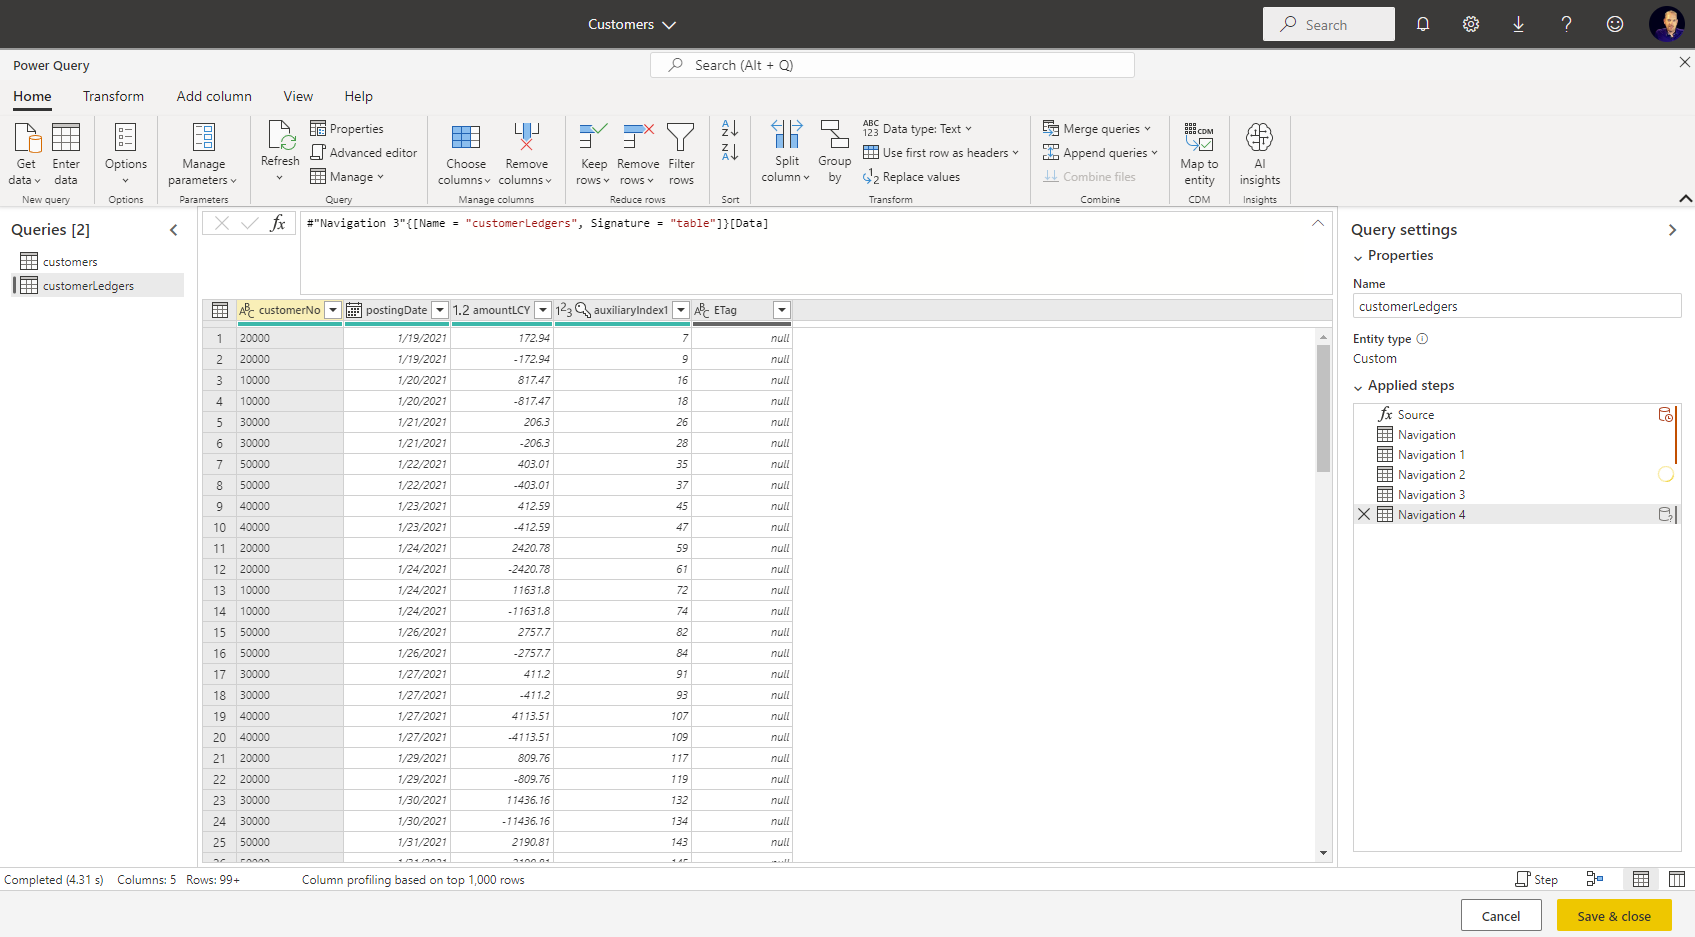
Now select Transform Data:
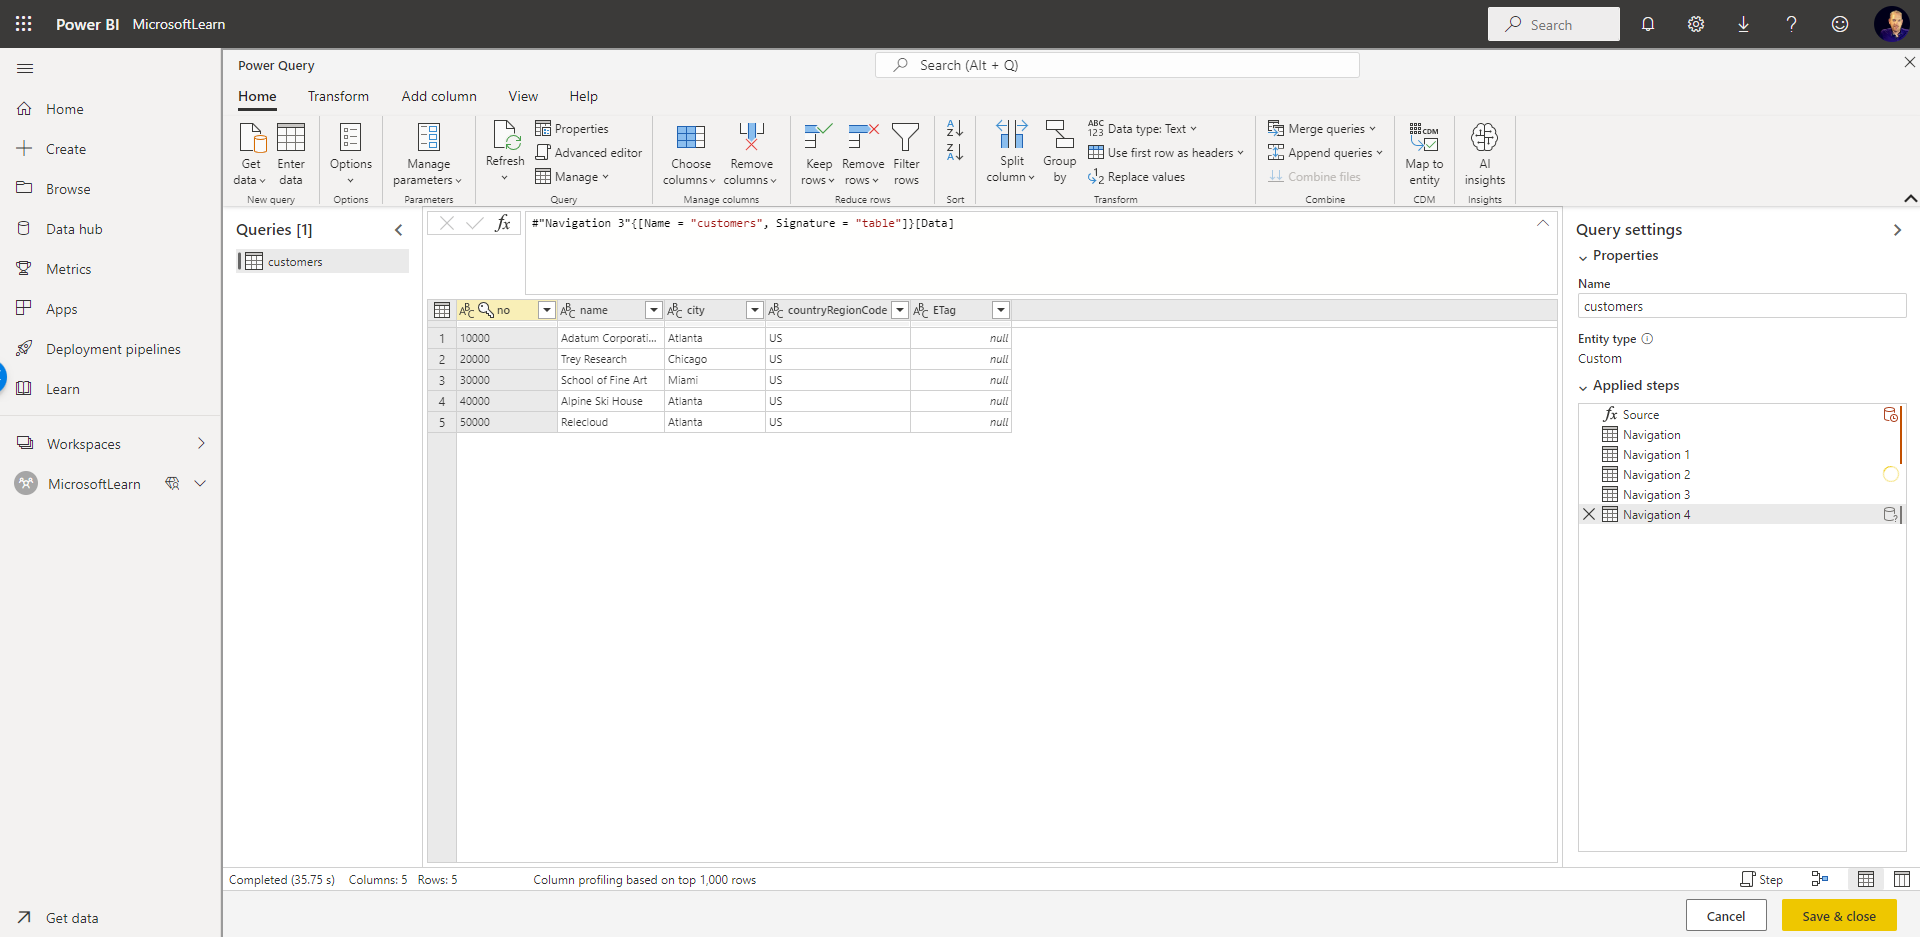
In the window that opens, you can see a typical Power Query interface. Here you can, if you need to, perform data transformations, apply filters, create new columns,...
Select Save & Close.
Give a name to the dataflow, for example Customers:
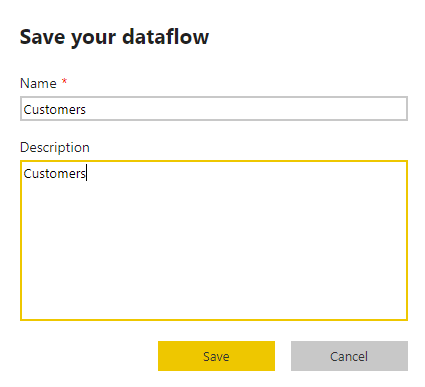
Then select Save.
You can now add other tables to the dataflow, if you want to.
Select Add tables and in the window that opens, filter on Business Central:
Select the Business Central connector and select Next.
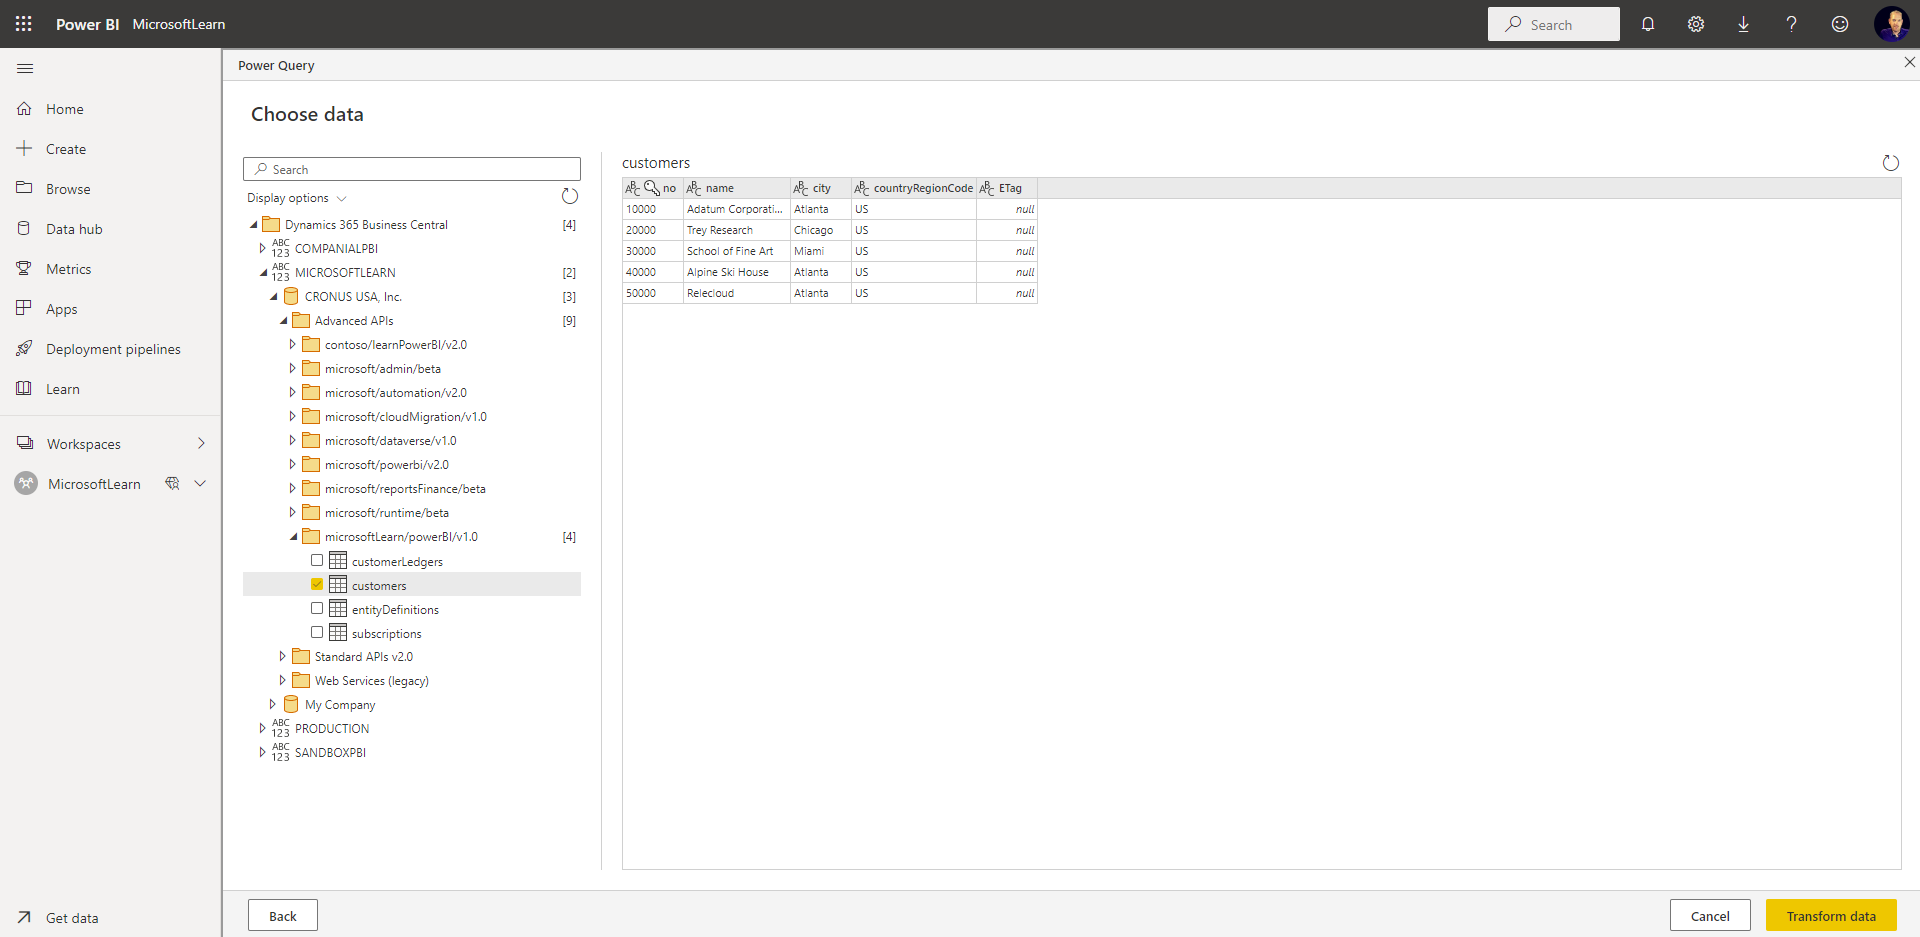
In the window that opens now select the customerLedgers API:
Select Transform Data:
Then select Save & Close.
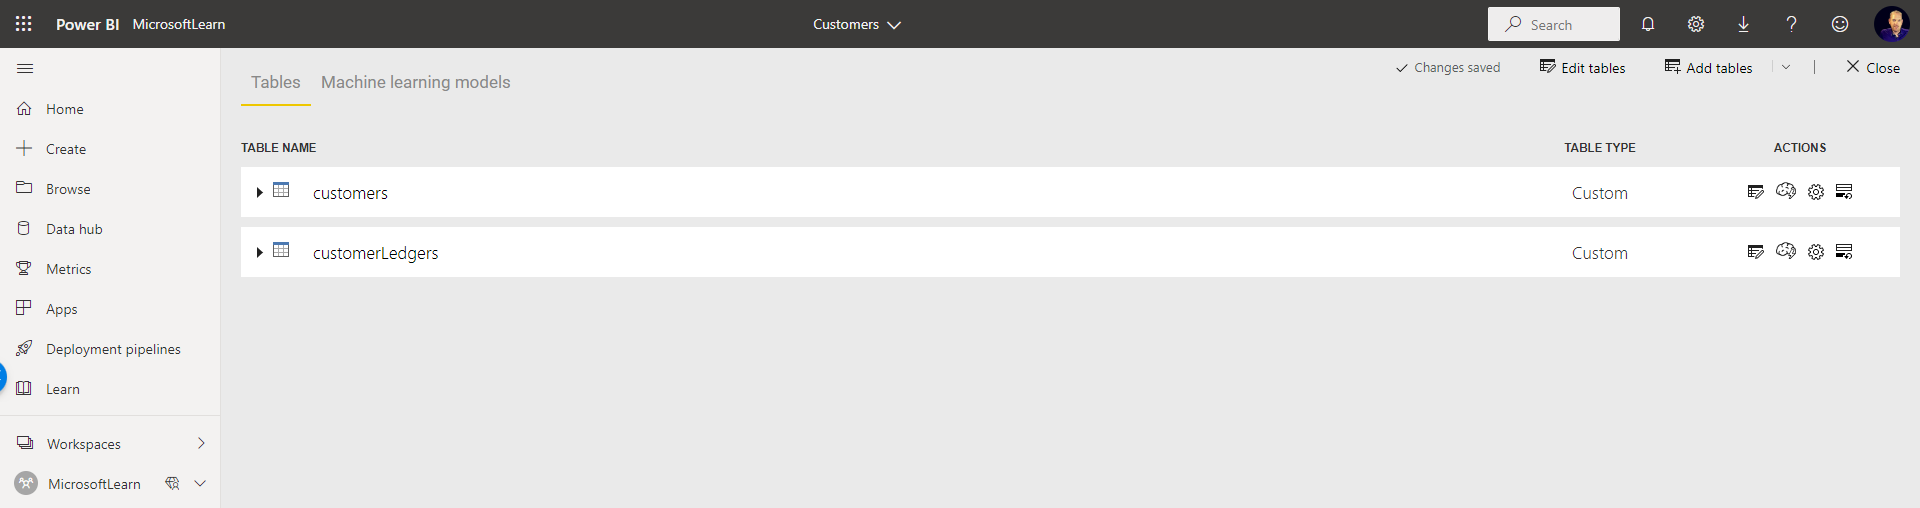
You now have two APIs in your Customers dataflow:
Select Close.
Now refresh the dataflow.
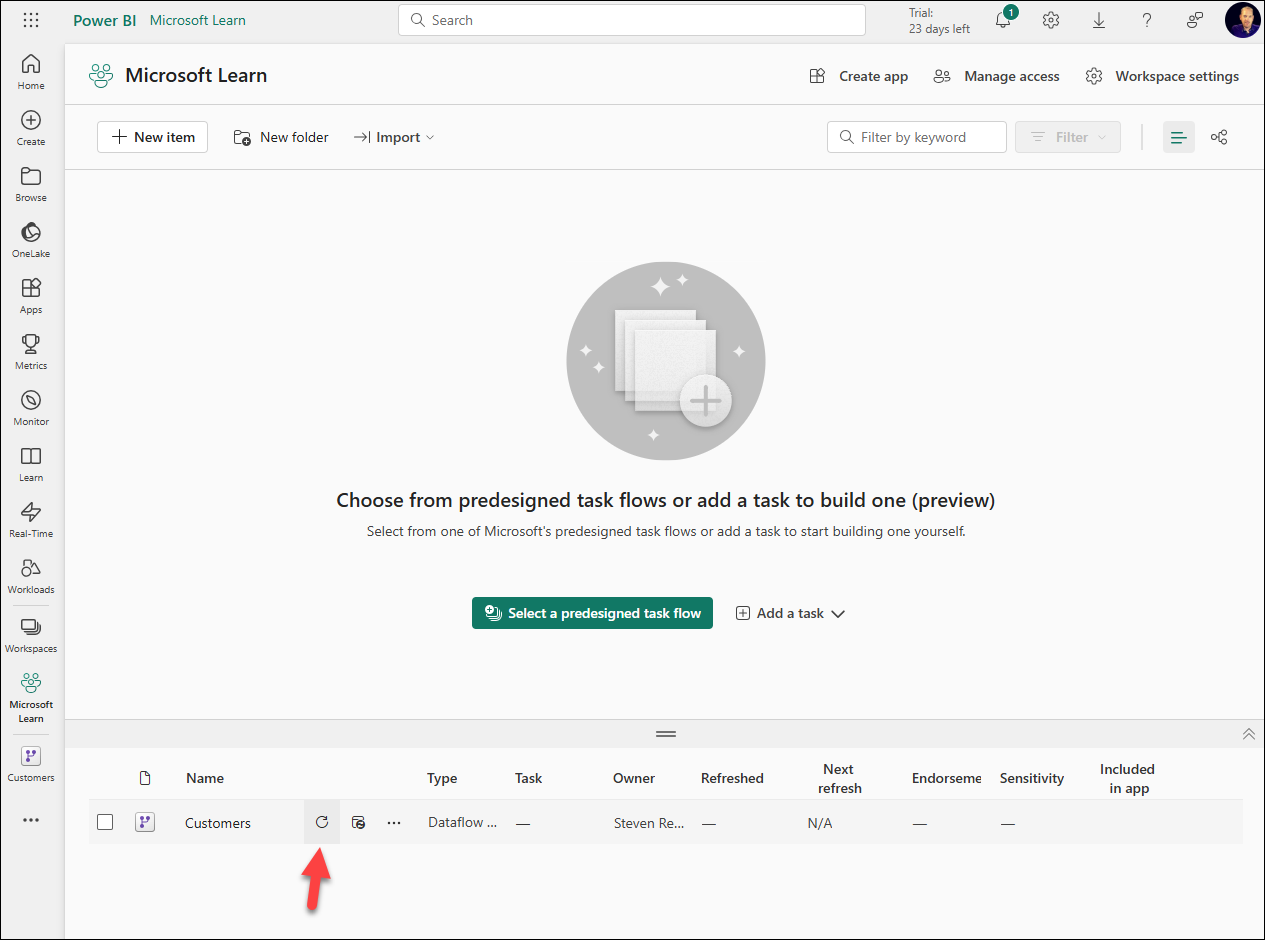
Your Power BI dataflow is now ready.


Once you create a dataflow, you can use Power BI Desktop and the Power BI service to create datasets, reports, dashboards, and apps that are based on the data you put into Power BI dataflows. So you gain insights into your business activities.
With dataflows, you can unify data from multiple sources and prepare that unified data for modeling. Whenever you create a dataflow, you're prompted to refresh the data for the dataflow. Refreshing a dataflow is required before it can be consumed in a dataset inside Power BI Desktop, or referenced as a linked or computed table.
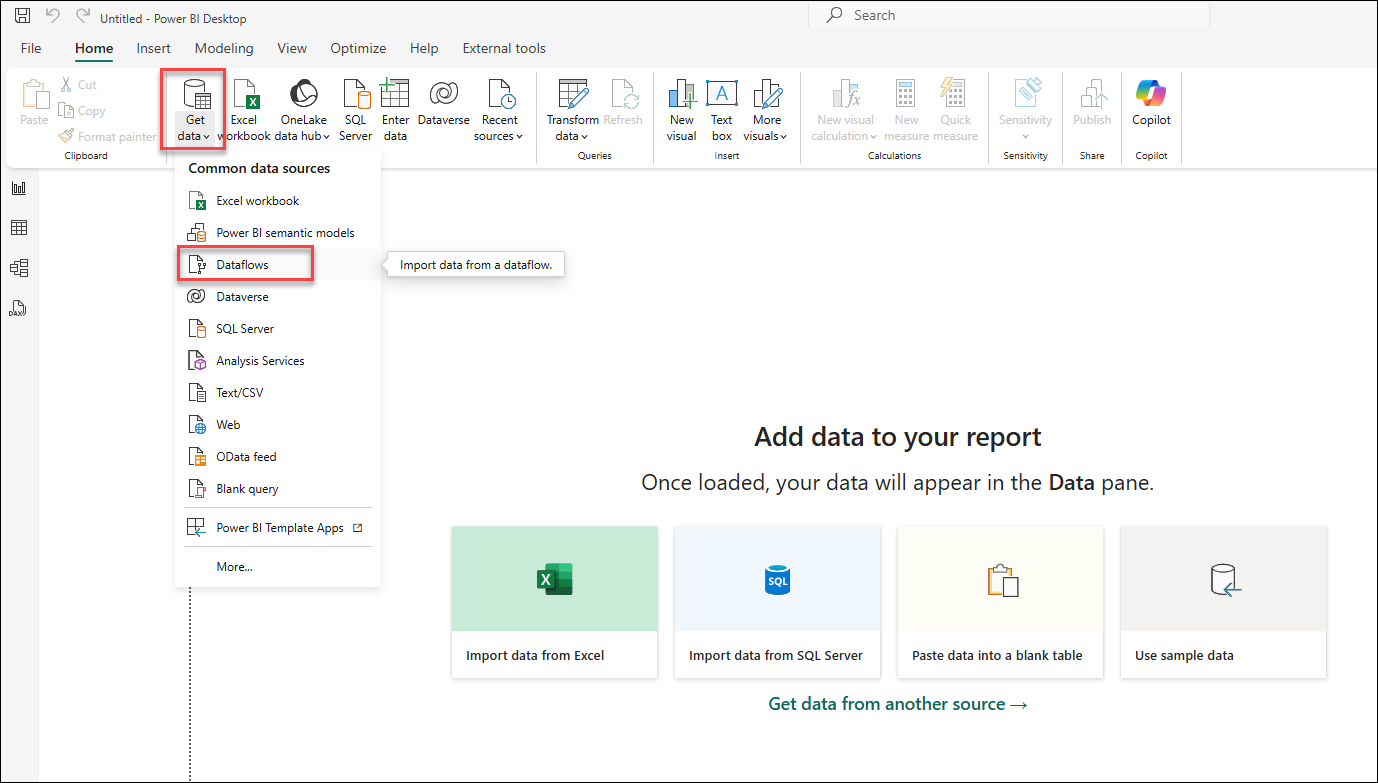
To consume a Power BI dataflow in Power BI Desktop, follow these steps:
In Power BI Desktop, select Get data, Dataflows.
In the Navigator that opens, open your Workspace and dataflow. Then select the tables from the dataflow:
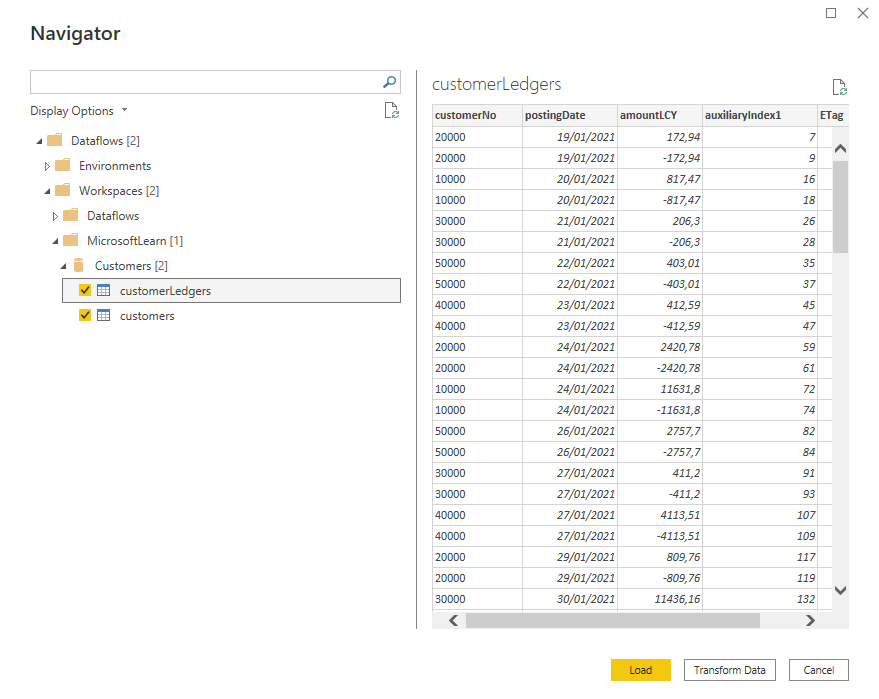
Select Load to load the data in Power BI Desktop:
Your tables are now created:
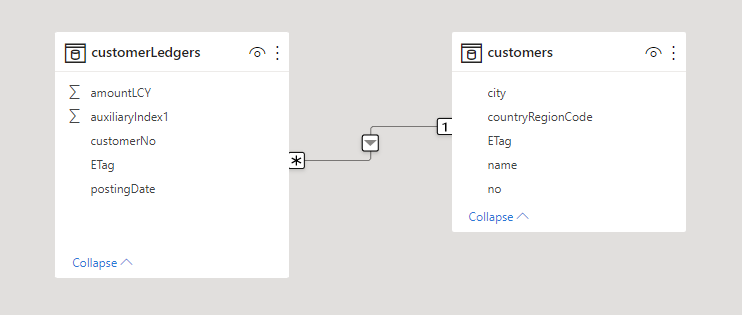
Now you can consume the data in the tables, as if you would develop any other Power BI report.


More information about dataflows is available here: