Exercise - Debug with Visual Studio Code
It's time to put into practice your newly acquired debugging knowledge. It turns out we have the perfect opportunity. In our Tailwind Traders app, we're developing a new feature to allow a product's price to display in multiple currencies. A coworker wrote some code for it, but they're having a hard time trying to figure out what's going wrong. Let's help.
Create a JavaScript file in a Visual Studio workspace
For this exercise, you need a JavaScript file to practice debugging. To use the debugger launch controls, the JavaScript file must be in a Visual Studio workspace.
The goal of the application is to set the exchange rate between three currencies, USD, EUR, and JPY. Then, we want to display how much value 10 EUR is in the other currencies by using two digits after the decimal point. For every currency added, the exchange rate for all other currencies should be calculated.
In Visual Studio Code, create a file named
mycurrency.jsat the./nodejs-debug/subfolder.Paste the following code into the new file editor:
const rates = {};

function setExchangeRate(rate, sourceCurrency, targetCurrency) {
  if (rates[sourceCurrency] === undefined) {
    rates[sourceCurrency] = {};
  }

  if (rates[targetCurrency] === undefined) {
    rates[targetCurrency] = {};
  }

  rates[sourceCurrency][targetCurrency] = rate;
  rates[targetCurrency][sourceCurrency] = 1 / rate;
}

function convertToCurrency(value, sourceCurrency, targetCurrency) {
  const exchangeRate = rates[sourceCurrency][targetCurrency];
  return exchangeRate && value * exchangeRate;
}

function formatValueForDisplay(value) {
  return value.toFixed(2);
}

function printForeignValues(value, sourceCurrency) {
  console.info(`The value of ${value} ${sourceCurrency} is:`);

  for (const targetCurrency in rates) {
    if (targetCurrency !== sourceCurrency) {
      const convertedValue = convertToCurrency(value, sourceCurrency, targetCurrency);
      const displayValue = formatValueForDisplay(convertedValue);
      console.info(`- ${convertedValue} ${targetCurrency}`);
    }
  }
}

setExchangeRate(0.88, 'USD', 'EUR');
setExchangeRate(107.4, 'USD', 'JPY');
printForeignValues(10, 'EUR');
To save the file, press Ctrl+S (Windows, Linux) or Cmd+S (Mac).
Create a launch configuration
We're going to use the debugger a lot, so let's create a launch configuration for your app.
On the Run tab in Visual Studio Code, select Create a launch.json file and select the Node.js debugger.
Visual Studio Code creates the
.vscode/launch.jsonconfiguration file at the root of the workspace and opens the launch file for editing.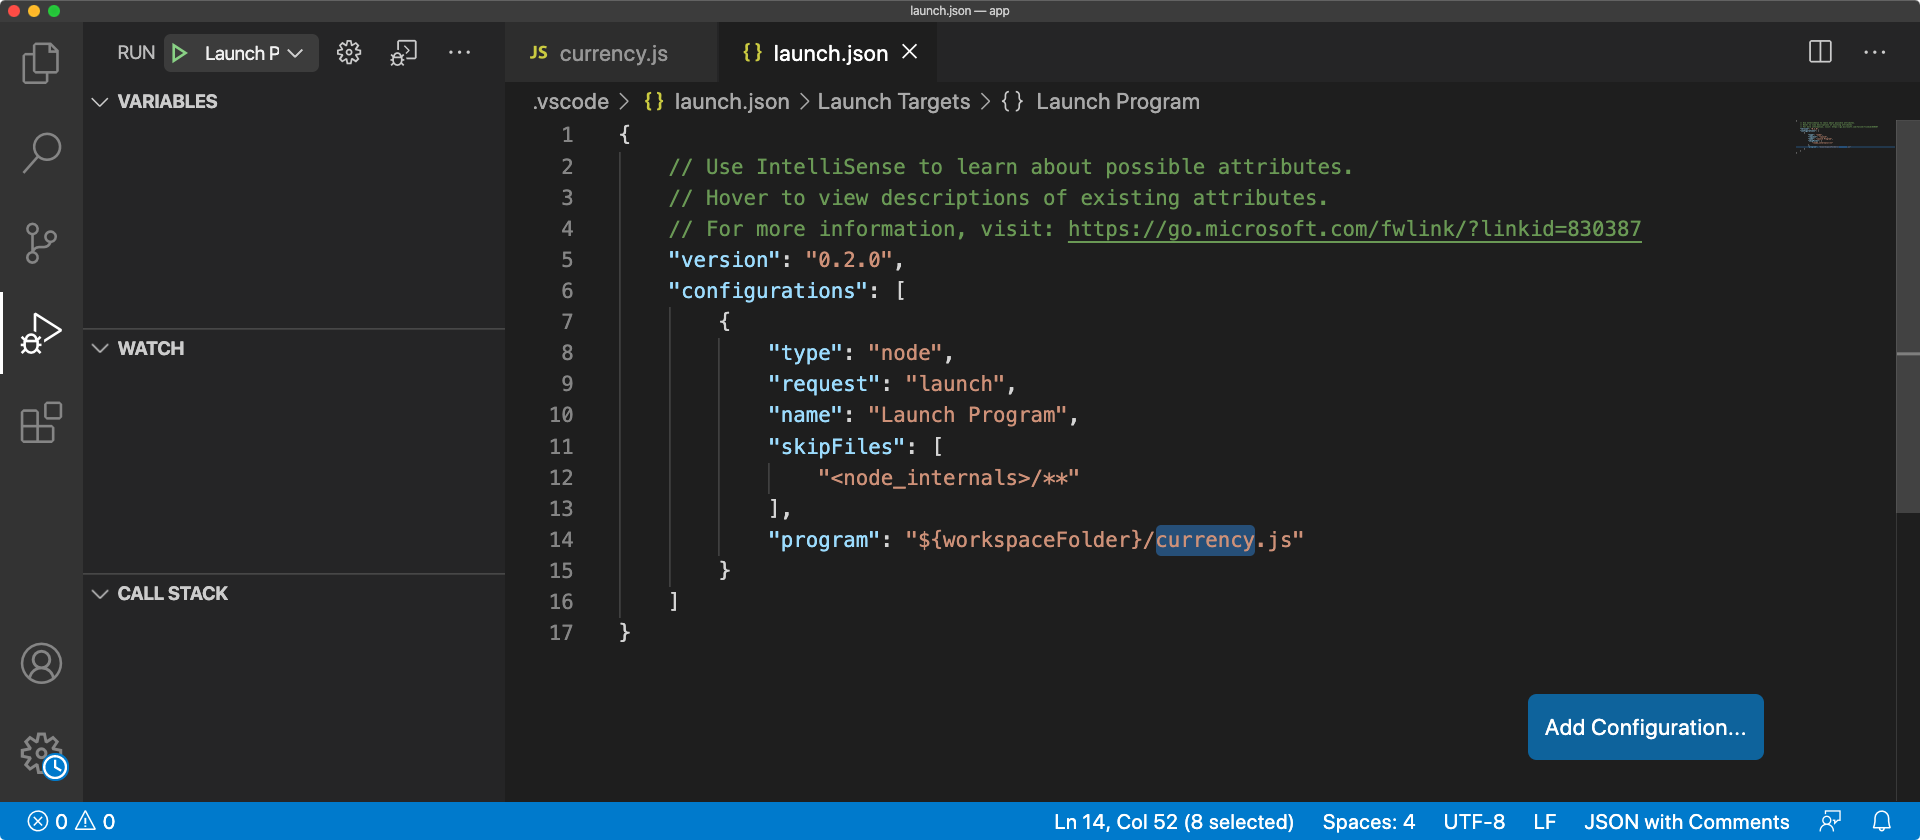
By default, a launch configuration is created to execute the currently opened file. In this example, the open file is
mycurrency.js. You can modify the launch configuration to customize how your program should start when you're debugging.In the launch configuration, view the value of the
programproperty.{ // Use IntelliSense to learn about possible attributes. // Hover to view descriptions of existing attributes. // For more information, visit: https://go.microsoft.com/fwlink/?linkid=830387 "version": "0.2.0", "configurations": [ { "type": "node", "request": "launch", "name": "Launch Program", "skipFiles": [ "<node_internals>/**" ], "program": "${workspaceFolder}/nodejs-debug/mycurrency.js" } ] }${workspaceFolder}indicates the root of the workspace.
Close the
.vscode/launch.jsonfile.
Note
You can create different launch configurations for your project by selecting Add Configuration at the bottom right.
Analyze the issues
Make sure your Visual Studio Code environment is ready to monitor the debugging process:
- The debugger panel should be open on the left. Use the Run tab icon on the left to toggle visibility of the panel.
- The debug console should be open at the bottom. You can open the console by selecting View > Debug Console, or by pressing Ctrl+Shift+Y (Windows, Linux) or Cmd+Shift+Y (Mac).
Now, you're ready to start debugging.
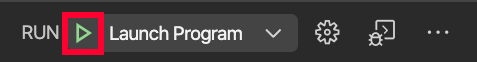
In the debugger launch controls, start the program with debugging enabled (the green arrow).
You should see the program finish quickly. That's normal because you haven't added any breakpoints yet.
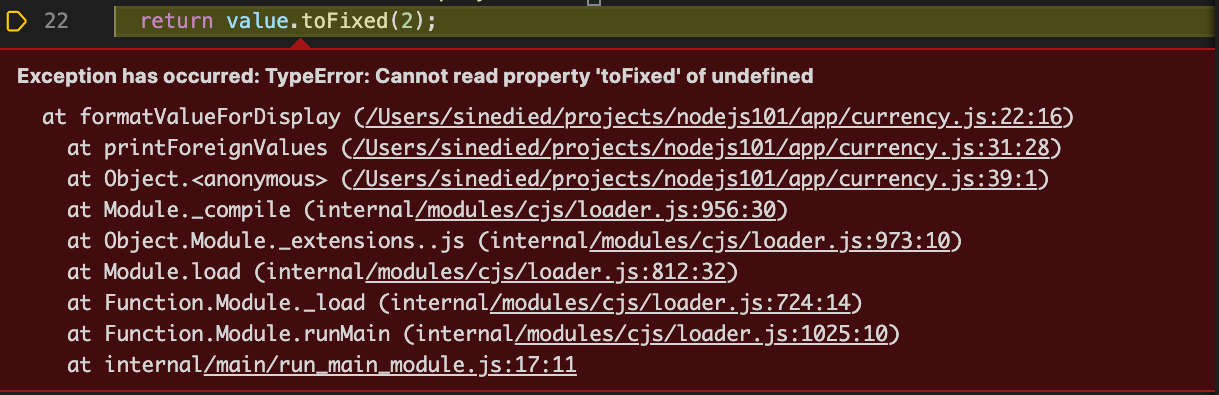
You should see this text in the debug console, followed by an exception.
The value of 10 EUR is:
11.363636363636365
- 11.363636363636365 USD
/app/node-101/currency.js:23
  return value.toFixed(2);
               ^
TypeError: Cannot read property 'toFixed' of undefined
    at formatValueForDisplay (/app/node-101/currency.js:23:16)
    at printForeignValues (/app/node-101/currency.js:32:28)
    at Object.<anonymous> (/app/node-101/currency.js:40:1)
    at Module._compile (internal/modules/cjs/loader.js:959:30)
    at Object.Module._extensions..js (internal/modules/cjs/loader.js:995:10)
    at Module.load (internal/modules/cjs/loader.js:815:32)
    at Function.Module._load (internal/modules/cjs/loader.js:727:14)
    at Function.Module.runMain (internal/modules/cjs/loader.js:1047:10)
    at internal/main/run_main_module.js:17:11
What this program aims to do is set the exchange rate between three currencies (USD, EUR, JPY), and display the value for 10 EUR in all the other currencies, with two digits after the decimal point.
We can see two bugs here:
- There are more than two digits after the decimal point.
- The program crashed with an exception and failed to display the
JPYvalue.
Tip
- Set
"outputCapture": "std",to your launch configuration file to increase logging output. - Set a logpoint instead of a breakpoint to avoid stopping the program execution. A logpoint does not "break" into the debugger but instead logs a message to the console. Logpoints are especially useful for injecting logging while debugging production servers that cannot be paused or stopped.
Fix the digits display
We'll start by fixing the first bug. Because you didn't write this code and there are different functions called, let's first understand the execution flow by using step-by-step execution.
Use breakpoints and step-by-step execution
To add a breakpoint, select in the left margin at line 39, on printForeignValues(10, 'EUR');.
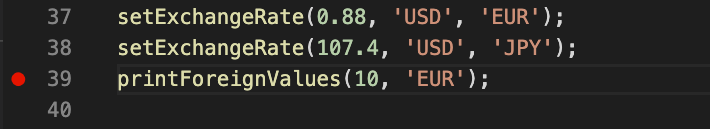
Start debugging again, and step into the printForeignValues() function with the Step into debug control:

Check the variables state
Now, take some time to inspect the different variable values in the Variables pane.
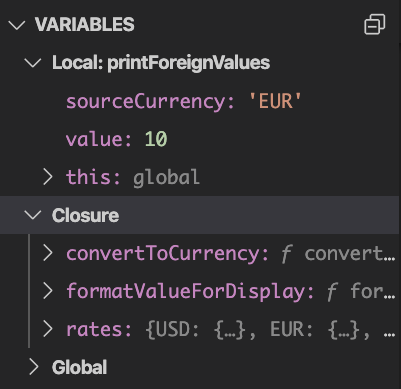
- What are the values for the
valueandsourceCurrencyvariables? - For the
ratesvariable, do you see the three expected keys,USD,EUR, andJPY?
To advance step by step until the convertedValue variable is set, use the Step over debug control:

After you use the Step over control five times, you should see the value of the convertedValue variable be set as expected 11.363636363636365.
If we step over one more time, we'll see the value of the displayValue variable. The value should be the formatted string for display with two digits 11.36.
We can then conclude that up to this point in the program, the functions convertToCurrency() and formatValueForDisplay() seem correct, and they return the expected result.
Correct the mistake
Use the Step into control once to reach the call to the console.info() function. Examine this line of code carefully. Do you see the mistake here?
We need to fix this program bug by using the displayValue variable instead of the convertedValue variable to print the value.
Update your
currency.jsfile to use the correct the variable name. Change the call to theconsole.info()function on line 32 to use thedisplayValuevariable instead of theconvertedValuevariable:console.info(`- ${displayValue} ${targetCurrency}`);Save the changes to your file.
Restart the program.
Check that the program correctly displays the USD value as 11.36. First bug - solved.
Find the cause of the crash
Let's now find out why the program is crashing.
In your
currency.jsfile, remove the breakpoint that you set on line 39.To force the program to pause after the exception is raised, in the Breakpoints pane, check the Uncaught Exceptions box.
Run the program in the debugger again.
The program should pause on the exception and show a large error report in the middle of the editor window.
Look at the line where the execution stopped, and notice the exception message TypeError: Cannot read property 'toFixed' of undefined. From that message, you can deduce that the value parameter function has the value undefined instead of being a number. This error is what caused the exception.
Rewind the call stack
The stack trace you see under the error message can be a bit difficult to decipher. The good news is that Visual Studio Code processes the function call stack for you. By default, it shows only the meaningful information in the Call stack pane. Let's use call stack information to find the code that led to this exception.
We know that the exception was thrown in the call to the formatValueForDisplay() function.
In the debugger panel, go to the Call stack pane.
To see where the
formatValueForDisplay()function was called, double-click the function under it - theprintForeignValuesfunction.Visual Studio Code goes to the line in the
printForeignValuesfunction in yourcurrency.jsfile, where theformatValueForDisplay()function was called:const displayValue = formatValueForDisplay(convertedValue);
Look closely at this line of code. The parameter that causes the exception comes from the convertedValue variable. You need to find out at what point this parameter value becomes undefined.
One option is to add a breakpoint at this line, and then inspect the variable every time the breakpoint stops at this line. But, we don't know when the wrong value might occur, and in complex programs, this debugging approach can be cumbersome. Let's look at an alternate method.
Add a conditional breakpoint
What would be helpful in our case is to be able to make the debugger stop at this breakpoint only when the value of the convertedValue variable is undefined. Fortunately, Visual Studio Code can do this action with right mouse click options.
In your
currency.jsfile, in the left margin on line 31, right click and select Add Conditional Breakpoint.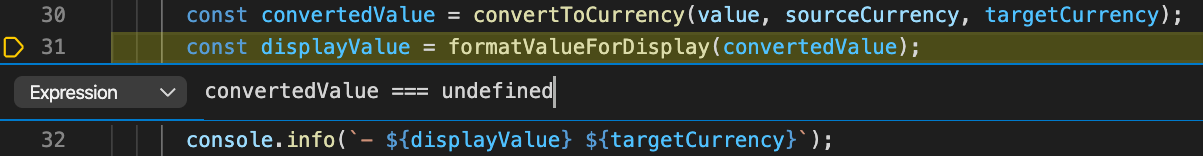
After you right-click, enter the following condition to trigger the breakpoint, and then press Enter:
`convertedValue === undefined`Restart the program.
The program should now stop on line 31, and we can examine the call stack values.
Observe the current state
Let's take some time to analyze the current program state.
The value of the
convertedValuevariable comes from the call to theconvertToCurrency(value, sourceCurrency, targetCurrency)function. We need to check the parameter values in this function call and confirm they're correct.In particular, we need to examine the
valuevariable and confirm it has the expected value10.
Take a look at the code of the convertToCurrency() function.
function convertToCurrency(value, sourceCurrency, targetCurrency) {
  const exchangeRate = rates[sourceCurrency][targetCurrency];
  return exchangeRate && value * exchangeRate;
}
You know that the result of this code is undefined. You also know that the value variable is set to 10. This information helps us see that the issue must be with the value of the exchangeRate variable.
In your currency.js file, hover over the rates variable to take a peek:
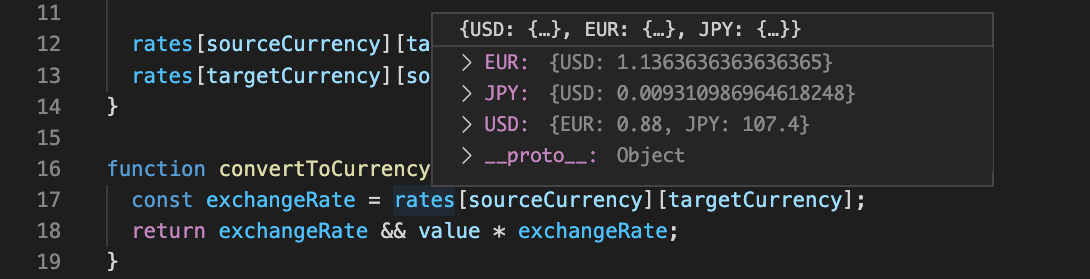
You try to get the exchange rate from EUR to JPY, but if you unfold the EUR value, you can see that there's only a conversion rate for USD. The conversion rate for JPY is missing.
Fix missing conversion rates
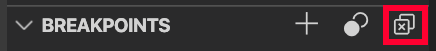
Now that you know some conversion rates are missing, let's understand why. To remove all existing breakpoints, in the Breakpoints pane, select the Remove all breakpoints icon.
Watch the rates variable
Let's set a breakpoint to watch the rates variable.
In your
currency.jsfile, add a breakpoint on line37in thesetExchangeRate(0.88, 'USD', 'EUR');function.In the Watch pane, select Plus, and enter
rates.Every time the value of the
ratesvariable is changed, the updated value is shown in the Watch pane.Restart the program.
When the breakpoint stops at the first call to
setExchangeRate()function, use the Step over control.In the Watch pane, look at the value of the
ratesvariable.At this point,
USDandEURhave matching opposite conversion rates, as we expected.Step over again at the second call to the
setExchangeRate()function.You see that
USDandJPYhave matching opposite conversion rates, but there's nothing betweenEURandJPY.
It's time to look at the code for the setExchangeRate() function.
function setExchangeRate(rate, sourceCurrency, targetCurrency) {
  if (rates[sourceCurrency] === undefined) {
    rates[sourceCurrency] = {};
  }

  if (rates[targetCurrency] === undefined) {
    rates[targetCurrency] = {};
  }

  rates[sourceCurrency][targetCurrency] = rate;
  rates[targetCurrency][sourceCurrency] = 1 / rate;
}
The most important lines in this function are the last two. It seems you've found the second bug! The conversion rates are only set between the sourceCurrency and targetCurrency variables. The program also needs to calculate the conversion rate for the other currencies that were added.
Fix the code
Let's fix the code for the conversion rate issue.
Update your
currency.jsfile to calculate the conversion rate for the other currencies.Replace the code on lines 12 and 13:
rates[sourceCurrency][targetCurrency] = rate;
rates[targetCurrency][sourceCurrency] = 1 / rate;
with this updated code:
for (const currency in rates) {
  if (currency !== targetCurrency) {
    // Use a pivot rate for currencies that don't have the direct conversion rate
    const pivotRate = currency === sourceCurrency ? 1 : rates[currency][sourceCurrency];
    rates[currency][targetCurrency] = rate * pivotRate;
    rates[targetCurrency][currency] = 1 / (rate * pivotRate);
  }
}
Save the changes to your file.
The updated code sets the conversion rate for any currencies other the sourceCurrency and targetCurrency. The program uses the conversion rate of the sourceCurrency to deduce the rate between the other currency and targetCurrency. The code then sets the conversion rate for the other currency accordingly.
Note
This fix only works if the rates between sourceCurrency and other currencies already exist, which is an acceptable limitation in this case.
Test the correction
Let's test our change.
Remove all breakpoints and watch variables.
Restart the program.
You should now see the expected result in the console without any crash.
The value of 10 EUR is:
- 11.36 USD
- 1220.45 JPY
That's it. You fixed the code. You can now efficiently debug code you didn't even know beforehand by using Visual Studio Code. Well done!
Cleanup development container
After completing the project, you may wish to clean up your development environment or return it to its typical state.
Deleting the GitHub Codespaces environment ensures that you can maximize the amount of free per-core hours entitlement you get for your account.
Important
For more information about your GitHub account's entitlements, see GitHub Codespaces monthly included storage and core hours.
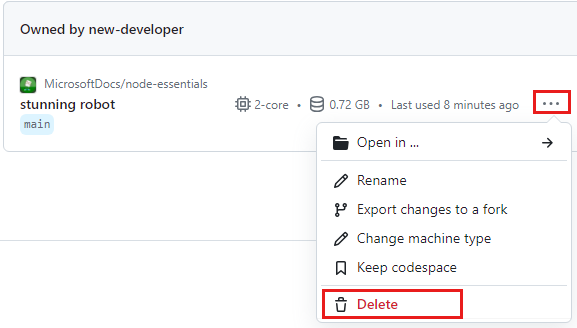
Sign into the GitHub Codespaces dashboard (https://github.com/codespaces).
Locate your currently running Codespaces sourced from the
MicrosoftDocs/node-essentialsGitHub repository.
Open the context menu for the codespace and select Delete.