Investigate incidents in Microsoft Defender XDR
Applies to:
- Microsoft Defender XDR
Microsoft Defender XDR aggregates all related alerts, assets, investigations, and evidence from across your devices, users, and mailboxes into an incident to give you a comprehensive look into the entire breadth of an attack.
Within an incident, you analyze the alerts that affect your network, understand what they mean, and collate the evidence so that you can devise an effective remediation plan.
Initial investigation
Before diving into the details, take a look at the properties and the entire attack story of the incident.
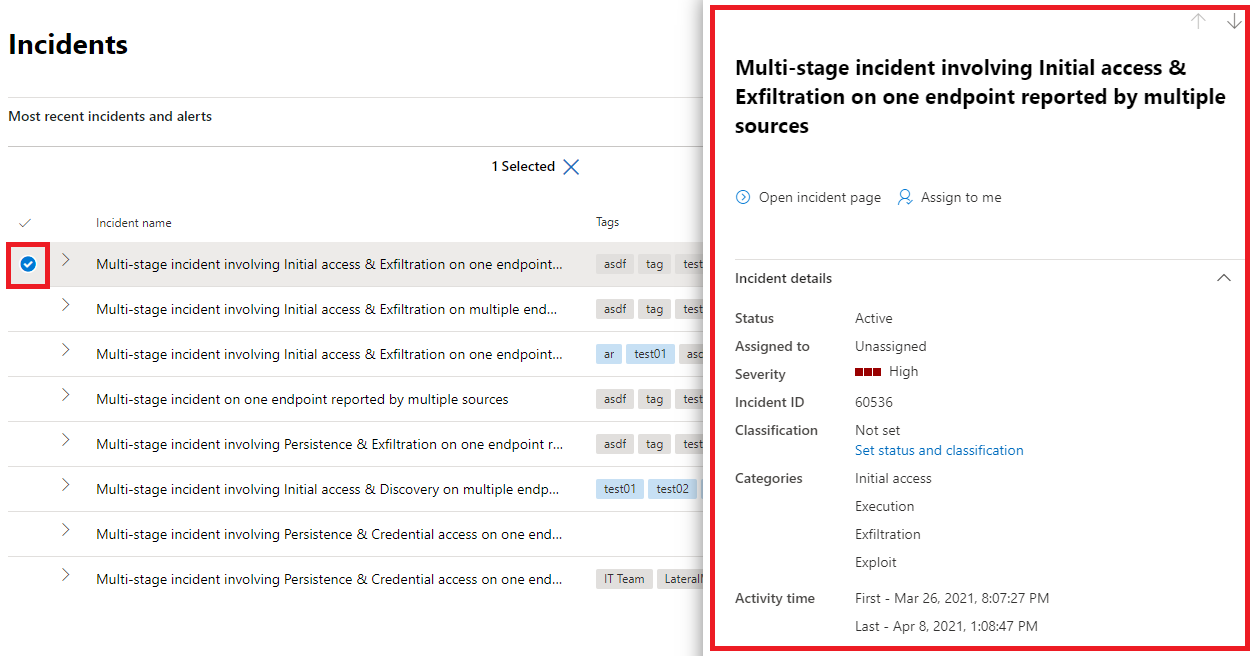
You can start by selecting the incident from the check mark column. Here's an example.
When you do, a summary pane opens with key information about the incident, such as severity, to whom it is assigned, and the MITRE ATT&CK™ categories for the incident. Here's an example.
From here, you can select Open incident page. This opens the main page for the incident where you'll find the full attack story information and tabs for alerts, devices, users, investigations, and evidence.
You can also open the main page for an incident by selecting the incident name from the incident queue.
Attack story
Attack stories help you to quickly review, investigate, and remediate attacks while viewing the full story of the attack on the same tab. It also allows you to review the entity details and take remediation actions, such as deleting a file or isolating a device without losing context.
The attack story is briefly described in the following video.
Within the attack story you can find the alert page and the incident graph.
The incident alert page has these sections:
Alert story, which includes:
- What happened
- Actions taken
- Related events
Alert properties in the right pane (state, details, description, and others)
Note that not every alert will have all of the listed subsections in the Alert story section.
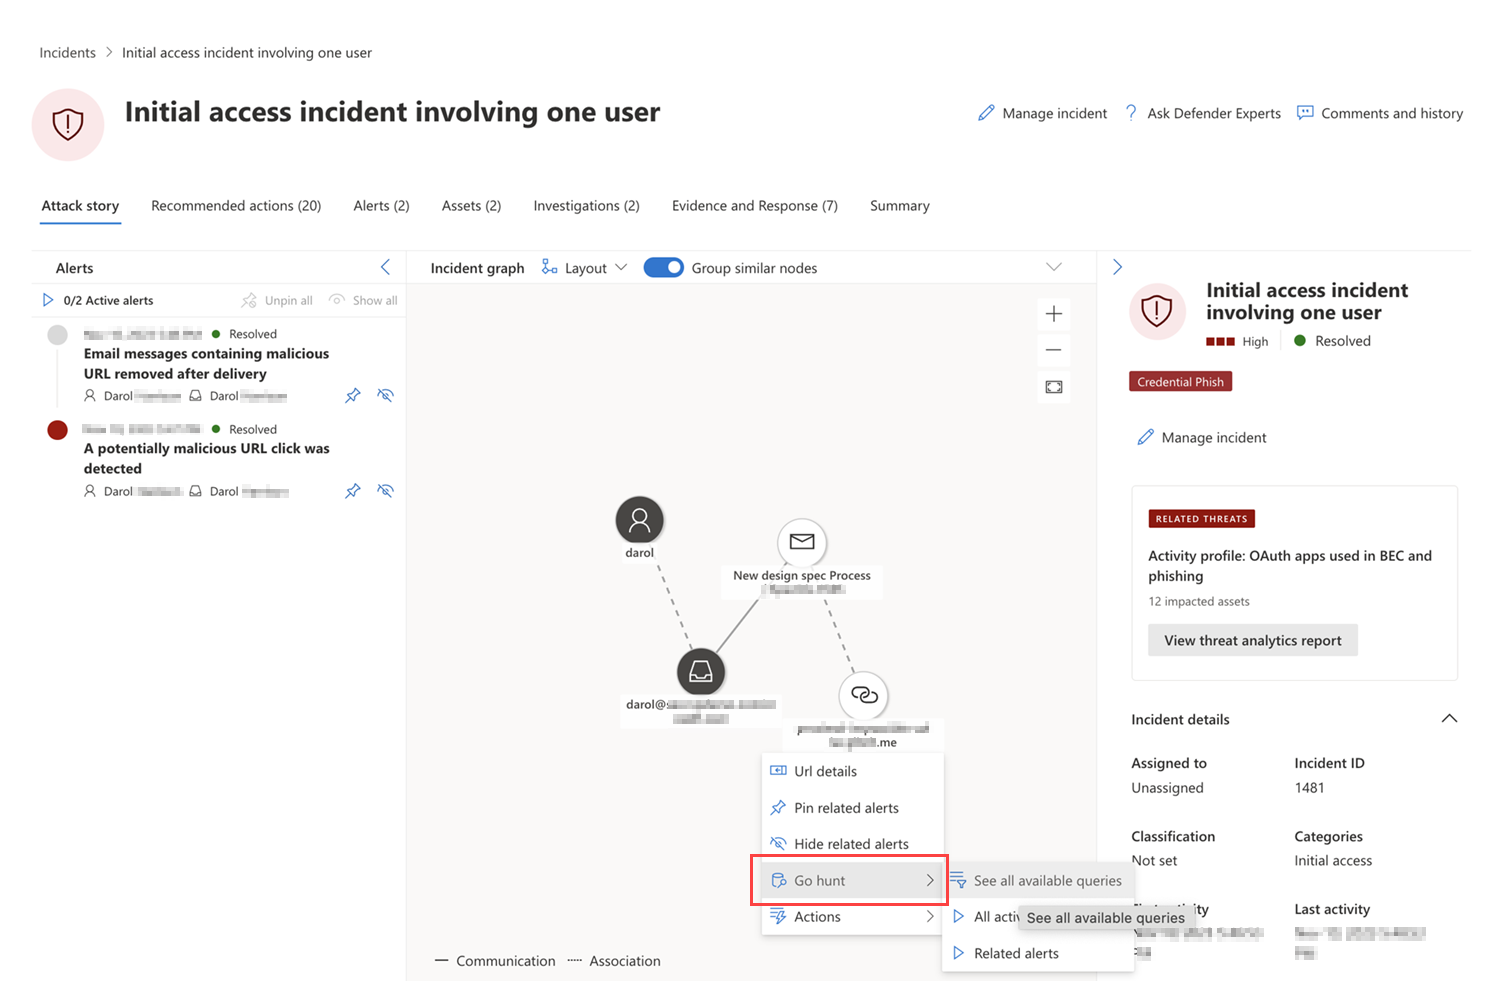
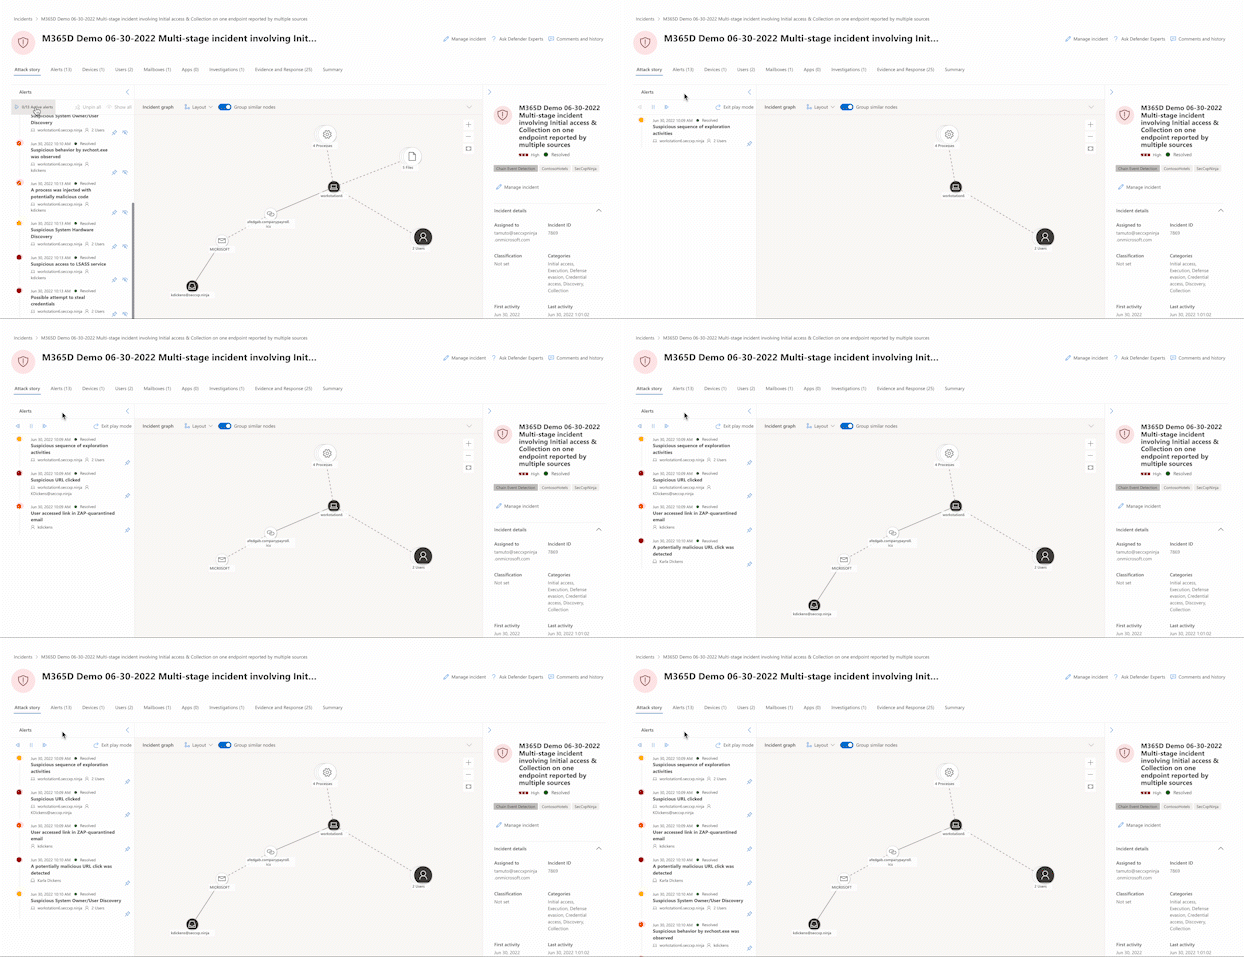
The graph shows the full scope of the attack, how the attack spread through your network over time, where it started, and how far the attacker went. It connects the different suspicious entities that are part of the attack with their related assets such as users, devices, and mailboxes.
From the graph, you can:
Play the alerts and the nodes on the graph as they occurred over time to understand the chronology of the attack.
Open an entity pane, allowing you to review the entity details and act on remediation actions, such as deleting a file or isolating a device.
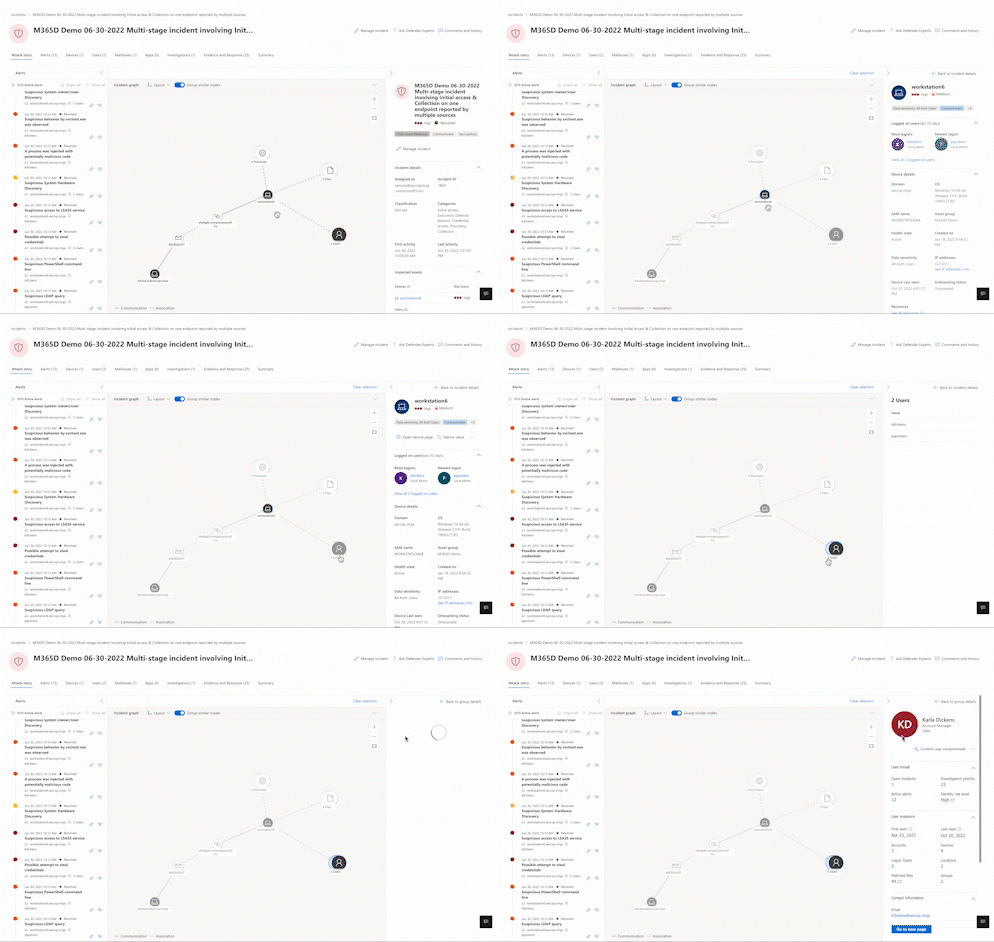
Highlight the alerts based on the entity to which they are related.
Hunt for entity information of a device, file, IP address, or URL.
The go hunt option takes advantage of the advanced hunting feature to find relevant information about an entity. The go hunt query checks relevant schema tables for any events or alerts involving the specific entity you're investigating. You can select any of the options to find relevant information about the entity:
- See all available queries – the option returns all available queries for the entity type you're investigating.
- All Activity – the query returns all activities associated with an entity, providing you with a comprehensive view of the incident's context.
- Related Alerts – the query searches for and returns all security alerts involving a specific entity, ensuring you don't miss any information.
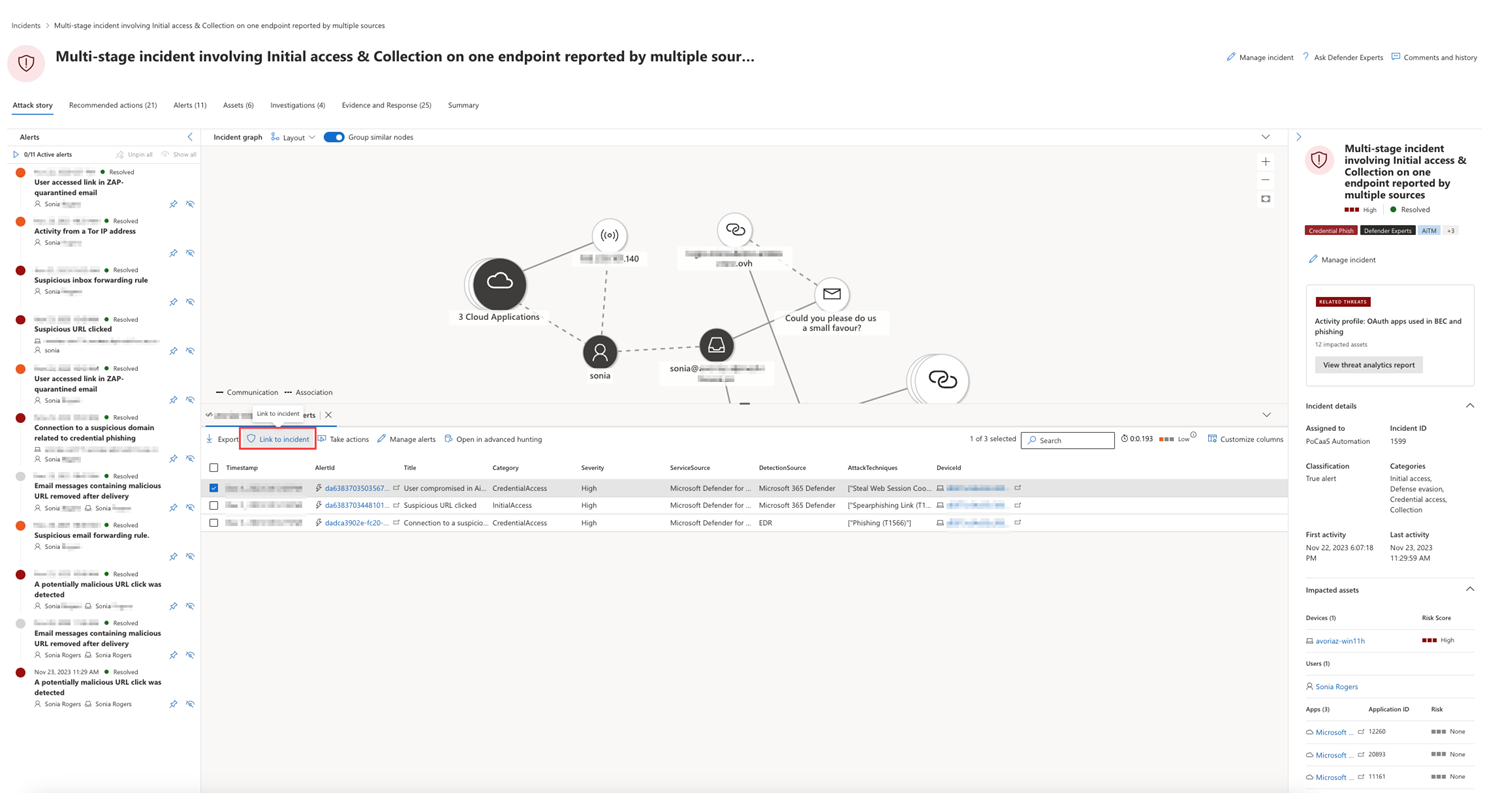
The resulting logs or alerts can be linked to an incident by selecting a results and then selecting Link to incident.
If the incident or related alerts were the result of an analytics rule you've set, you can also select Run query to see other related results.
Summary
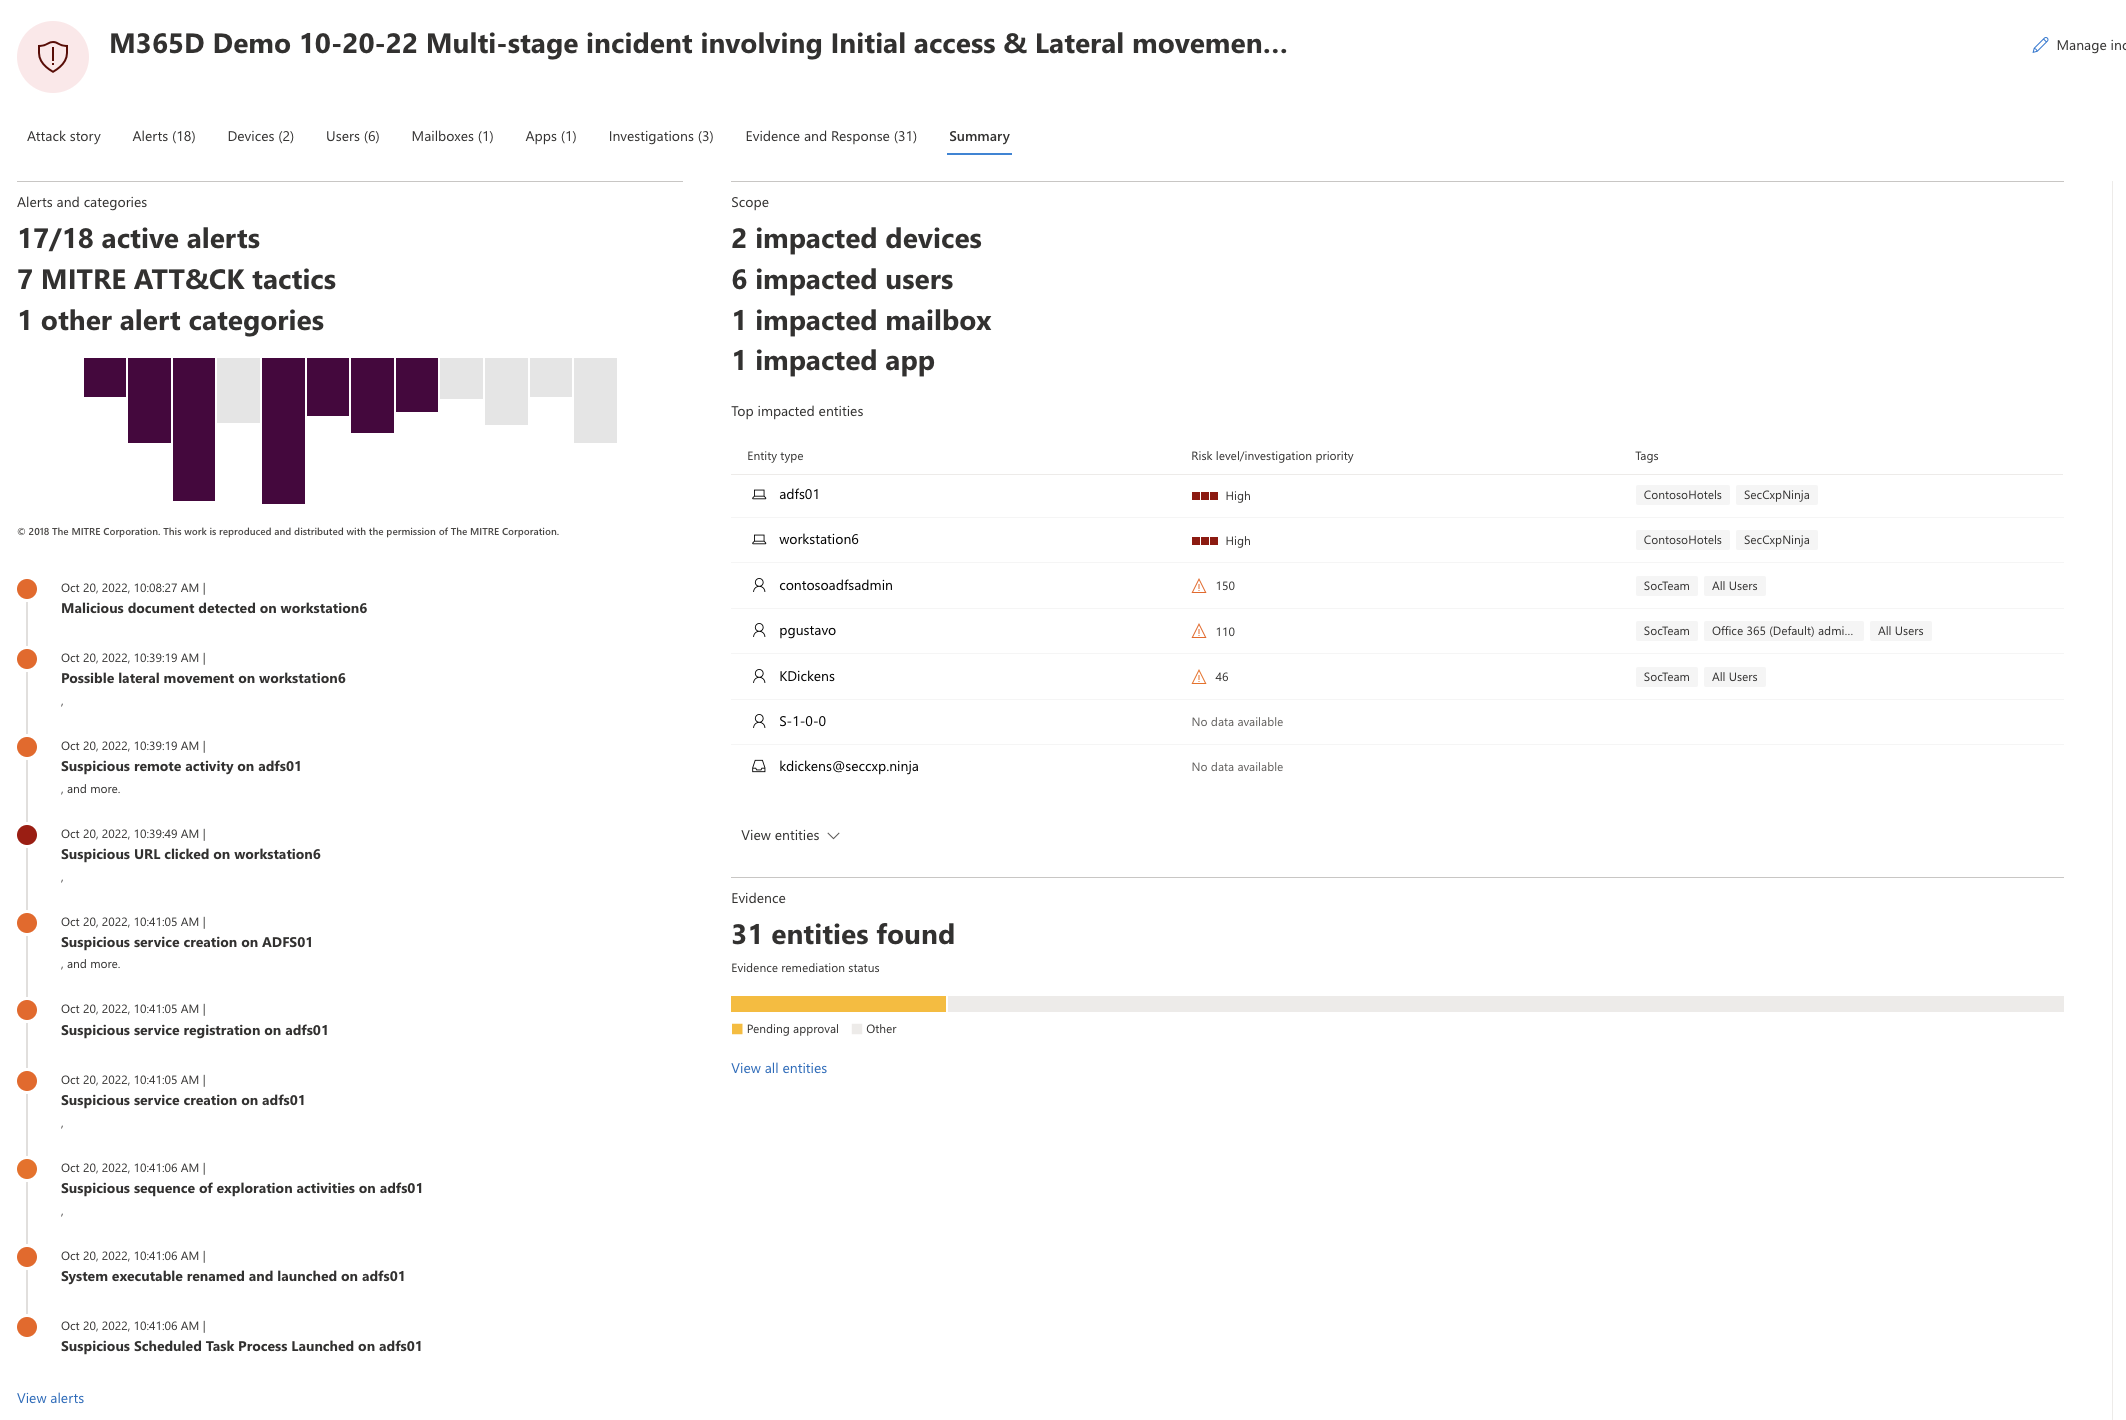
Use the Summary page to assess the relative importance of the incident and quickly access the associated alerts and impacted entities. The Summary page gives you a snapshot glance at the top things to notice about the incident.
Information is organized in these sections.
| Section | Description |
|---|---|
| Alerts and categories | A visual and numeric view of how advanced the attack has progressed against the kill chain. As with other Microsoft security products, Microsoft Defender XDR is aligned to the MITRE ATT&CK™ framework. The alerts timeline shows the chronological order in which the alerts occurred and for each, their status and name. |
| Scope | Displays the number of impacted devices, users, and mailboxes and lists the entities in order of risk level and investigation priority. |
| Evidence | Displays the number of entities affected by the incident. |
| Incident information | Displays the properties of the incident, such as tags, status, and severity. |
Alerts
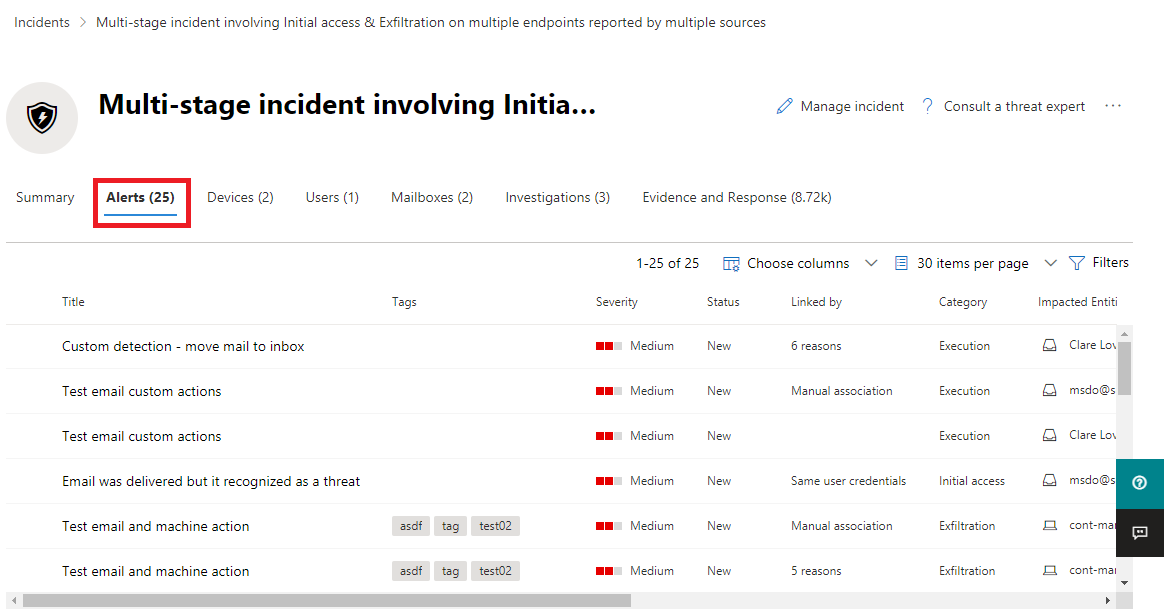
On the Alerts tab, you can view the alert queue for alerts related to the incident and other information about them such as:
- Severity.
- The entities that were involved in the alert.
- The source of the alerts (Microsoft Defender for Identity, Microsoft Defender for Endpoint, Microsoft Defender for Office 365, Defender for Cloud Apps, and the app governance add-on).
- The reason they were linked together.
Here's an example.
By default, the alerts are ordered chronologically to allow you to see how the attack played out over time. When you select an alert within an incident, Microsoft Defender XDR displays the alert information specific to the context of the overall incident.
You can see the events of the alert, which other triggered alerts caused the current alert, and all the affected entities and activities involved in the attack, including devices, files, users, and mailboxes.
Here's an example.
Learn how to use the alert queue and alert pages in investigate alerts.
Assets
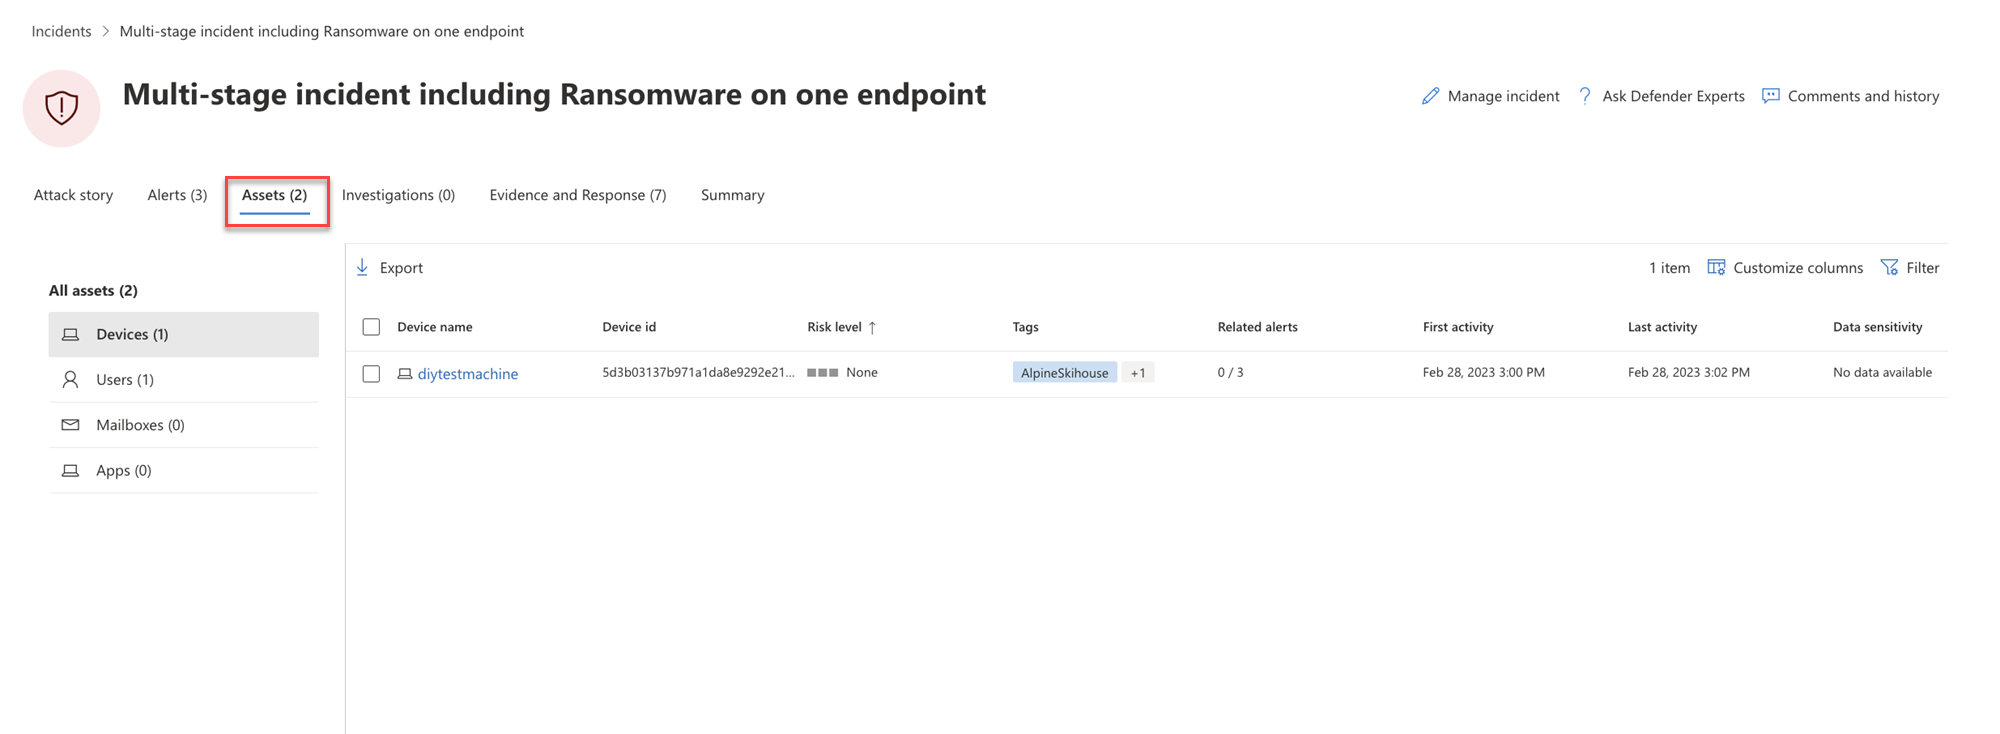
Easily view and manage all your assets in one place with the new Assets tab. This unified view includes Devices, Users, Mailboxes and Apps.
The Assets tab displays the total number of assets beside its name. A list of different categories with the number of assets within that category is presented when selecting the Assets tab.
Devices
The Devices view lists all the devices related to the incident. Here's an example.
Selecting a device from the list opens a bar that allows you to manage the selected device. You can quickly export, manage tags, initiate automated investigation, and more.
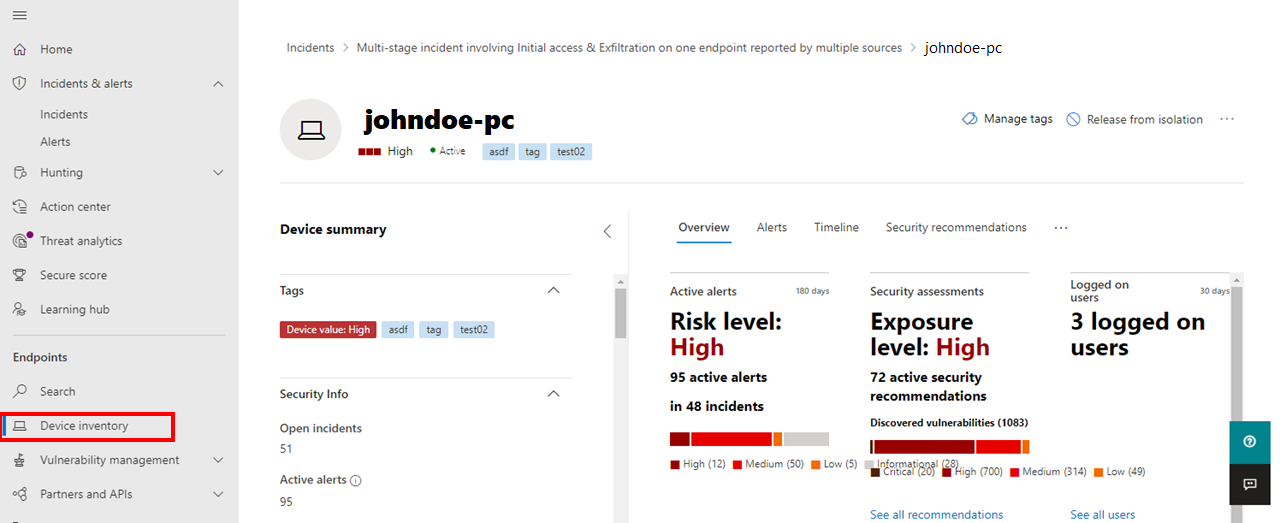
You can select the check mark for a device to see details of the device, directory data, active alerts, and logged on users. Select the name of the device to see device details in the Defender for Endpoint device inventory. Here's an example.
From the device page, you can gather additional information about the device, such as all of its alerts, a timeline, and security recommendations. For example, from the Timeline tab, you can scroll through the device timeline and view all events and behaviors observed on the machine in chronological order, interspersed with the alerts raised. Here's an example
Tip
You can do on-demand scans on a device page. In the Microsoft Defender portal, choose Endpoints > Device inventory. Select a device that has alerts, and then run an antivirus scan. Actions, such as antivirus scans, are tracked and are visible on the Device inventory page. To learn more, see Run Microsoft Defender Antivirus scan on devices.
Users
The Users view lists all the users that have been identified to be part of or related to the incident. Here's an example.
You can select the check mark for a user to see details of the user account threat, exposure, and contact information. Select the user name to see additional user account details.
Learn how to view additional user information and manage the users of an incident in investigate users.
Mailboxes
The Mailboxes view lists all the mailboxes that have been identified to be part of or related to the incident. Here's an example.
You can select the check mark for a mailbox to see a list of active alerts. Select the mailbox name to see additional mailbox details on the Explorer page for Defender for Office 365.
Apps
The Apps view lists all the apps identified to be part of or related to the incident. Here's an example.
You can select the check mark for an app to see a list of active alerts. Select the app name to see additional details on the Explorer page for Defender for Cloud Apps.
Investigations
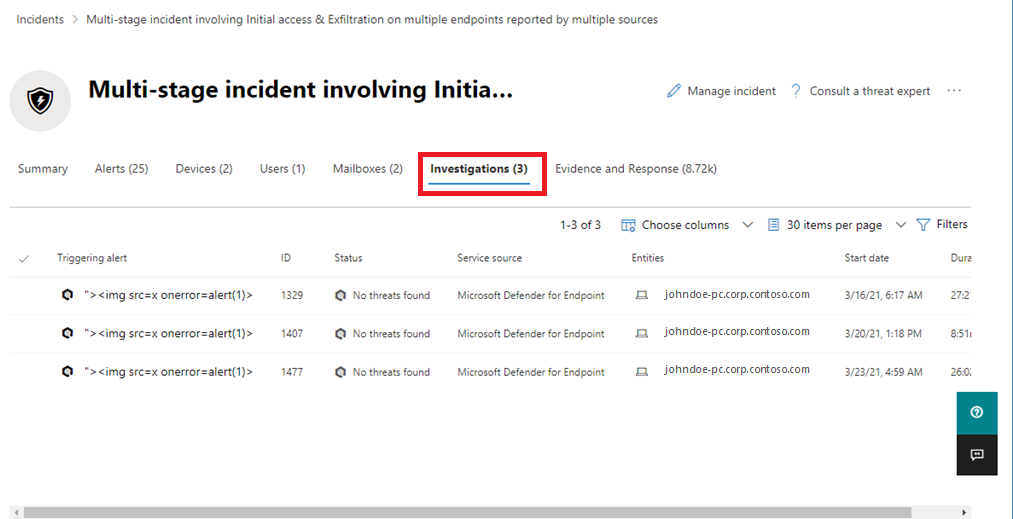
The Investigations tab lists all the automated investigations triggered by alerts in this incident. Automated investigations will perform remediation actions or wait for analyst approval of actions, depending on how you configured your automated investigations to run in Defender for Endpoint and Defender for Office 365.
Select an investigation to navigate to its details page for full information on the investigation and remediation status. If there are any actions pending for approval as part of the investigation, they will appear in the Pending actions history tab. Take action as part of incident remediation.
There is also an Investigation graph tab that shows:
- The connection of alerts to the impacted assets in your organization.
- Which entities are related to which alerts and how they are part of the story of the attack.
- The alerts for the incident.
The investigation graph helps you quickly understand the full scope of the attack by connecting the different suspicious entities that are part of the attack with their related assets such as users, devices, and mailboxes.
For more information, see Automated investigation and response in Microsoft Defender XDR.
Evidence and Response
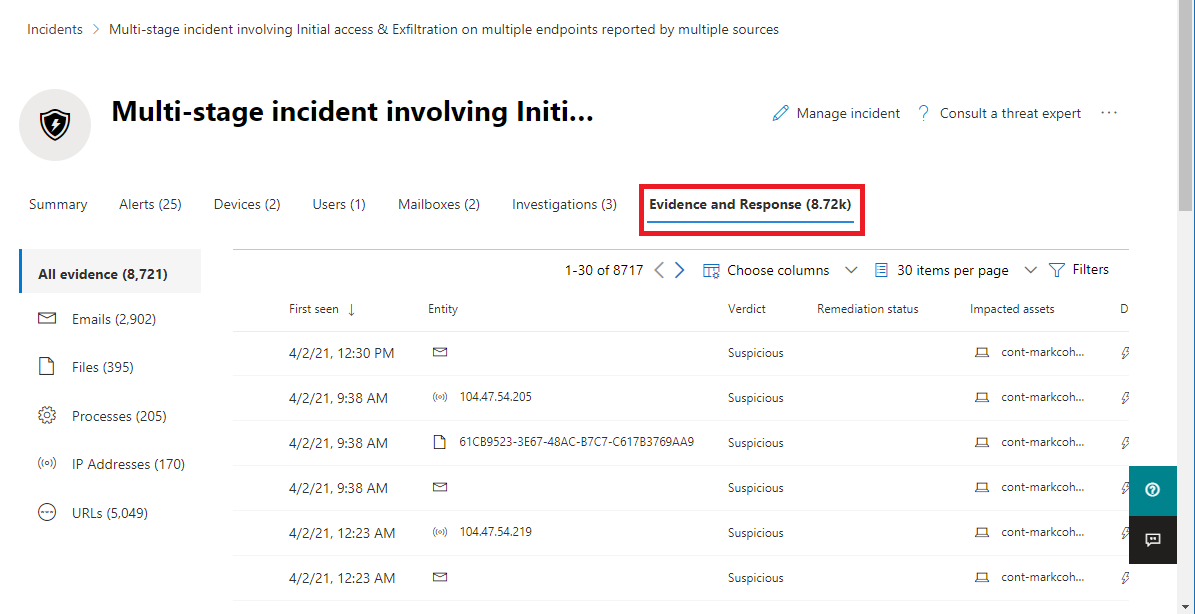
The Evidence and Response tab shows all the supported events and suspicious entities in the alerts in the incident. Here's an example.
Microsoft Defender XDR automatically investigates all the incidents' supported events and suspicious entities in the alerts, providing you with information about the important emails, files, processes, services, IP Addresses, and more. This helps you quickly detect and block potential threats in the incident.
Each of the analyzed entities is marked with a verdict (Malicious, Suspicious, Clean) and a remediation status. This helps you understand the remediation status of the entire incident and what next steps can be taken.
Approve or reject remediation actions
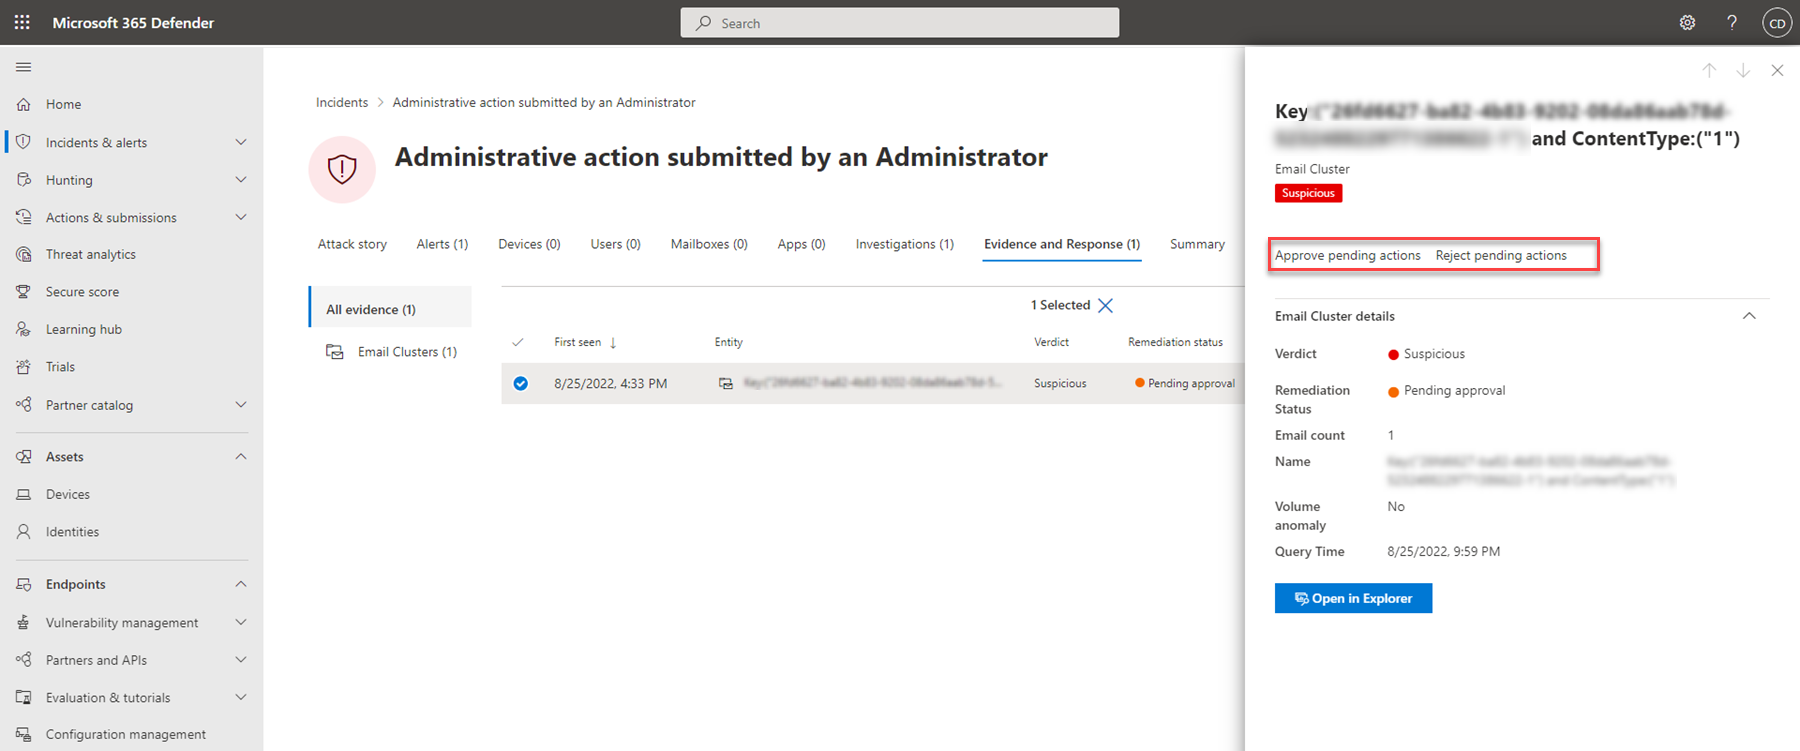
For incidents with a remediation status of Pending approval, you can approve or reject a remediation action from within the incident.
- In the navigation pane, go to Incidents & alerts > Incidents.
- Filter on Pending action for the Automated investigation state (optional).
- Select an incident name to open its summary page.
- Select the Evidence and Response tab.
- Select an item in the list to open its flyout pane.
- Review the information, and then take one of the following steps:
- Select the Approve pending action option to initiate a pending action.
- Select the Reject pending action option to prevent a pending action from being taken.
Next steps
As needed:
See also
Tip
Do you want to learn more? Engage with the Microsoft Security community in our Tech Community: Microsoft Defender XDR Tech Community.

