Examine your network diagram
Your network diagram allows you to determine the devices and subnets to monitor based on your overall monitoring goals for your automotive manufacturing organization.
Using the diagram you can determine:
- The network segments you should monitor (subnets/VLANs)
- What devices there are and how they communicate
- The security and operational risks and the most interesting traffic for those risks
- Where to connect your sensors
Using your existing network map diagram, use the following questions to help you identify and take note of what you want to monitor.
General questions
- What are your overall monitoring goals?
- Do you have any redundant networks or areas that can be disregarded for monitoring?
- Where are your network security and operational risks?
Network questions
- Which protocols are active on monitored networks?
- Are VLANs configured in the network design?
- Is there any routing in the monitored networks?
- Is there any serial communication in the network?
- Where are firewalls installed in the networks you want to monitor?
- Is there traffic between an industrial control (ICS) network and an enterprise, business network? If so, is this traffic monitored?
- What's the physical distance between your switches and the enterprise firewall?
- Is OT system maintenance done with fixed or transient devices?
Switch questions
- Can you monitor the traffic from an unmanaged switch from a higher-level switch?
- Can unmanaged switches be replaced with managed switches, or is the use of network TAPs an option?
- Can you monitor the switch's VLAN, or is the VLAN visible in another switch that you can monitor?
- If you connect a network sensor to the switch, does it mirror the communication between the HMI and PLCs?
- If you want to connect a network sensor to the switch, is there physical rack space available in the switch's cabinet?
- What's the cost/benefit of monitoring each switch?
Purdue networking model
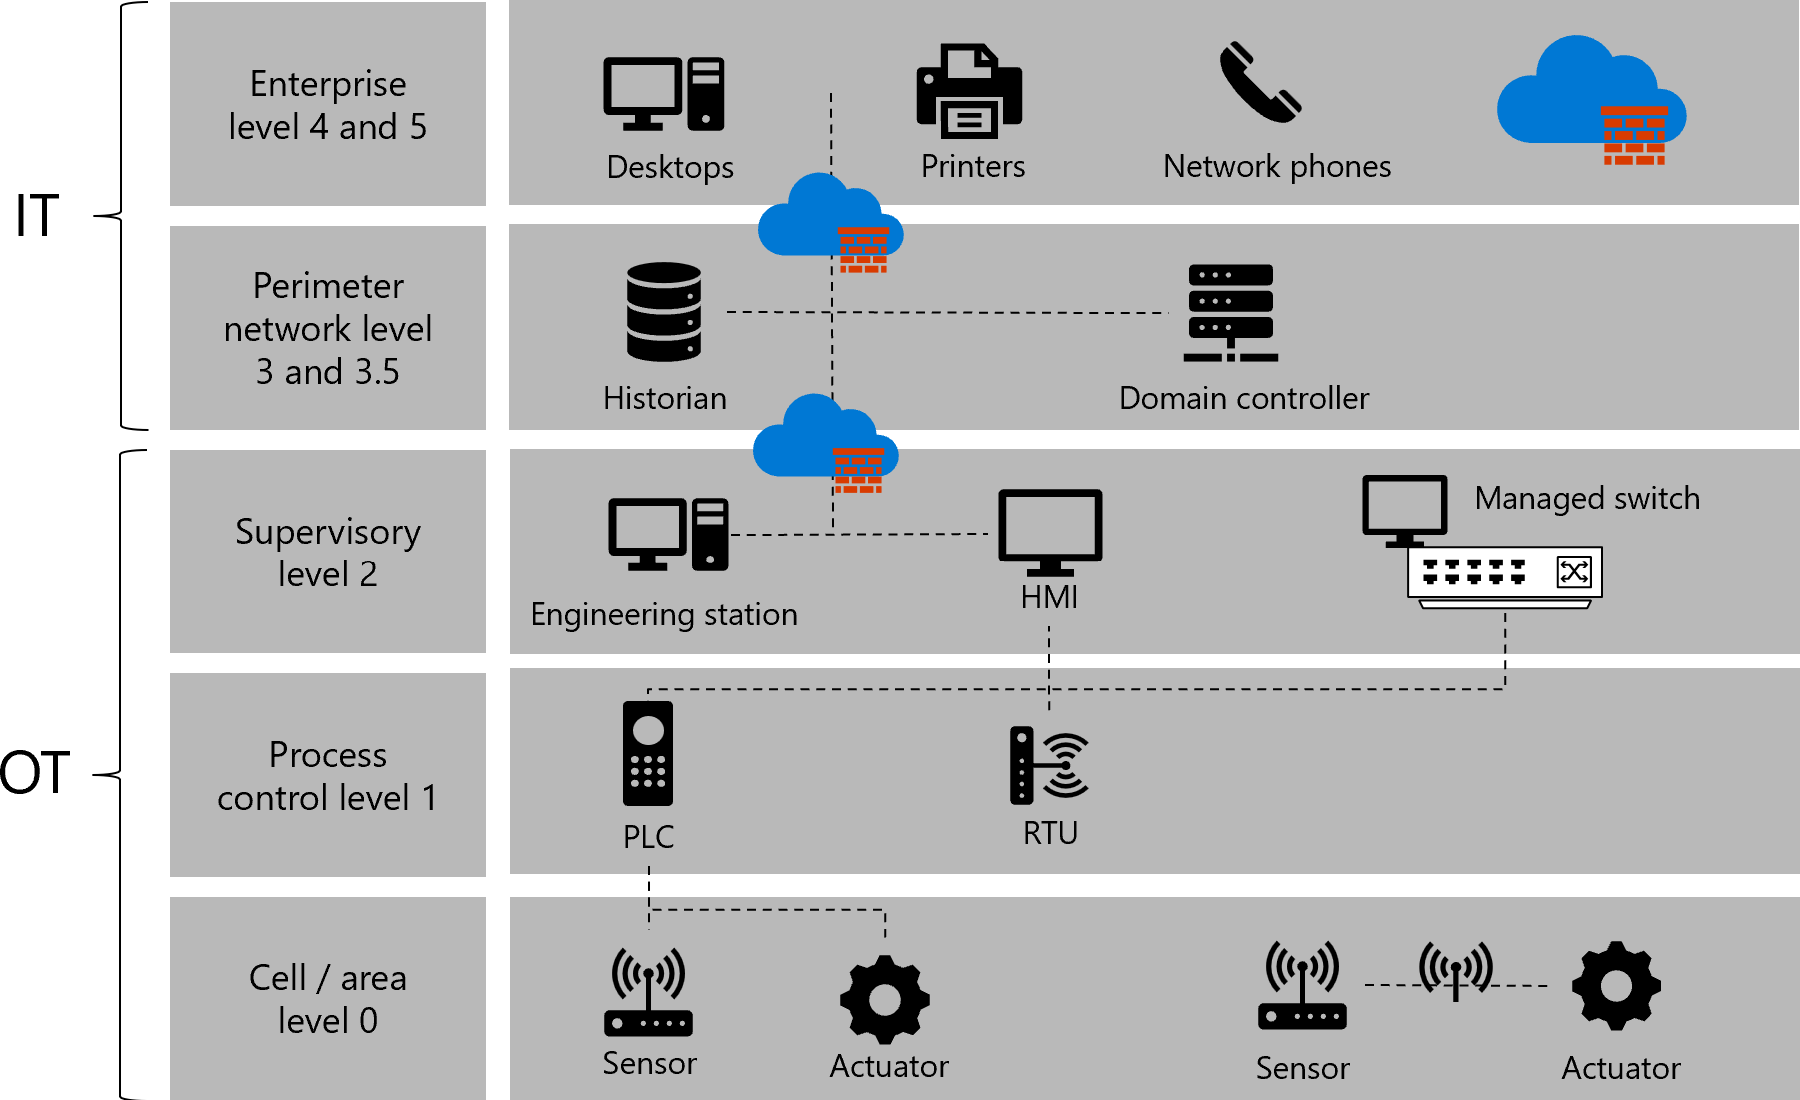
Each device in your network falls within a layer of the Purdue reference model. The Purdue Reference Model for Industrial Control System (ICS)/OT network segmentation divides a network into different OT and IT layers to better isolate IT and OT systems and enhance OT system protection. Levels one through three are OT levels and four and five are IT levels. The levels are as follows:
| Name | Description |
|---|---|
| Level 0: Cell and area | The wide variety of sensors, actuators, and devices involved in the basic manufacturing process. These devices perform the basic functions of the industrial automation and control system, like driving a motor or key functions like welding and bending. |
| Level 1: Process control | Embedded controllers that communicate with Level 0 devices and control and manipulate the manufacturing process. In discrete manufacturing, those devices are programmable logic controllers (PLCs) or remote telemetry units (RTUs). In process manufacturing, the basic controller is called a distributed control system (DCS). |
| Level 2: Supervisory | Includes the systems and functions connected to the runtime supervision and operation of an area of a production facility. Those systems communicate with the Level 1 controllers, and sometimes with the site or enterprise (Level four and five). The systems and functions can include human-machine interfaces (HMIs), alerting systems, and control room workstations, among other systems. |
| Levels 3 and 3.5: Site-level and industrial perimeter network | Manages the site-wide industrial automation and control functions like production scheduling, site level operations management, file server, and Active Directory. These systems communicate with the production zone and share data with Level four and five systems and applications. Levels through level 3 are considered critical to site operations. |
| Levels 4 and 5: Business and enterprise networks | The site or enterprise network where the centralized IT systems and functions exist. The IT organization manages them directly at these levels. |
Generally, Defenders for IoT sensors are placed between levels two and three or between three and 3.5, if it's an industrial perimeter network (also known as a demilitarized zone (DMZ)).
Sample network diagram
The following diagram depicts how your devices might be divided into the different OT and IT levels:
Knowledge check
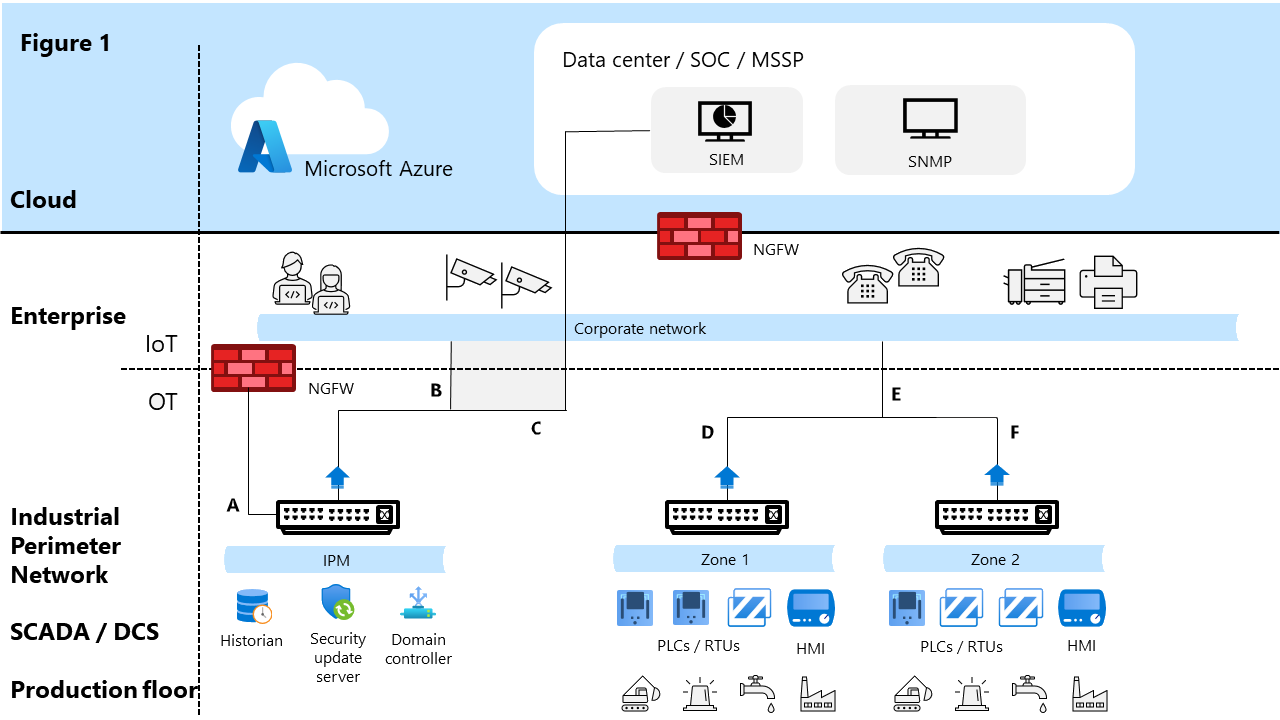
Figure 1 shows a sample network diagram divided into Cloud, Enterprise (IoT), and OT areas. The cloud area includes Microsoft Azure and a data center/SOC/MSSP area and is separated from the Enterprise area with a firewall. The Enterprise/IoT area includes the corporate network and is set off from the OT area by a firewall. In the OT area are three defined areas spanning the production floor, SCADA/DCS, and industrial perimeter network. The first is labeled IPN and includes Historian, Security update server, and Domain controller on the SCADA/DCS level and a switch on the industrial perimeter network (IPN) level. The other two areas are labeled Zone one and Zone two, respectively and include production floor resources, PLCs / RTUs and HMIs on the SCADA/DCS level, and a switch each on the IPN level. Each switch has an arrow pointing upward. The IPN area has a line leading up to the firewall (labeled "A"). It additionally has a line leading from the arrow to the corporate network (labeled "B"), and to the Data center area (labeled "C"). Zone one and Zone two each have lines leading up from their zones (labeled "D" and "F" respectively) that connect together and then lead up to the corporate network (labeled "E").