Describe critical performance metrics
You have seen about how to collect data in both Azure Monitor and Windows Performance Monitor. You will now learn how to create metrics in Azure Monitor, which allow you to trigger alerts or execute automated error responses.
Review of Azure metrics
The Azure Monitor service includes the ability to track various metrics about the overall health of a given resource. Metrics are gathered at regular intervals and are the gateway for alerting processes that will help to resolve issues quickly and efficiently. Azure Monitor Metrics is a powerful subsystem that allows you to not only analyze and visualize your performance data, but to also trigger alerts that notify administrators or automated actions that can trigger an Azure Automation runbook or a webhook. You also have the option to archive your Azure Metrics data to Azure Storage, since active data is only stored for 93 days.
Create metric alerts
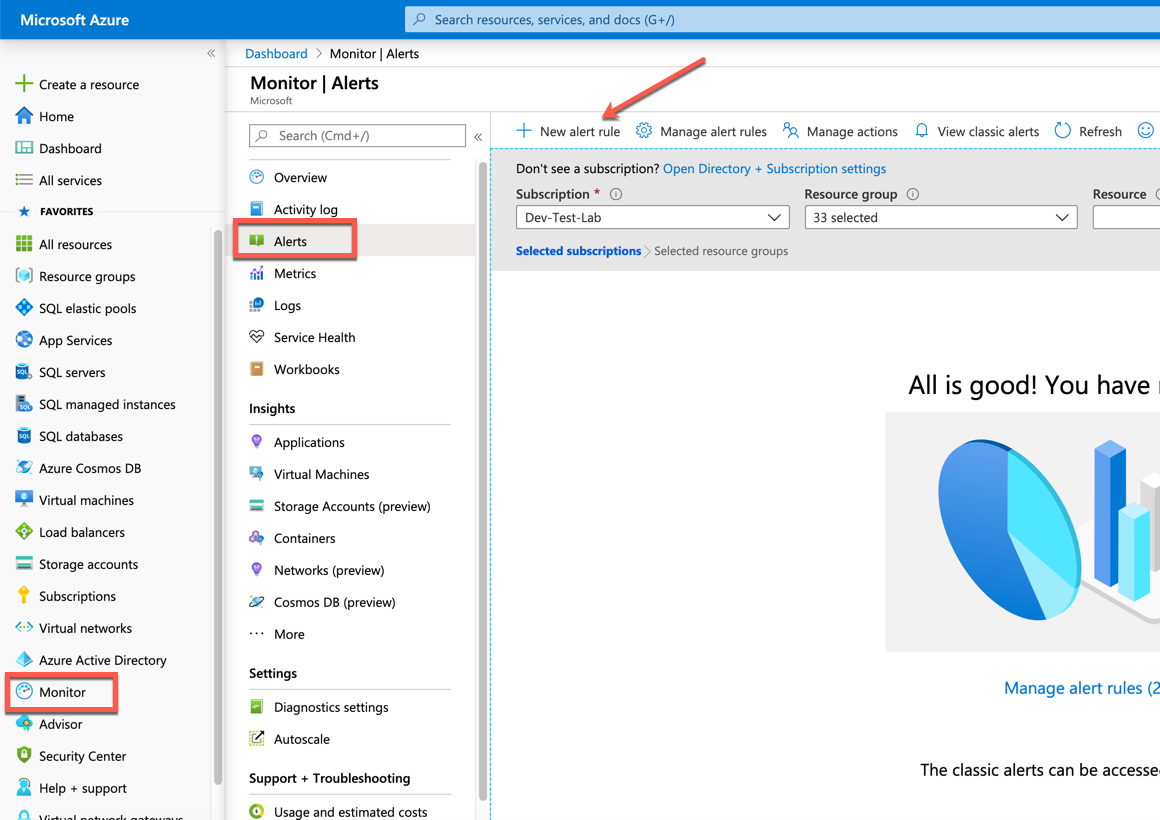
Utilizing the Azure portal, you can create alert rules, based on defined metrics, in the overview section of the Azure Monitor blade. Azure Monitor Alerts can be scoped in three ways. For example, using Azure Virtual Machines as an example you can specify the scope as:
A list of virtual machines in one Azure region within a subscription
All virtual machines (in one Azure region) in one or more resource groups in a subscription
All virtual machines (in one Azure region) in one subscription
In this manner, you can create an alert rule based on resources contained within resource groups as shown.
The example shown below reflects a virtual machine named SQL2019 on which we are creating an alert that is at the scope of the individual virtual machine.
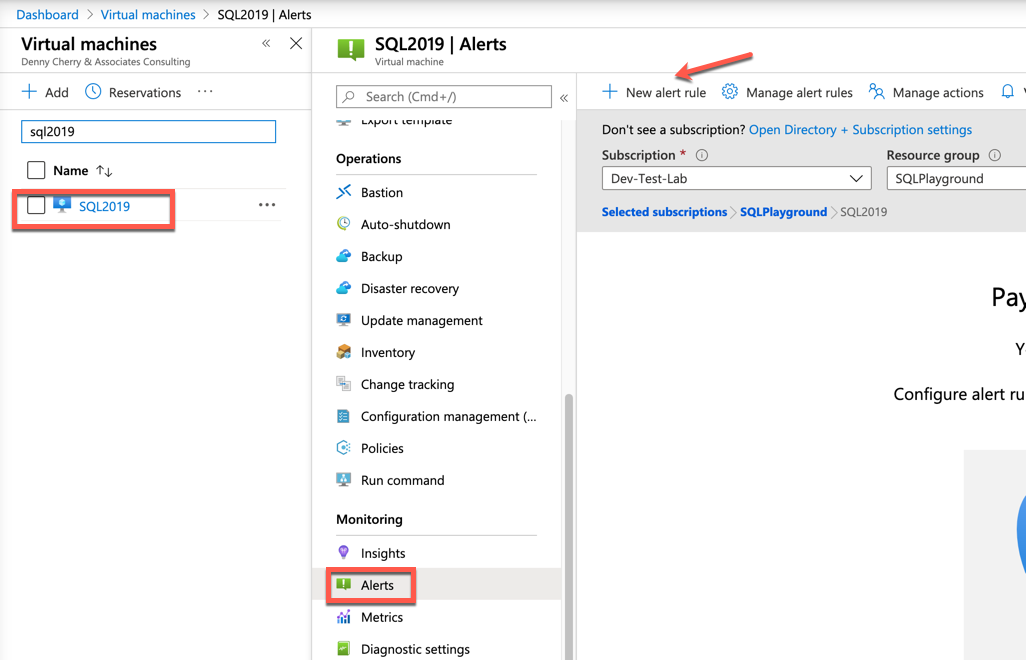
Regardless the scope of the alert, the creation process is the same.
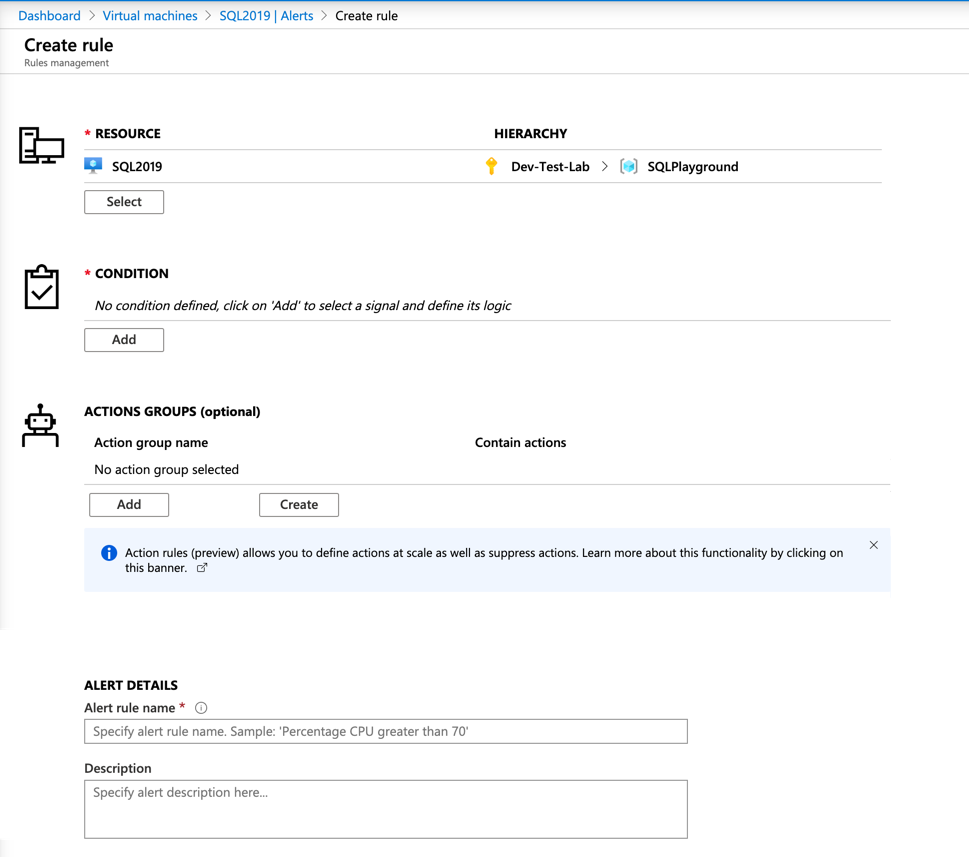
From the alerts screen, click on New Alert Rule. If an alert is created from within the scope of a resource, the resource values should be populated for you. You can see that the resource is the SQL2019 virtual machine, the subscription is Dev-Test-Lab and the resource group in which it resides is SQLPlayground.
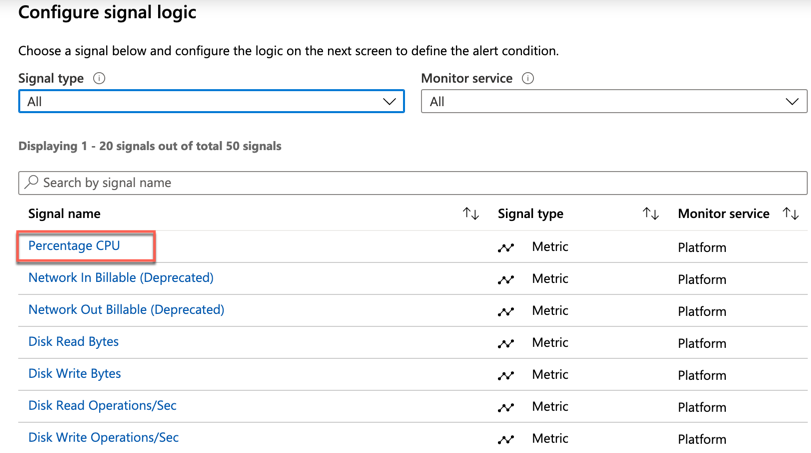
Under the Condition section, click Add:
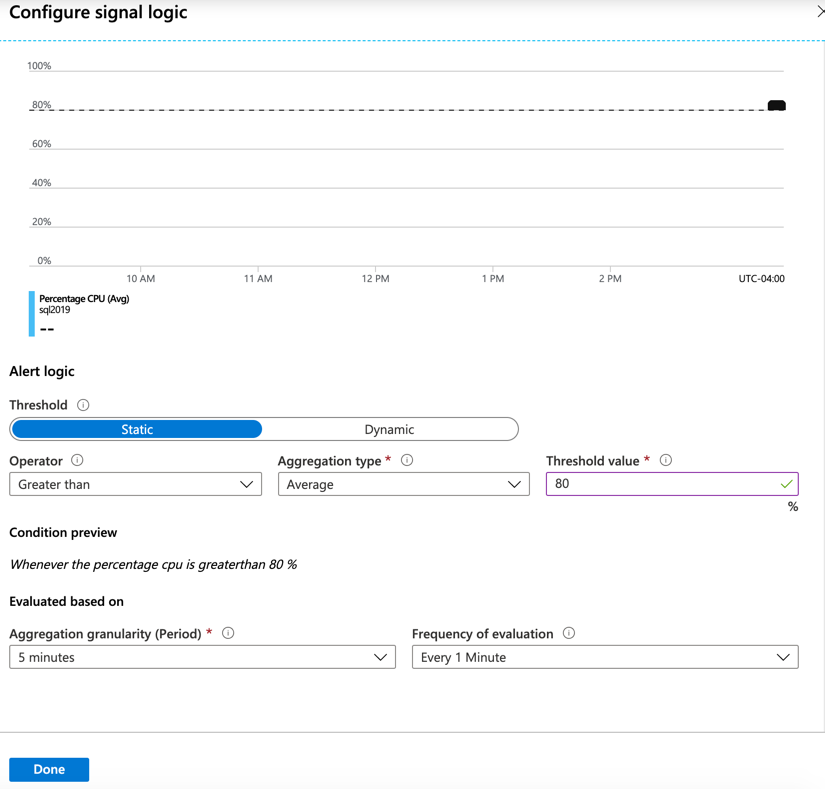
Select the metric that you wish to alert on. The following image shows Percentage CPU, which you will then see selected.
The alerts can be configured in a static manner (for example, raise an alert when CPU goes over 95%) or in a dynamic fashion using Dynamic Thresholds. Dynamic Thresholds learn the historical behavior of the metric and raise an alert when the resources are operating in an abnormal manner. These Dynamic Thresholds can detect seasonality in your workloads and adjust the alerting accordingly.
If Static alerts are used, you must provide a threshold for the selected metric. In this example, 80 percent was specified. This threshold means that if the CPU utilization exceeds 80 percentage over a given period, an alert will be fired and react as specified.
Both types of alerts offer Booleans operators such as the 'greater than' or 'less than' operators. Along with Boolean operators, there are aggregate measurements to select from such as average, minimum, maximum, count, average, and total. With these options available, it’s easy to construct a flexible alert that will suit just about any enterprise level alerting.
After creating the alert, in order to notify administrators or launch an automation process, an action group needs to be configured.
Note
Defining an action group is optional, and if one is not configured the alert will just log the notification to storage with no further action is taken. You can create a new action group from the metrics screen, by clicking Add next to Action Groups. You will then see this dialog:
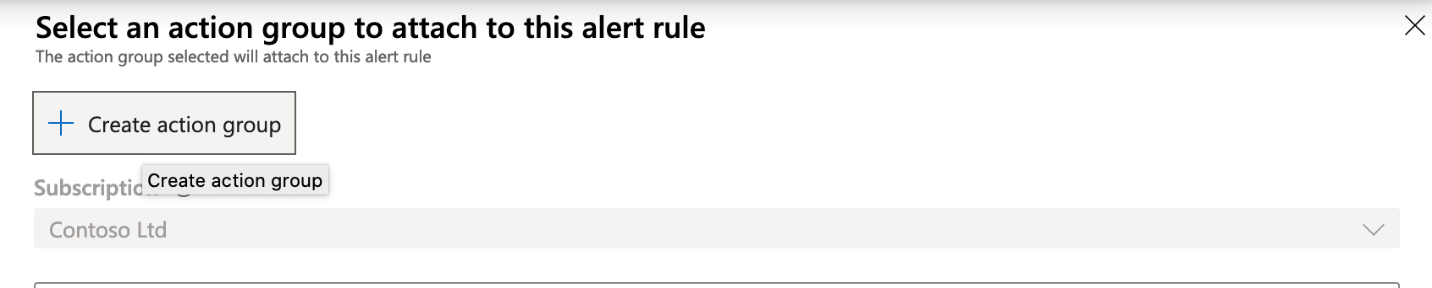
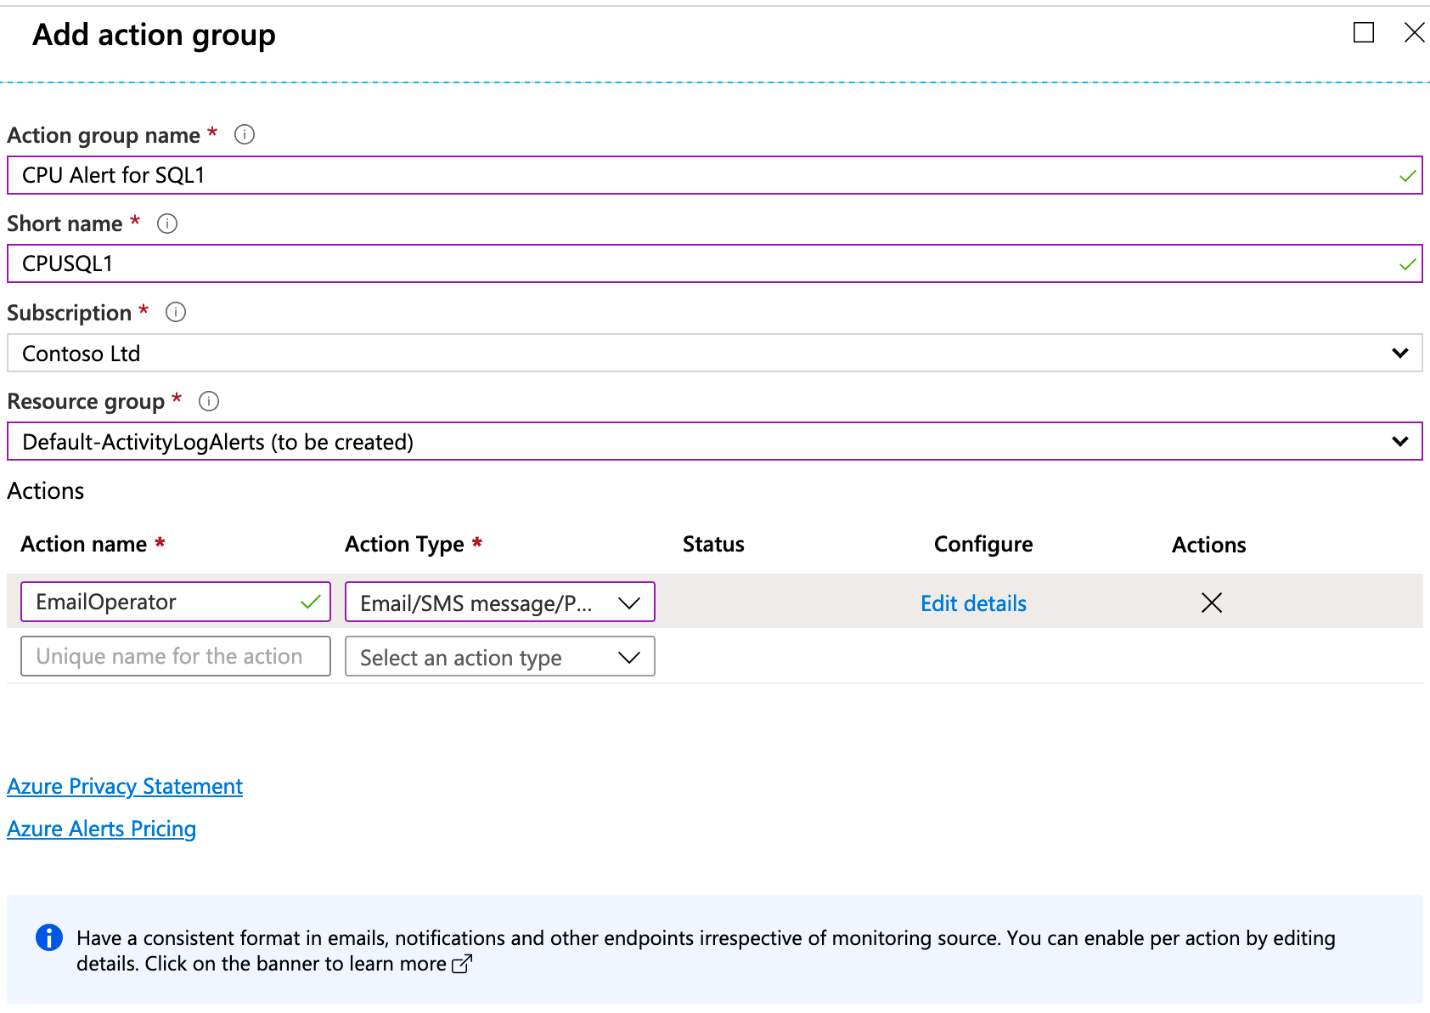
Once you click Create Action group, you will see the screen shown below. You will name the action group and define an alert and the response. In this example, the administrator is going to be emailed in the event of the alert’s condition being triggered.
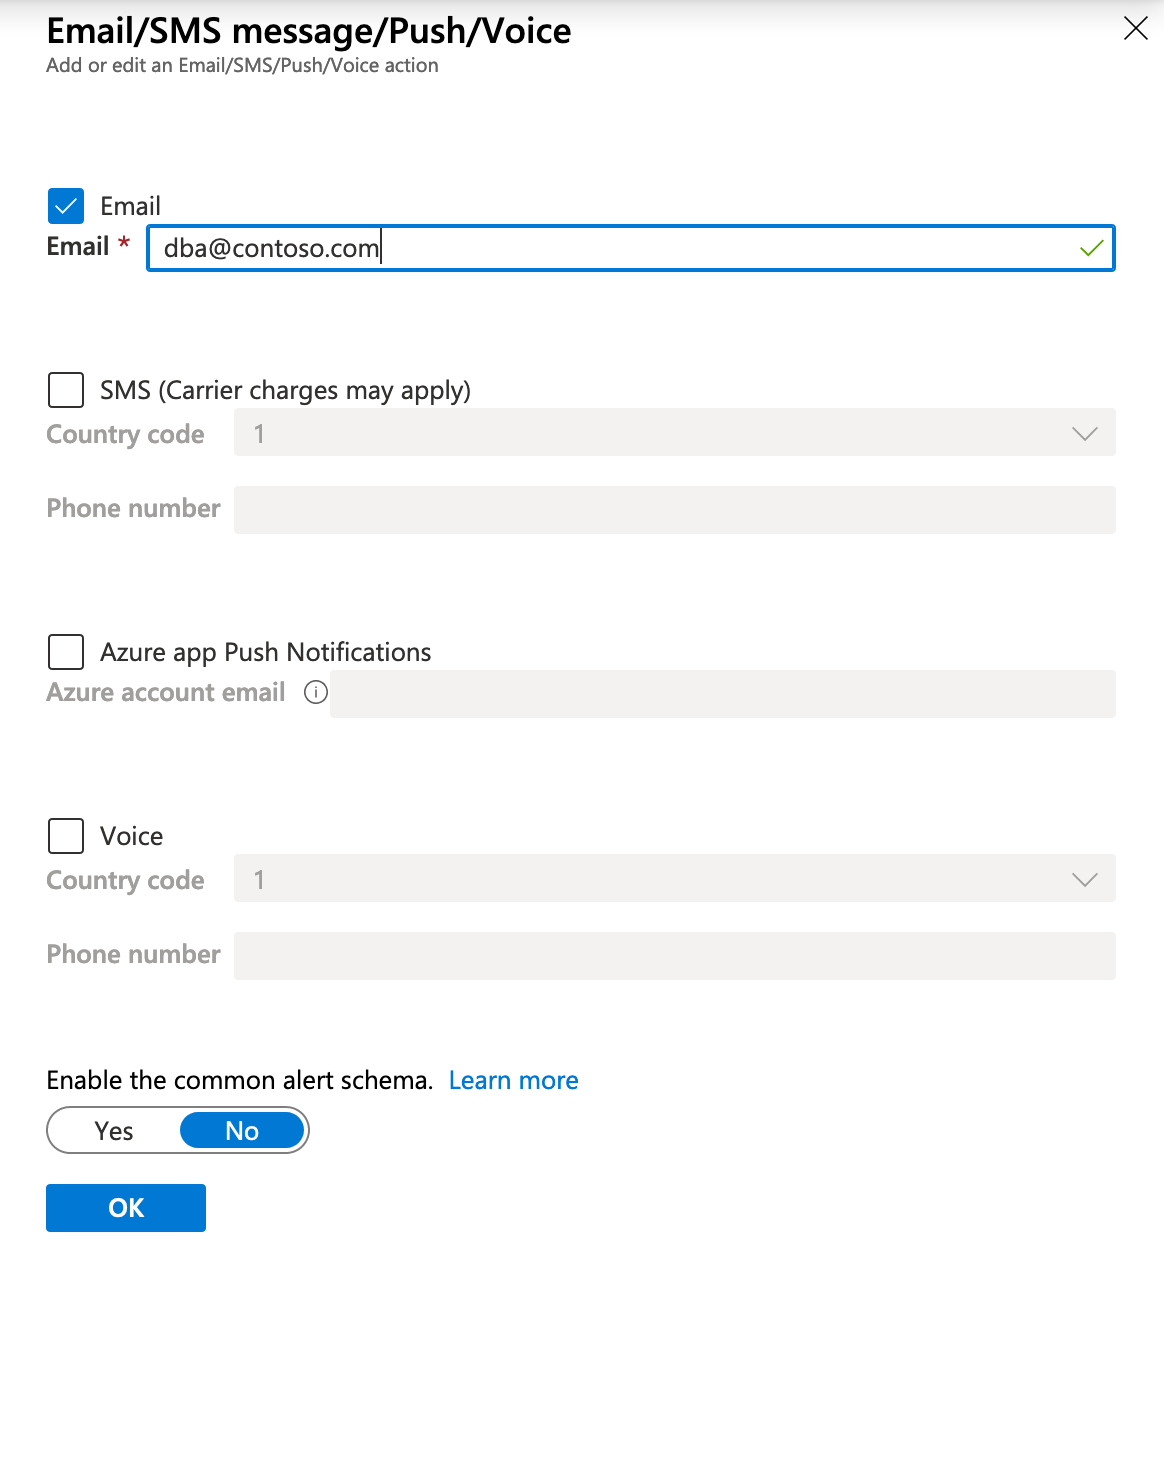
You can configure the email or SMS details as can be seen below. You can reach this screen either by clicking Edit Details under Configure, or by adding a new action, which will also bring up the configuration screen.
With an action group, there are several ways in which you can respond to the alert. The following options are available for defining the action to take:
- Automation Runbook
- Azure Function
- Email Azure Resource Manager Role
- Email/SMS/Push/Voice
- ITSM
- Azure Logic App
- Secure Webhook
- Webhook
There are two categories to these actions—notification, which means notifying an administrator or group of administrators of an event, and automation, which is taking a defined action to respond to a performance condition.
Review older performance data
One of the benefits of utilizing the Azure Monitor is the ability to easily and quickly review past metrics that were gathered. If you examine a resource, you’ll note a datetime picker in the upper right-hand corner. Azure Monitor Metrics will be retained for 93 days, after which they are purged, however you do have the option to archive them to Azure Storage.
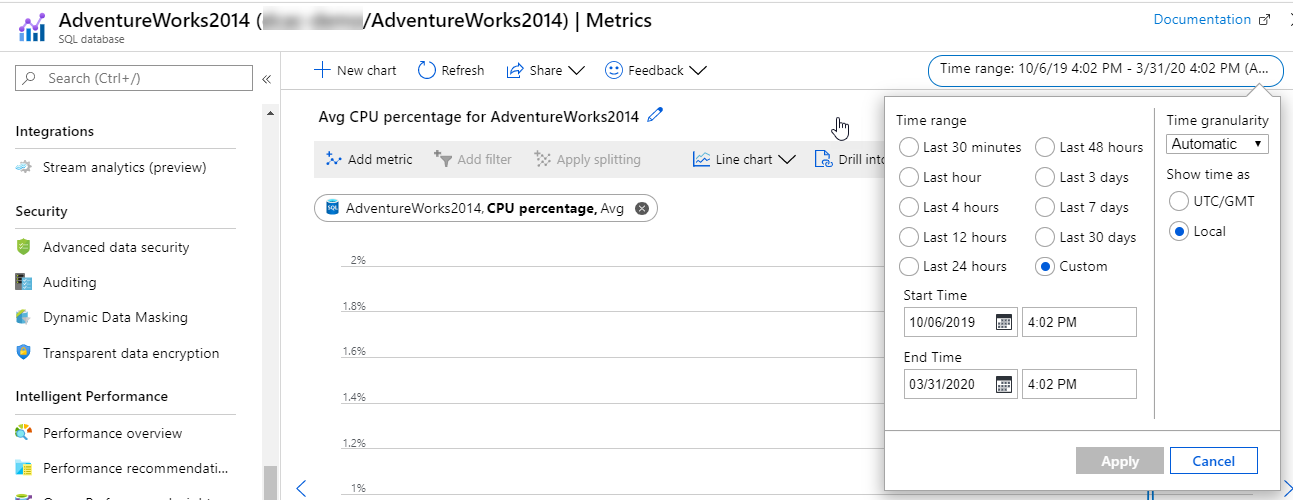
You are also able to select a smaller window of time such as the last 30 minutes, last hour, last 4 hours, or last 12 hours as an example. The flexibility of Azure monitor allows administrators to quickly identify issues as well as to potentially diagnose past issues.
SQL Server metrics that matter
Microsoft SQL Server is a well instrumented piece of software that collects a great deal of performance metadata. The database engine has metrics that can be monitored to help identify and improve performance-related issues. Some operating system metrics are only viewable from within performance monitor while others can be accessed through T-SQL queries, in particular, by selecting from the dynamic management views (DMVs). There are some metrics that are exposed in both locations so knowing where to identify specific metrics is important. One example of data that can only be captured from DMVs is data and transaction log file read/write latency as exposed in sys.dm_os_volume_stats. On the other hand, an example of an OS metric that is not available directly through SQL Server is the seconds per disk read and write for the disk volume. Combining these two metrics can help you gain better understand if a performance issue is related to database structure or a physical storage bottleneck.