Describe Azure SQL Insights
One of the benefits of using any of the products part of the Azure SQL family is the monitoring capability that is built into Azure platform. Beyond the simple Azure Monitor data collection, SQL Insights is a component that allows you to analyze your queries, and tune performance.
With SQL Insights' interactive features, you can customize telemetry collection and frequency, and combine data from multiple sources into a single monitoring experience.
How SQL Insights works
SQL Insights collects data remotely from dynamic management views, and it's built on top of the Azure Monitor platform, giving customers access to the native alerting and out-of-the-box visualizations. It also retains a set of metrics over time, which allows you to investigate performance issues that you may have encountered in the past.
To get started with SQL Insights, you need a dedicated virtual machine that will monitor and remotely collect data from your SQL servers. This dedicated virtual machine needs to have the following components installed:
- Azure Monitor agent
- Workload Insights extension
In order to increase control over charges, customers can also choose which telemetry data to collect, the frequency, and manage retention policy parameters. Database activity and the settings that you've set in your monitoring profiles will determine the amount of data being collected, and the exact cost.
Lastly, you can access performance data from the SQL Insights workbook template, or directly from the monitoring logs.
SQL Insights in Azure Monitor
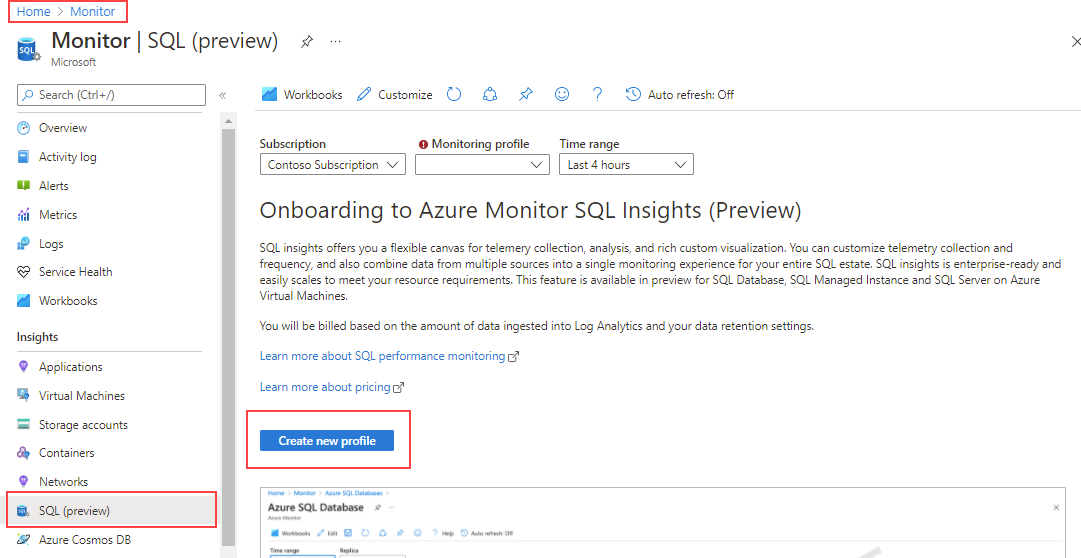
To get started with SQL Insights, from the Monitor blade, select SQL (preview), and then Create new profile.
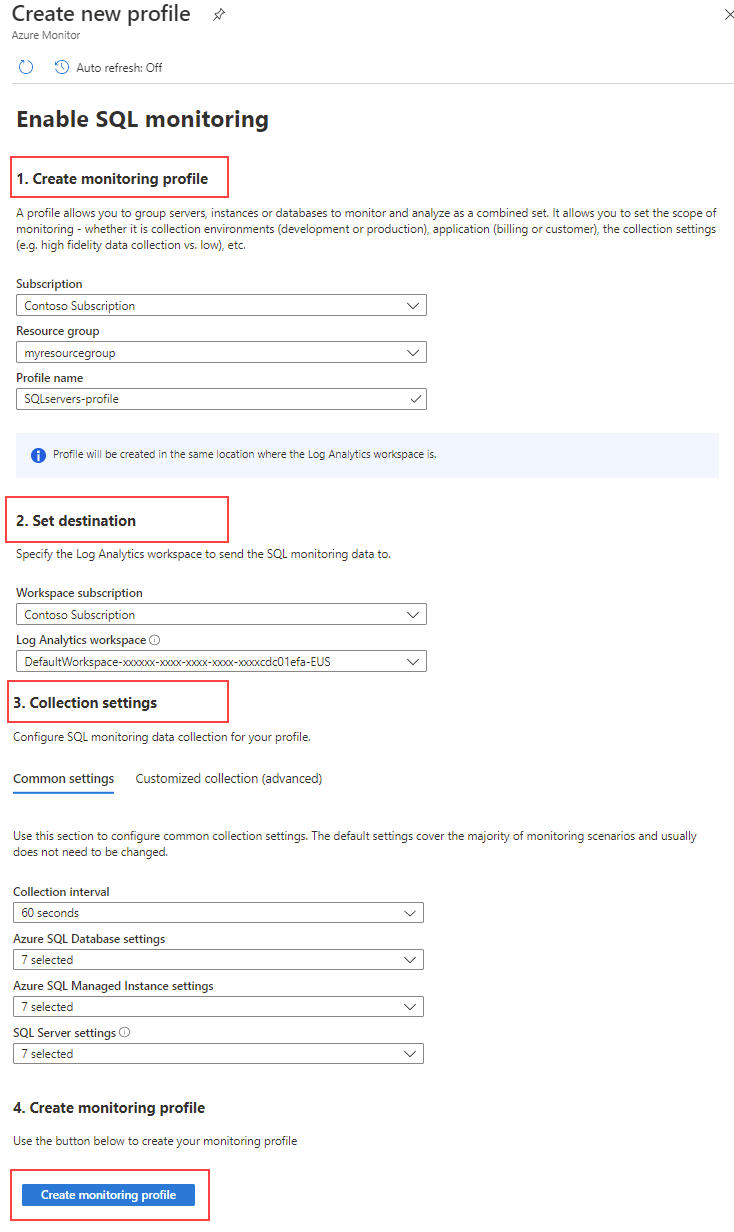
From the Create new profile page, configure the following components:
Monitoring profile – group servers, instances or databases to monitor.
Log Analytics workspace – where to send the SQL monitoring data to.
Collection settings – you can customize the data collection for your profile. The default settings cover the majority of monitoring scenarios and usually don't need to be changed.
After you're done, select Create monitoring profile.
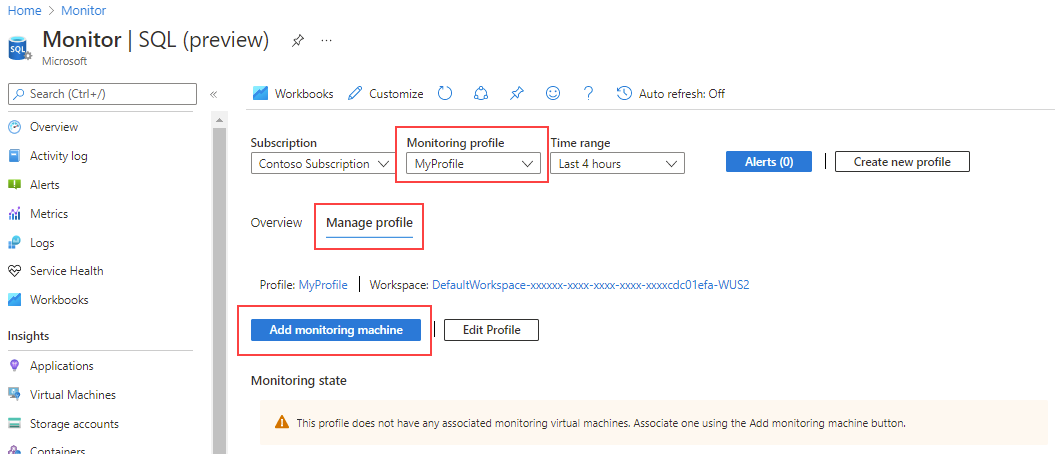
Back to the SQL (preview) page, select the Manage profile tab, and then Add monitoring machine.
Note
Make sure you have a dedicated virtual machine created before proceed to the next step. At this time, the only supported virtual machine OS is Ubuntu 18.04.
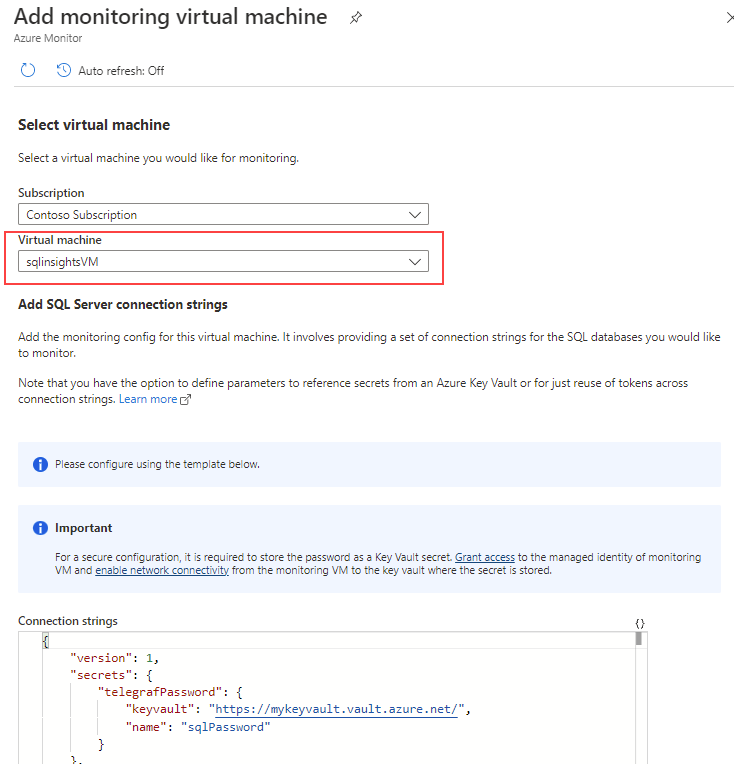
On the Add monitoring virtual machine page, ensure you select the virtual machine name, the SQL Server connection strings, and that the following pre-requisites are satisfied:
- Set permissions for SQL accounts
- Create firewall and networking rules for SQL resource or virtual machine
To learn more about how to enable SQL Insights, see Enable SQL insights (preview).
Limitations
SQL insights has no support or has limited support for the following components:
- Non-Azure instances
- Azure SQL Database elastic pools
- Azure SQL Database running on Basic, S0, S1, and S2 service tiers
- Azure SQL Database serverless tier
- Multiple secondary replicas
- Authentication with Microsoft Entra ID. Only SQL authentication is supported
Azure SQL Insights is a cloud monitoring solution that brings together performance metrics at scale in a single view.
In addition to visualization and data collection, it has built-in intelligence for troubleshooting activities. Furthermore, it allows for custom monitoring alerts and rules that allow for quick identification and resolution of issues.