Monitor tenants in a multitenant database
Monitoring your database can provide valuable information about the types and frequency of queries that are being executed against your data, and who is running those queries. Data that's collected from monitoring can also help you troubleshoot and optimize your multitenant Azure Cosmos DB for PostgreSQL cluster.
Tailspin Toys requested that you devise a solution to monitor activity in the database and provide a mechanism for identifying which tenants are most active and using more resources than others. Tailspin Toys is interested in learning more about:
- Which tenant is most active and using the most database resources?
- How many queries are spanning shards?
- Are any tenants creating load hot spots?
Monitor per-tenant statistics
When you monitor activity in a multitenant SaaS database, it's crucial that you can view database usage and statistics on a per-tenant basis so that you understand the impact each tenant has on database performance. The citus_stat_statements view allows you to get clear insights into what your tenants are doing.
SELECT * FROM citus_stat_statements;
-[ RECORD 1 ]-+---------------------------------------------------------
-
queryid       | -7719494451205117063
userid        | 16384
dbid          | 16385
query         | SELECT p.product_id, p.name FROM stores AS s
              |     INNER JOIN products AS p ON s.store_id = p.store_id
              |     WHERE s.store_id = $1
executor      | adaptive
partition_key | 336
calls         | 2
-[ RECORD 2 ]-+---------------------------------------------------------
-
queryid       | -5037935943477454275
userid        | 16384
dbid          | 16385
query         | SELECT p.product_id,
              |         p.name,
              |         SUM(l.quantity) AS total_ordered,
              |         COUNT(p.product_id) AS count_of_orders_containing_product
              |     FROM products AS p
              |     INNER JOIN line_items AS l ON p.store_id = l.store_id AND p.product_id = l.product_id
              |     WHERE p.store_id = $1
              |     GROUP BY p.store_id, p.product_id
              |     ORDER BY total_ordered DESC
              |     LIMIT $2
executor      | adaptive
partition_key | 5
calls         | 1
By inspecting the output, you can see that each record includes the query that was executed and the parition_key (that is, tenant ID) that executed the query. For cross-partition queries, the partition_key value is empty. This information allows you to write queries against the citus_stat_statements table specific to individual tenants.
Identify "noisy" tenants
Due to the differences in store sizes in the Tailspin Toys multitenant SaaS application, you suspect that some of the larger tenants are "noisier" than others. The tables use a higher percentage of database resources, and they cause performance degradation for other, smaller tenants. By joining citus_stat_statements with pg_stat_statements, you can retrieve per-tenant statistics and trace queries to originating tenants in the Tailspin Toys multitenant application.
SELECT partition_key as tenant_id,
    count(*) as tenant_unique_queries,
    sum(c.calls) as tenant_total_queries,
    sum(total_exec_time) as total_query_time
FROM citus_stat_statements AS c
INNER JOIN pg_stat_statements AS p ON c.queryid = p.queryid
WHERE partition_key is not null
GROUP BY tenant_id
ORDER BY tenant_total_queries DESC
LIMIT 5;
The information that this query provides can help you identify tenants to isolate. It can show you which tenants are executing the highest number of queries and consuming the most query execution time.
 tenant_id | tenant_unique_queries | tenant_total_queries | total_query_time
-----------+-----------------------+----------------------+------------------
 5         |                   148 |               159295 |        753142.54
 336       |                  2045 |                23846 |         12957.83
 147       |                    74 |                 9572 |          8492.05
 282       |                   175 |                12753 |          6876.11
 222       |                   375 |                 3653 |          6422.93
Identify tenants that use the most storage space
Determining the amount of storage space used per tenant in the Tailspin Toys database requires using several built-in Citus functions. The following example query uses a common table expression (CTE) to calculate the percentage of the orders table size for by each tenant. The CTE is then referenced to retrieve the shardid value that's associated with each store and calculate the percentage of storage space that's used as a function of the overall orders table size. In addition, the percentage of storage used in the shard is determined.
-- Get the percentage of table and shard size per tenant
WITH order_percentage AS (
    SELECT
        store_id,
        COUNT(store_id) / SUM(count(*)) OVER() AS pct_of_orders
    FROM orders
    GROUP BY store_id
    ORDER BY pct_of_orders DESC
)
SELECT store_id,
    (SELECT get_shard_id_for_distribution_column('orders', store_id)) AS shardid,
    pg_size_pretty(pct_of_orders * citus_table_size('orders')) AS storage_space_used,
    ROUND(pct_of_orders, 4) AS percent_of_table_size,
    ROUND((
        SELECT (pct_of_orders * citus_table_size('orders'))/SUM(shard_size)
        FROM citus_shards
        WHERE shardid = (SELECT get_shard_id_for_distribution_column('orders', store_id))
    ), 4) AS percent_of_shard_size
FROM order_percentage
LIMIT 5;
The function references the shard information view (citus_shards) to retrieve the size of each shard that hosts order table data. It uses the built-in get_shard_id_for_distribution_column() function to locate the specific shards that host order table data.
By using this query, you can find tenants that occupy a high percentage of space in the shard where they're located. Resource contention can often happen when one or a few tenants make up a large portion of the data in an individual shard. This query provides information that can help you identify tenants that are potential candidates for isolation or that might indicate that rebalancing is required.
Monitor cross-shard queries versus single-shard queries
In the Tailspin Toys multitenant database, you would expect most queries to target a single tenant and run on a single shard. By using citus_stat_statements, you can query for the percentage of queries that span shards. Seeing too many multitenant (that is, cross-shard) queries indicates that the proper filters might not be applied to correctly match a single tenant. The results are unnecessary network calls, slower performance, and possible security issues.
To view a breakdown of how many cross-shard versus single-shard queries are happening in the database, you can run the following code:
SELECT to_char((cross_shard * 100) / total, '99D99') as cross_shard,
       to_char((shard * 100) / total, '99D99') as shard
FROM (
    SELECT
       sum(calls) AS total,
       sum(calls) FILTER (WHERE partition_key is NULL) AS cross_shard,
       sum(calls) FILTER (WHERE partition_key is not null) AS shard
    FROM citus_stat_statements
) AS t;
For multitenant SaaS applications, there are typically a few cross-tenant queries executed by the SaaS provider. These queries are commonly used to collect internal statistics about customers and how they use the application. However, the Tailspin Toys tenant stores are prohibited from viewing each other's data, so monitoring the percentage of cross-shard queries can be a valuable tool in validating application queries are working as expected. A noteworthy increase in this ratio might indicate that queries aren't filtering as expected.
 cross_shard | shard
-------------+--------
   7.14      |  92.86
This query provides a clear view into the percentage of queries that are executed in the database are cross-shard and can potentially be optimized. From here, you can determine a baseline for the percentage of cross-shard queries that come from your SaaS application and analytics and monitoring solutions. If you see an increase in cross-shard queries after application updates, you should raise errors or send alerts on cross-shard application queries, and gradually start removing them from your app or modifying them accordingly.
Monitor skewness and rebalance shards
In the Tailspin Toys multitenant SaaS application, some tenants are larger than others and receive many more orders. The imbalance creates load hot spots. Over time, this uneven distribution of order data can result in some shards becoming skewed. The shards contain more data and occupy more space than other shards. The nodes that store the largest shards ultimately do more work than nodes that have less data. This work distribution affects overall system and query performance.
By querying the citus_shards values, you can view and compare the total size of the shards on each node for your tables:
SELECT table_name, nodename, SUM(shard_size) AS size
FROM citus_shards
GROUP BY table_name, nodename
ORDER BY table_name, size DESC;
If you view the shard size values for Tailspin Toys, you can see that one node for both orders and line_items is almost twice the size of the other nodes. This size difference is a good indicator of skewness. Here's example of the output:
 table_name |                              nodename                               |   size
------------+---------------------------------------------------------------------+-----------
 stores     | private-c.learn-cosmosdb-postgresql-kb.postgres.database.azure.com  |     90112
 stores     | private-w0.learn-cosmosdb-postgresql-kb.postgres.database.azure.com |     90112
 stores     | private-w1.learn-cosmosdb-postgresql-kb.postgres.database.azure.com |     81920
 products   | private-c.learn-cosmosdb-postgresql-kb.postgres.database.azure.com  |   1761280
 products   | private-w0.learn-cosmosdb-postgresql-kb.postgres.database.azure.com |   1925120
 products   | private-w1.learn-cosmosdb-postgresql-kb.postgres.database.azure.com |   1613824
 orders     | private-c.learn-cosmosdb-postgresql-kb.postgres.database.azure.com  | 225689600
 orders     | private-w0.learn-cosmosdb-postgresql-kb.postgres.database.azure.com | 124985344
 orders     | private-w1.learn-cosmosdb-postgresql-kb.postgres.database.azure.com | 120225792
 line_items | private-c.learn-cosmosdb-postgresql-kb.postgres.database.azure.com  | 437911552
 line_items | private-w0.learn-cosmosdb-postgresql-kb.postgres.database.azure.com | 239124480
 line_items | private-w1.learn-cosmosdb-postgresql-kb.postgres.database.azure.com | 227508224
You can also use the Azure portal to inspect skewness and get a recommendation about whether rebalancing is recommended.
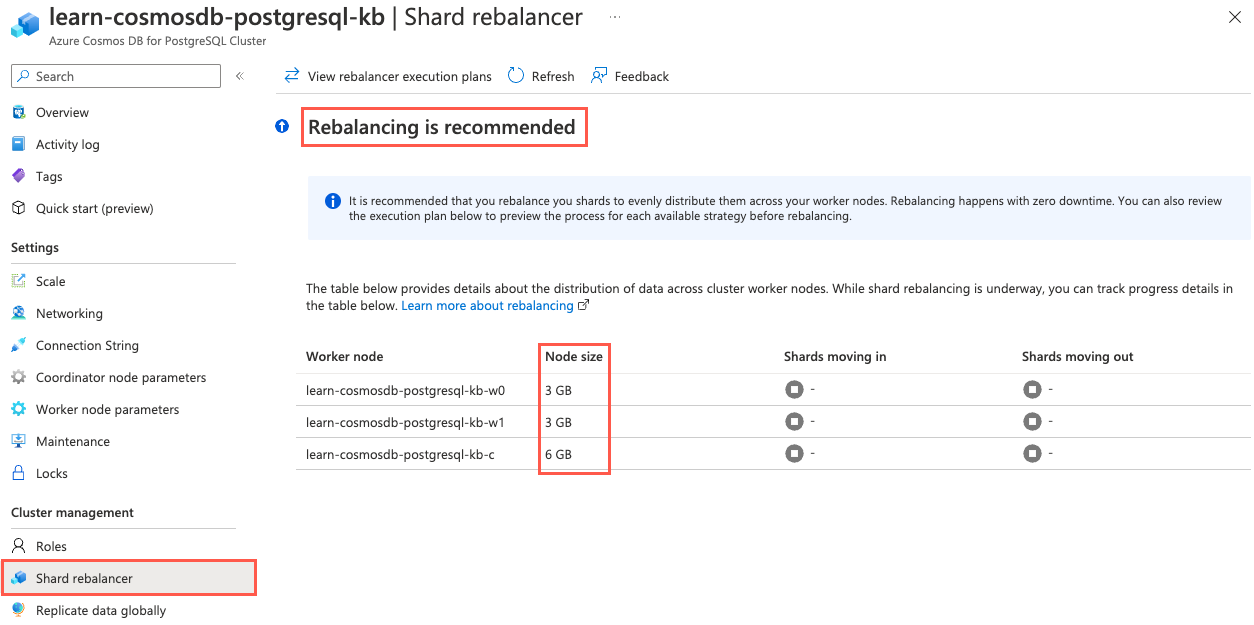
Rebalancing moves shards between nodes, more evenly distributing data. The shard rebalancer handles this process without downtime or disruption to the database. You can run the rebalancer by executing the rebalance_table_shards() function.
SELECT rebalance_table_shards('orders', rebalance_strategy:='by_disk_size');
The function rebalances all tables in the same colocation group, so repeating the process for every distributed table is unnecessary.
After you initiate the shard rebalancer, you see an output that indicates which shards are being moved and to what node. Run the query against citus_shards again to view shard sizes per table and reveal that the total shard sizes on each node are more evenly distributed.
 table_name |                              nodename                               |   size
------------+---------------------------------------------------------------------+-----------
 stores     | private-w1.learn-cosmosdb-postgresql-kb.postgres.database.azure.com |    106496
 stores     | private-w0.learn-cosmosdb-postgresql-kb.postgres.database.azure.com |    106496
 stores     | private-c.learn-cosmosdb-postgresql-kb.postgres.database.azure.com  |     49152
 products   | private-w0.learn-cosmosdb-postgresql-kb.postgres.database.azure.com |   2318336
 products   | private-w1.learn-cosmosdb-postgresql-kb.postgres.database.azure.com |   2187264
 products   | private-c.learn-cosmosdb-postgresql-kb.postgres.database.azure.com  |    753664
 orders     | private-c.learn-cosmosdb-postgresql-kb.postgres.database.azure.com  | 172040192
 orders     | private-w1.learn-cosmosdb-postgresql-kb.postgres.database.azure.com | 161734656
 orders     | private-w0.learn-cosmosdb-postgresql-kb.postgres.database.azure.com | 155402240
 line_items | private-c.learn-cosmosdb-postgresql-kb.postgres.database.azure.com  | 336019456
 line_items | private-w1.learn-cosmosdb-postgresql-kb.postgres.database.azure.com | 307372032
 line_items | private-w0.learn-cosmosdb-postgresql-kb.postgres.database.azure.com | 297762816
It's important to note that standard shard rebalancing distributes shards to equalize node storage usage. It doesn't examine which tenants are allocated on each shard, so although it can improve overall performance, it might or might not enhance the mixing of large and small tenants.