Design centralized logging and auditing
Logging and auditing in Microsoft cloud security benchmark
Microsoft cloud security benchmark provides guidance on designing logging capabilities, which is summarized in the following table. For more complete information about these controls, see Microsoft cloud security benchmark - Logging and threat detection
Please refer to Introduction to Microsoft Cybersecurity Reference Architecture and cloud security benchmark for more background on Microsoft Cloud Security Benchmark.
In the summary below, we have included controls from the full baseline where:
- Security controls were supported but not enabled by default
- There was explicit guidance which contained action to be taken on the part of the customer
| Control number | Title | Summary |
|---|---|---|
| LT-3 | Enable logging for security investigation | Enable logging for your cloud resources to meet the requirements for security incident investigations and security response and compliance purposes. |
| LT-4 | Enable network logging for security investigation | Enable logging for your network services to support network-related incident investigations, threat hunting, and security alert generation. The network logs may include logs from network services such as IP filtering, network and application firewall, DNS, flow monitoring and so on. |
| LT-5 | Centralize security log management and analysis | Centralize logging storage and analysis to enable correlation across log data. For each log source, ensure that you have assigned a data owner, access guidance, storage location, what tools are used to process and access the data, and data retention requirements. Use Cloud native SIEM if you don't have an existing SIEM solution for CSPs. or aggregate logs/alerts into your existing SIEM. |
| LT-6 | Configure log storage retention | Plan your log retention strategy according to your compliance, regulation, and business requirements. Configure the log retention policy at the individual logging services to ensure the logs are archived appropriately. |
Centralized logging on Azure
The recommended logging guidance from MCSB on Azure is the following:
- Ensure that you are integrating Azure activity logs into a centralized Log Analytics workspace.
- Use Azure Monitor to query and perform analytics and create alert rules using the logs aggregated from Azure services, endpoint devices, network resources, and other security systems.
- In addition, enable and onboard data to Microsoft Sentinel which provides the security information event management (SIEM) and security orchestration automated response (SOAR) capability.
Azure Monitor overview
Azure Monitor is a comprehensive monitoring solution for collecting, analyzing, and responding to telemetry from your cloud and on-premises environments. You can use Azure Monitor to maximize the availability and performance of your applications and services.
Azure Monitor collects and aggregates the data from every layer and component of your system into a common data platform. It correlates data across multiple Azure subscriptions and tenants, in addition to hosting data for other services. Because this data is stored together, it can be correlated and analyzed using a common set of tools. The data can then be used for analysis and visualizations to help you understand how your applications are performing and respond automatically to system events.
Azure Monitor also includes Azure Monitor SCOM Managed Instance, which allows you to move your on-premises System Center Operation Manager (Operations Manager) installation to the cloud in Azure.
Use Azure Monitor to monitor these types of resources in Azure, other clouds, or on-premises:
- Applications
- Virtual machines
- Guest operating systems
- Containers
- Databases
- Security events in combination with Azure Sentinel
- Networking events and health in combination with Network Watcher
- Custom sources that use the APIs to get data into Azure Monitor
- Collect your Prometheus metrics with Azure Managed Prometheus and analyze them using PromQL in Azure Managed Grafana.
You can also export monitoring data from Azure Monitor into other systems so you can:
- Integrate with other third-party and open-source monitoring and visualization tools
- Integrate with ticketing and other ITSM systems
High level architecture
The following diagram gives a high-level view of Azure Monitor.
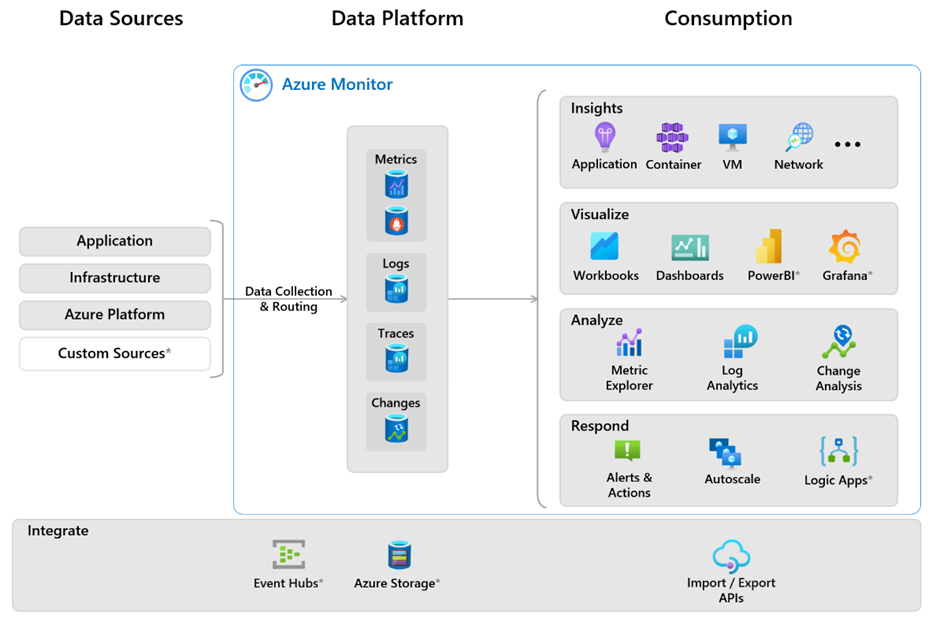
The diagram depicts the Azure Monitor system components:
- The data sources are the types of data collected from each monitored resource. The data is collected and routed to the data platform.
- The data platform is made up of the data stores for collected data. Azure Monitor's data platform has stores for metrics, logs, traces, and changes.
- The functions and components that consume data include analysis, visualizations, insights, and responses.
- Services that integrate with Azure Monitor to provide additional functionality and are integrated throughout the system.
Data sources
Azure Monitor can collect data from multiple sources, including from your application, operating systems, the services they rely on, and from the platform itself.
You can integrate monitoring data from sources outside Azure, including on-premises and other non-Microsoft clouds, using the application, infrastructure, and custom data sources.
Azure Monitor collects these types of data:
| Data type | Description |
|---|---|
| Application | Data about the performance and functionality of your application code on any platform. |
| Infrastructure | - Container. Data about containers, such as Azure Kubernetes Service, Prometheus, and about the applications running inside containers. - Operating system. Data about the guest operating system on which your application is running. |
| Azure Platform | - Azure resource. The operation of an Azure resource. - Azure subscription. The operation and management of an Azure subscription, and data about the health and operation of Azure itself. - Azure tenant. Data about the operation of tenant-level Azure services, such as Microsoft Entra ID. - Azure resource changes. Data about changes within your Azure resources and how to address and triage incidents and issues. |
| Custom Sources | Use the Azure Monitor REST API to send customer metric or log data to Azure Monitor and incorporate monitoring of resources that don’t expose monitoring data through other methods. |
For detailed information about each of the data sources, see data sources.
Data collection and routing
Azure Monitor collects and routes monitoring data using several mechanisms, depending on the data being routed and the destination data platform stores.
| Collection method | Description |
|---|---|
| Direct data routing | Platform metrics are sent automatically to Azure Monitor Metrics by default and without configuration. |
| Diagnostic settings | Use diagnostic settings to determine where to send resource and activity log data on the data platform. |
| Data collection rules | Use data collection rules to specify what data should be collected, how to transform that data, and where to send that data. |
| Application SDK | Add the Application Insights SDK to your application code to receive, store, and explore your monitoring data. The SDK pre-processes telemetry and metrics before sending the data to Azure where it's ingested and processed further before being stored in Azure Monitor Logs. |
| Azure Monitor REST API | The Logs Ingestion API in Azure Monitor lets you send data to a Log Analytics workspace from any REST API client. |
| Azure Monitor Agents | Azure Monitor Agent (AMA) collects monitoring data from the guest operating system of Azure and hybrid virtual machines and delivers it to Azure Monitor for use by features, insights, and other services, such as Microsoft Sentinel and Microsoft Defender for Cloud. |
| Azure Monitor managed service for Prometheus | Azure Monitor managed service for Prometheus lets you collect and analyze metrics at scale using a Prometheus-compatible monitoring solution, based on the Prometheus project from the Cloud Native Compute Foundation. |
For detailed information about data collection, see data collection.
Data platform
Azure Monitor stores data in data stores for each of the pillars of observability: metrics, logs, distributed traces, and changes. Each store is optimized for specific types of data and monitoring scenarios.
| Pillar of observability/ Data store |
Description |
|---|---|
| Azure Monitor Metrics | Metrics are numerical values that describe an aspect of a system at a particular point in time. Azure Monitor Metrics is a time-series database, optimized for analyzing time-stamped data. Azure Monitor collects metrics at regular intervals. Metrics are identified with a timestamp, a name, a value, and one or more defining labels. They can be aggregated using algorithms, compared to other metrics, and analyzed for trends over time. It supports native Azure Monitor metrics and Prometheus metrics |
| Azure Monitor Logs | Logs are recorded system events. Logs can contain different types of data, be structured or free-form text, and they contain a timestamp. Azure Monitor stores structured and unstructured log data of all types in Azure Monitor Logs. You can route data to Log Analytics workspaces for querying and analysis. |
| Traces | Distributed traces identify the series of related events that follow a user request through a distributed system. A trace measures the operation and performance of your application across the entire set of components in your system. Traces can be used to determine the behavior of application code and the performance of different transactions. Azure Monitor gets distributed trace data from the Application Insights SDK. The trace data is stored in a separate workspace in Azure Monitor Logs. |
| Changes | Changes are a series of events in your application and resources. They're tracked and stored when you use the Change Analysis service, which uses Azure Resource Graph as its store. Change Analysis helps you understand which changes, such as deploying updated code, may have caused issues in your systems. |